. 2022 Nov 15;132(22):e159628.
doi: 10.1172/JCI159628.

RAD21 amplification epigenetically suppresses interferon signaling to promote immune evasion in ovarian cancer

Affiliations

RAD21 amplification epigenetically suppresses interferon signaling to promote immune evasion in ovarian cancer

Peng Deng et al. J Clin Invest. .

Abstract

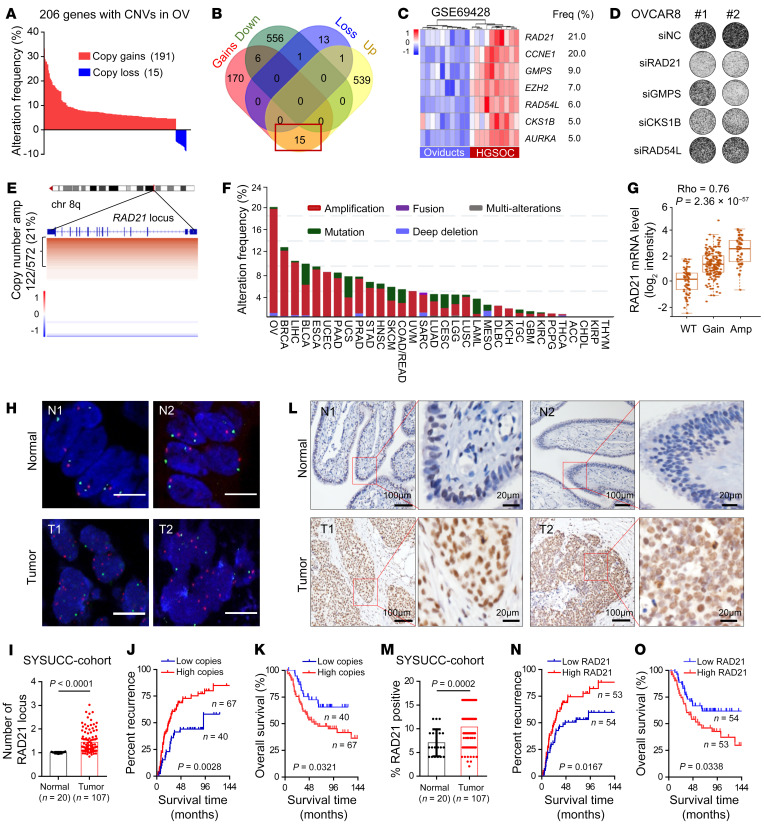
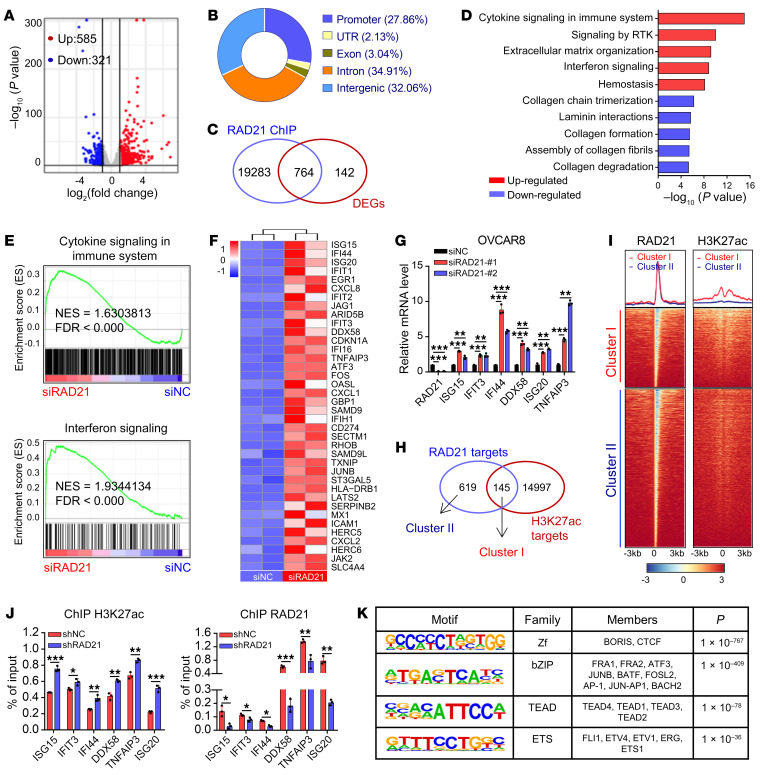
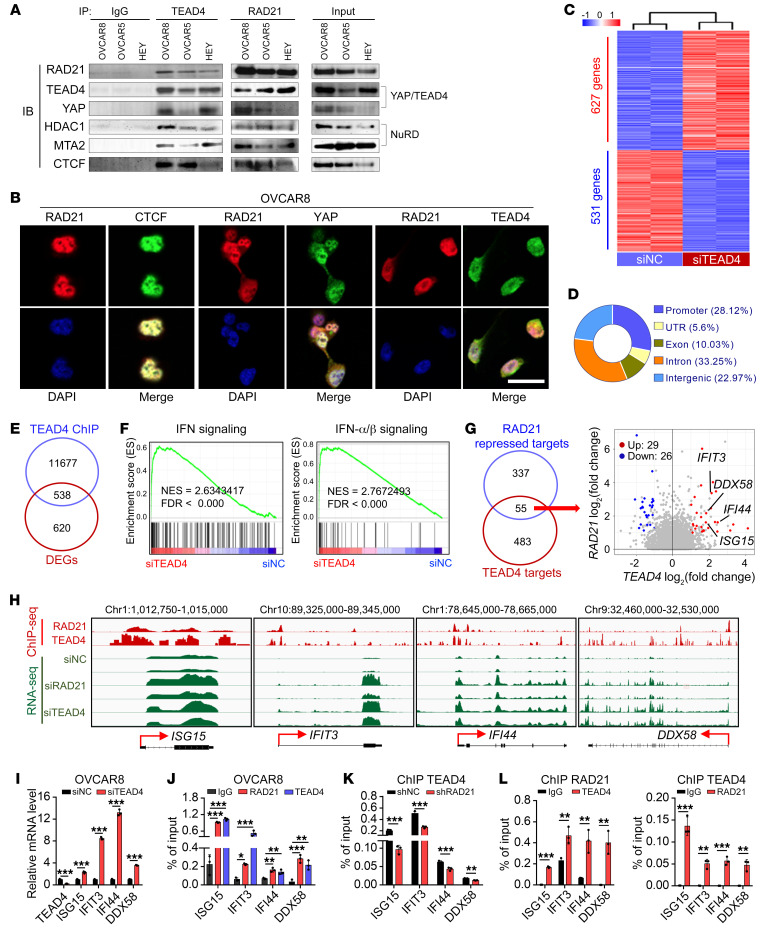
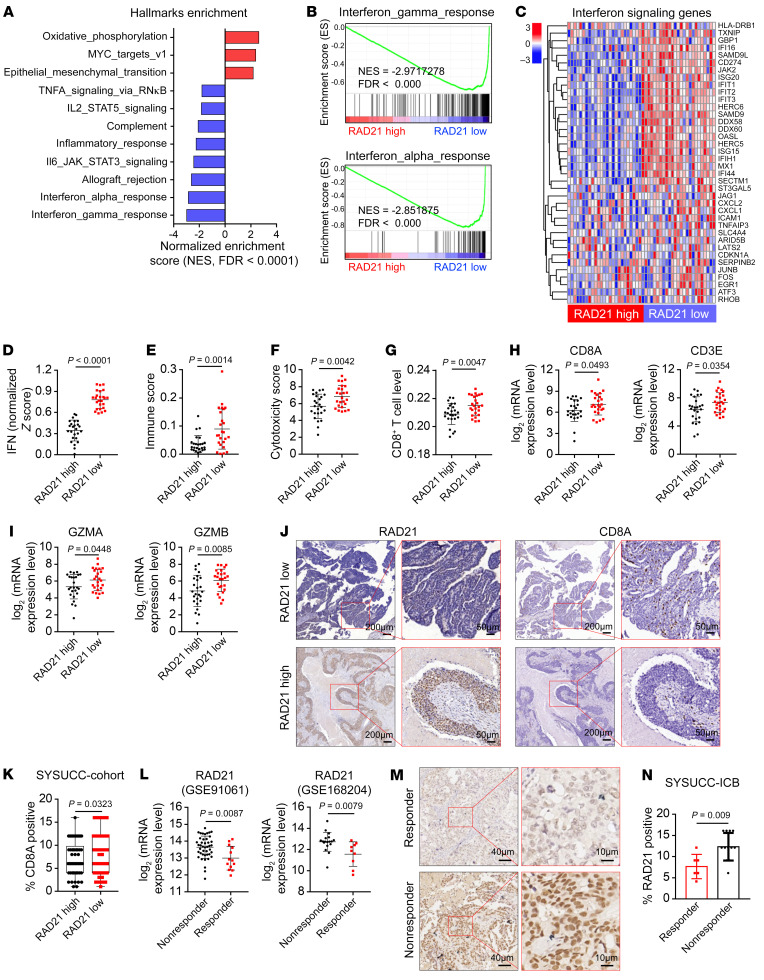
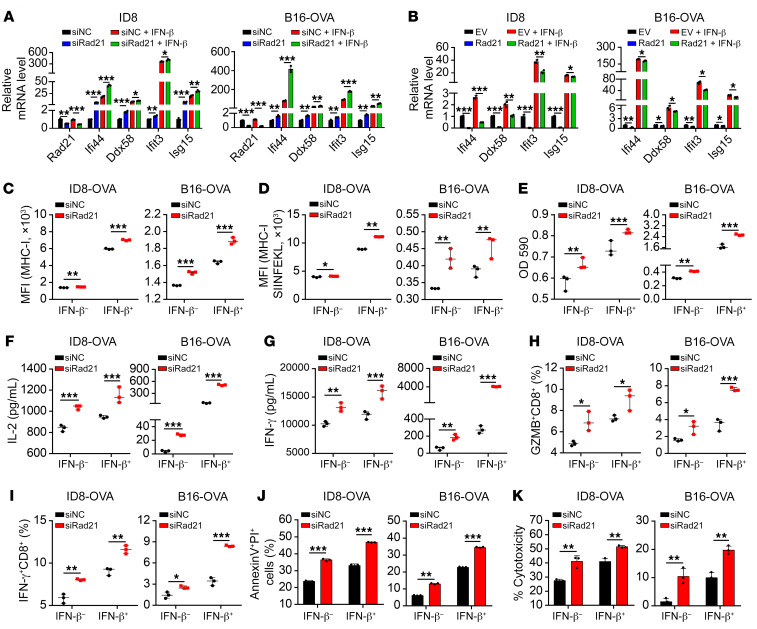
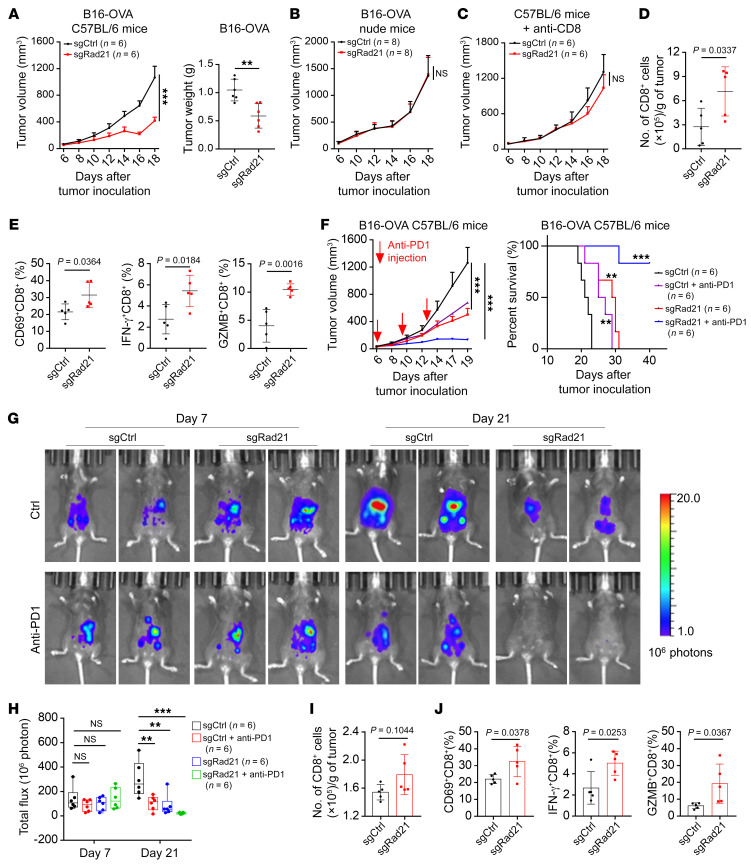
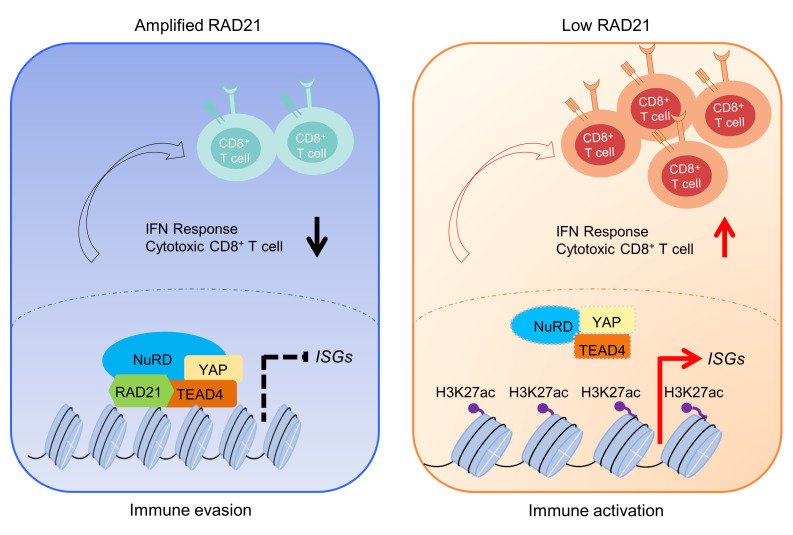
Prevalent copy number alteration is the most prominent genetic characteristic associated with ovarian cancer (OV) development, but its role in immune evasion has not been fully elucidated. In this study, we identified RAD21, a key component of the cohesin complex, as a frequently amplified oncogene that could modulate immune response in OV. Through interrogating the RAD21-regulated transcriptional program, we found that RAD21 directly interacts with YAP/TEAD4 transcriptional corepressors and recruits the NuRD complex to suppress interferon (IFN) signaling. In multiple clinical cohorts, RAD21 overexpression is inversely correlated with IFN signature gene expression in OV. We further demonstrated in murine syngeneic tumor models that RAD21 ablation potentiated anti-PD-1 efficacy with increased intratumoral CD8+ T cell effector activity. Our study identifies a RAD21-YAP/TEAD4-NuRD corepressor complex in immune modulation, and thus provides a potential target and biomarker for precision immunotherapy in OV.

Keywords: Cancer immunotherapy; Epigenetics; Genetic instability; Immunology; Oncology.


Conflict of interest statement

Conflict of interest: The authors have declared that no conflict of interest exists.

Figures

Figure 1
Figure 1. RAD21 is a critical CNA gene and amplified RAD21 correlates with poor prognosis in HGSOC.
(A) Bar graph showing the CNA frequencies (191 copy gains and 15 copy loss) in the TCGA-OV database. (B) Venn diagram showing the overlap of 206 CNAs and DEGs in human OV in the TCGA database (TCGA-OV transcriptome_U133A-seq database, adjusted P value < 0.01, |log2foldchange| > 1). (C) Heatmap for upregulated genes (adjusted P value < 0.01) in 10 pairs of independent patients from GSE69428 database. (D) Representative images of colony formation assay in OVCAR8 cells transfected with scramble siRNA or 2 individual siRNAs targeting RAD21, GMPS, CKS1B, and RAD54L, respectively. (E) Integrative Genomics Viewer heatmap displays the CNAs on the RAD21 locus, obtained from data of OV in cBioportal (n = 572; copy number amplification was defined as copy number score > 0.3). (F) Genetic alteration frequency of RAD21 in TCGA pan-cancer database. (G) Correlation analysis showing an increase in RAD21 mRNA level concordant with the gain of an additional DNA copy (Gain) and/or multiple copies (Amp) (Spearman ρ = 0.76; P = 2.36 × 10–57). (H and I) Representative images (H) and quantification (I) of FISH showing RAD21 locus in ovarian tumor (n = 107) and normal fallopian tube tissue (n = 20) from SYSUCC cohort. Blue, DNA stained with DAPI; green, centromere of chromosome 8; red, genomic locus of RAD21 gene. Scale bars: 5 μm. (J and K) Kaplan-Meier curves of recurrence time (J) and overall survival rates (K) in patients with OV grouped according to high (red, n = 67) and low (blue, n = 40) copies of RAD21 (log-rank test). (L and M) Representative IHC staining (L) and quantification (M) showing RAD21 expression in ovarian tumor (n = 107) and normal fallopian tube tissue (n = 20) from SYSUCC cohort. (N and O) Kaplan-Meier curves of recurrence time (N) and overall survival rates (O) in patients with OV grouped according to high (red, n = 53) and low (blue, n = 54) expression of RAD21 (log-rank test). Data in I and M are shown as mean ± SD (2-tailed t test).
Figure 2
Figure 2. Genome-wide identification of potential targets of RAD21 and its associated cohesin complexes.
(A) Scatterplot of DEGs between RAD21-knockdown (RAD21-KD) and control OVCAR8 cells (duplicates, P < 0.05, |log2foldchange| > 1). (B) Genomic distribution of RAD21 peaks in OVCAR8 cells. (C) Venn diagram showing the overlaps of DEGs and RAD21 direct targets obtained from ChIP-Seq results. (D) The 764 DEGs described in C were functionally clustered using the RECTOME gene sets. The top 5 upregulated and downregulated pathways are shown. (E) GSEA analysis showing that Cytokine Signaling in Immune System and IFN Signaling were enriched among the upregulated pathways. NES, normalized enrichment score. (F) Heatmap for significantly upregulated IFN signaling genes (P < 0.05) in RAD21-KD versus control OVCAR8 cells. (G) qRT-PCR validation of representative ISGs in RAD21-KD and control OVCAR8 cells. Data are shown as mean ± SD (n = 3, 1-way ANOVA). (H) Venn diagram showing the overlaps of RAD21 direct targets and H3K27ac targets. Two clusters (cluster I [common] and cluster II [RAD21 unique]) were divided according to H3K27ac signals. (I) Heatmap showing the binding patterns for RAD21 and H3K27ac at accessible regions of cluster I and cluster II genes. (J) ChIP-qPCR validation of representative ISGs in RAD21-KD and control OVCAR8 cells using antibodies against H3K27ac (left) and RAD21 (right). Data are shown as mean ± SD (n = 3, 2-tailed t test). (K) DNA motif analysis in RAD21 ChIP-Seq peaks showing the significant enrichment of BORIS and TEAD4 motif (hypergeometric test). *P < 0.05; **P < 0.01; ***P < 0.001.
Figure 3
Figure 3. RAD21 directly interacts with YAP/TEAD4 transcriptional corepressor complex to coordinately suppress ISGs.
(A) Coimmunoprecipitation by anti-IgG, anti-TEAD4, and anti-RAD21 antibodies followed by immunoblotting (IB) with antibodies against the indicated proteins using cell extracts from OVCAR8, OVCAR5, and HEY cells. (B) Colocalization of RAD21 with CTCF (left, positive control), YAP (middle), and TEAD4 (right) was visualized by immunofluorescence. Scale bar: 20 μm. (C) Heatmap for DEGs (P < 0.01, |log2foldchange| > 1) in TEAD4-KD and control OVCAR8 cells (duplicates). (D) Genomic distribution of TEAD4 peaks in OVCAR8 cells. (E) Venn diagram showing the overlaps of DEGs and TEAD4 direct targets obtained from TEAD4 ChIP-Seq results. (F) GSEA analysis showing that the IFN Signaling and IFN-α/β Signaling pathways were enriched in TEAD4-KD cells compared with control cells. (G) Venn diagram (left) and scatterplot (right) showing the precise targets repressed by RAD21 and TEAD4. (H) Genome browser tracks of RAD21 and TEAD4 ChIP-Seq and RNA-Seq at genomic loci of ISG15, IFIT3, IFI44, and DDX58. (I) qRT-PCR validation of representative ISGs in TAED4-KD and control OVCAR8 cells. (J) ChIP-qPCR analysis of RAD21 and TEAD4 occupancy at genomic loci of ISGs ISG15, IFIT3, IFI44, and DDX58 in OVCAR8 cells. Data are shown as mean ± SD (n = 3, 1-way ANOVA). (K) ChIP-qPCR analysis of TEAD4 occupancy at genomic loci of ISGs ISG15, IFIT3, IFI44, and DDX58 in RAD21-KD and control OVCAR8 cells mediated by shRNA. (L) Re-ChIP analysis showing the concurrent presence of both RAD21 and TEAD4 at genomic loci of ISGs ISG15, IFIT3, IFI44, and DDX58. Data in I, K, and L are shown as mean ± SD (n = 3, 2-tailed t test). *P < 0.05; **P < 0.01; ***P < 0.001.
Figure 4
Figure 4. RAD21 inversely correlates with IFN signaling activity in OV.
(A) Normalized enrichment scores correlated with RAD21 expression using Hallmark gene sets from TCGA-OV database (high vs. low RAD21 expression, top vs. bottom 10%; n = 25 per group). (B and C) GSEA analysis (B) and heatmaps (C) showing the inverse correlation between RAD21 expression and the IFN signaling pathways and genes in the TCGA-OV database. (DI) Comparative analysis showing the association of high expression of RAD21 with low expression of IFN activity (D), immune score (E), cytotoxicity score (F), infiltration levels of CD8+ T cells (G), and expression of T cell marker genes CD8A, CD3E (H), GZMA, and GZMB (I) in patients with OV from the TCGA database. (J and K) Representative IHC staining (J) and quantification (K) showing the inverse correlation between RAD21 expression and CD8A expression in ovarian tumors (SYSUCC cohort). (L) Correlation of RAD21 mRNA levels with response to ICB in patients with melanoma treated with PD-1, PD-L1, or CTLA4 mAbs (GSE91061 and GSE168204). (M and N) Representative IHC images (M) and quantification (N) for RAD21 expression in OV responders (n = 6) versus nonresponders (n = 12) to immune checkpoint inhibitors. Data in DI, K, L, and N are shown as mean ± SD (2-tailed t test).
Figure 5
Figure 5. RAD21 ablation induces T cell activation in vitro.
(A and B) qRT-PCR validation of representative ISGs Ifi44, Ddx58, Ifit3, and Isg15 in Rad21-KD or Rad21-overexpressed and control ID8 cells and B16-OVA cells in the presence or absence of IFN-β treatment. (C and D) Expression levels of MHC-I and MHC-I–SIINFEKL on Rad21-KD and control ID8-OVA and B16-OVA cells in the presence or absence of IFN-β treatment were determined by FACS. (EI) Rad21-KD and control ID8-OVA and B16-OVA cells were treated with vehicle or IFN-β and then cocultured with B3Z cells or OT-I cells, after which B3Z activation was determined by LacZ activity (E) and OT-I activation was determined by secretion of IL-2 (F) and IFN-γ (G) and expression of effector molecules GZMB (H) and IFN-γ (I). (J and K) The cytotoxic effect of OT-I was measured by annexin V/propidium iodide staining (J) and LDH release (K) of ID8-OVA and B16-OVA cells after coculture with OT-I for 48 hours. Data in AK are shown as mean ± SD (n = 3, 2-tailed t test). *P < 0.05; **P < 0.01; ***P < 0.001.
Figure 6
Figure 6. RAD21 suppresses antitumor immunity in vivo.
(A) Tumor volume and tumor weight over time in C57BL/6 mice implanted with Rad21-KO and control B16-OVA mouse cells. Data are shown as mean ± SEM (2-way ANOVA) for tumor volume and as mean ± SD (2-tailed t test) for tumor weight (n = 6 mice per group). (B and C) Tumor volume in nude mice (n = 8 mice per group) (B) and C57BL/6 mice (n = 6 mice per group) (C) implanted with Rad21-KO and control B16-OVA mouse cells. Mice were pretreated with CD8-depleting antibodies at –1, 2, and 5 days. Data are shown as mean ± SEM (2-way ANOVA). (D and E) Flow cytometry analysis showing the numbers of tumor-infiltrating CD8+ T cells (D) and expression of activation marker CD69 and effector molecules IFN-γ and GZMB (E) in CD8+ T cells. Data are shown as mean ± SD (n = 5, 2-tailed t test). (F) Mice with established Rad21-KO and control B16-OVA tumors were treated with anti–PD-1 at indicated time points. Tumor volume and survival rates are shown. Data are shown as mean ± SEM (2-way ANOVA). (G) Representative bioluminescence images of mice with established Rad21-KO and control ID8 tumors treated with anti–PD-1 formed by intraperitoneal injection at day 9 and day 12. (H) The bar graph shows the change in bioluminescence in mice. Data are shown as mean ± SEM (1-way ANOVA). (I and J) Flow cytometry analysis showing the numbers of tumor-infiltrating CD8+ T cells (I) and expression of CD69 and effector molecules IFN-γ and GZMB (J). Data are shown as mean ± SD (2-tailed t test). **P < 0.01; ***P < 0.001.
Figure 7
Figure 7. Schematic model for the role of RAD21 in modulating antitumor immunity in OV.
Left: Amplification of RAD21 recruits YAP/TEAD4 and NuRD corepressor complex to suppress ISG expression, which contributes to immune evasion. Right: RAD21 ablation reactivates IFN signaling to enhance antitumor immunity in OV.

References

    1. Siegel RL, et al. Cancer statistics, 2021. CA Cancer J Clin. 2021;71(1):7–33. doi: 10.3322/caac.21654. - DOI - PubMed
    1. Wei SC, et al. Fundamental mechanisms of immune checkpoint blockade therapy. Cancer Discov. 2018;8(9):1069–1086. doi: 10.1158/2159-8290.CD-18-0367. - DOI - PubMed
    1. Halle S, et al. Mechanisms and dynamics of T cell-mediated cytotoxicity in vivo. Trends Immunol. 2017;38(6):432–443. doi: 10.1016/j.it.2017.04.002. - DOI - PubMed
    1. Disis ML, et al. Efficacy and safety of avelumab for patients with recurrent or refractory ovarian cancer: phase 1b results from the JAVELIN solid tumor trial. JAMA Oncol. 2019;5(3):393–401. doi: 10.1001/jamaoncol.2018.6258. - DOI - PMC - PubMed
    1. Bowtell DD, et al. Rethinking ovarian cancer II: reducing mortality from high-grade serous ovarian cancer. Nat Rev Cancer. 2015;15(11):668–679. doi: 10.1038/nrc4019. - DOI - PMC - PubMed

Publication types