Metastatic or xenograft colorectal cancer models induce divergent anabolic deficits and expression of pro-inflammatory effectors of muscle wasting in a tumor-type-dependent manner
- PMID: 36201323
- PMCID: PMC9678410
- DOI: 10.1152/japplphysiol.00247.2022
Metastatic or xenograft colorectal cancer models induce divergent anabolic deficits and expression of pro-inflammatory effectors of muscle wasting in a tumor-type-dependent manner
Abstract
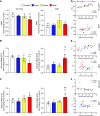
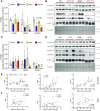
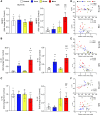
We investigated the impact of tumor burden on muscle wasting in metastatic (m) and xenograft (x) models of colorectal cancer (CRC). Male Nod SCID γ and CD2F1 mice were injected subcutaneously or intrasplenically with HCT116 or C26 tumor cells, respectively. CRC tumors resulted in significant muscle wasting regardless of tumor type or model, although muscle loss was exacerbated in mHCT116 hosts. The mHCT116 model decreased ribosomal (r)RNA content and rDNA transcription, whereas the mC26 model showed no loss of rRNA and the upregulation of rDNA transcription. The xHCT116 model reduced mTOR, RPS6, and 4E-BP1 phosphorylation, whereas the mHCT116 model had a similar effect on RPS6 and 4E-BP1 without altering mTOR phosphorylation. The C26 models caused a reduction in 4E-BP1 phosphorylation independent of mTOR. Muscle interleukin (IL)-6 mRNA was elevated in all models except xHCT116, and the NOD-, LRR-, and pyrin domain-containing protein 3 (NLRP3) mRNA was induced only in the mC26 model. IL-1β mRNA increased in all groups with greater expression in metastatic relative to the xenograft model regardless of tumor types. Our findings indicate that HCT116 tumor burden results in more drastic muscle wasting and anabolic deficits, whereas C26 tumor burden causes similar muscle wasting but exhibits a divergent proinflammatory phenotype. These results highlight potentially important divergence in the pathogenesis of muscle wasting among preclinical models of CRC and demonstrate that tumor burden plays a role in determining anabolic deficits and the expression of proinflammatory effectors of muscle wasting in a tumor-type-dependent manner.NEW & NOTEWORTHY We provide evidence demonstrating that colorectal tumor burden plays a role in determining anabolic deficits and the expression of proinflammatory effectors of muscle wasting in a tumor-type-dependent manner.
Keywords: cachexia; colon cancer; colorectal cancer; inflammation; muscle wasting; ribosomal RNA.
Conflict of interest statement
No conflicts of interest, financial or otherwise, are declared by the authors.
Figures


Similar articles
-
LP07 and LLC preclinical models of lung cancer induce divergent anabolic deficits and expression of pro-inflammatory effectors of muscle wasting.J Appl Physiol (1985). 2022 Dec 1;133(6):1260-1272. doi: 10.1152/japplphysiol.00246.2022. Epub 2022 Oct 6. J Appl Physiol (1985). 2022. PMID: 36201324 Free PMC article.
-
HCT116 colorectal liver metastases exacerbate muscle wasting in a mouse model for the study of colorectal cancer cachexia.Dis Model Mech. 2020 Jan 24;13(1):dmm043166. doi: 10.1242/dmm.043166. Dis Model Mech. 2020. PMID: 31915140 Free PMC article.
-
Formation of colorectal liver metastases induces musculoskeletal and metabolic abnormalities consistent with exacerbated cachexia.JCI Insight. 2020 May 7;5(9):e136687. doi: 10.1172/jci.insight.136687. JCI Insight. 2020. PMID: 32298240 Free PMC article.
-
Exercise as an anti-inflammatory therapy for cancer cachexia: a focus on interleukin-6 regulation.Am J Physiol Regul Integr Comp Physiol. 2020 Feb 1;318(2):R296-R310. doi: 10.1152/ajpregu.00147.2019. Epub 2019 Dec 11. Am J Physiol Regul Integr Comp Physiol. 2020. PMID: 31823669 Review.
-
TNF-α and cancer cachexia: Molecular insights and clinical implications.Life Sci. 2017 Feb 1;170:56-63. doi: 10.1016/j.lfs.2016.11.033. Epub 2016 Dec 3. Life Sci. 2017. PMID: 27919820 Review.
Cited by
-
Anabolic deficits and divergent unfolded protein response underlie skeletal and cardiac muscle growth impairments in the Yoshida hepatoma tumor model of cancer cachexia.Physiol Rep. 2024 Sep;12(18):e70044. doi: 10.14814/phy2.70044. Physiol Rep. 2024. PMID: 39294861 Free PMC article.
-
Does the blunted stimulation of skeletal muscle protein synthesis by aging in response to mechanical load result from impaired ribosome biogenesis?Front Aging. 2023 May 15;4:1171850. doi: 10.3389/fragi.2023.1171850. eCollection 2023. Front Aging. 2023. PMID: 37256189 Free PMC article. Review.
References
-
- Shiono M, Huang K, Downey RJ, Consul N, Villanueva N, Beck K, Fenn K, Dietz D, Yamaguchi T, Kato S, Divgi C, Kalinsky K, Wei Y, Zhang Y, Borczuk AC, Inoue A, Halmos B, Acharyya S. An analysis of the relationship between metastases and cachexia in lung cancer patients. Cancer Med 5: 2641–2648, 2016. doi: 10.1002/cam4.841. - DOI - PMC - PubMed
Publication types
MeSH terms
Substances
Grants and funding
LinkOut - more resources
Full Text Sources
Medical
Miscellaneous

