. 2022 Oct 6;20(10):e3001786.
doi: 10.1371/journal.pbio.3001786. eCollection 2022 Oct.

A caspase-RhoGEF axis contributes to the cell size threshold for apoptotic death in developing Caenorhabditis elegans

Affiliations

A caspase-RhoGEF axis contributes to the cell size threshold for apoptotic death in developing Caenorhabditis elegans

Aditya Sethi et al. PLoS Biol. .

Abstract

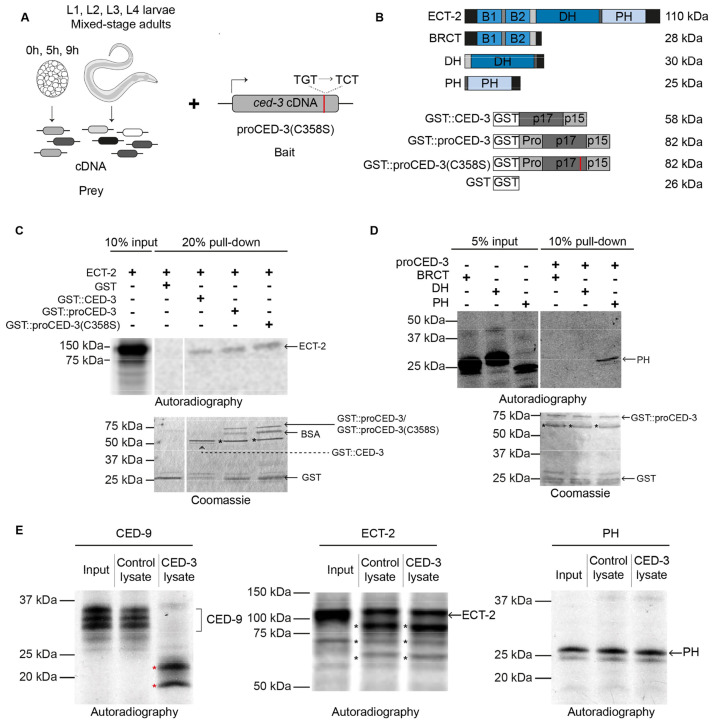
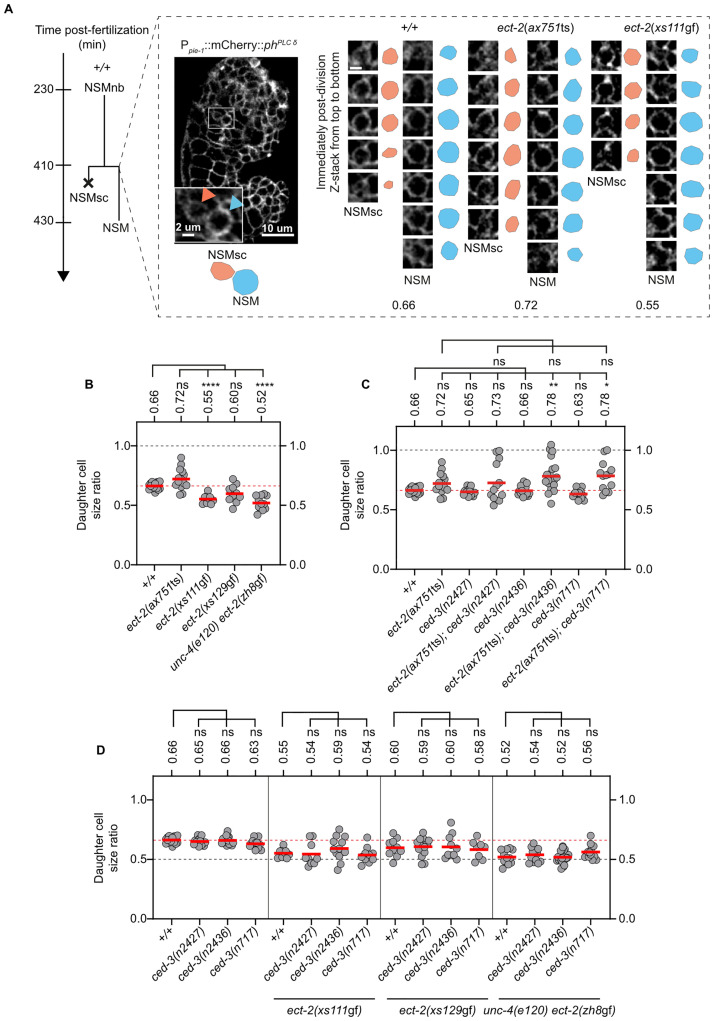
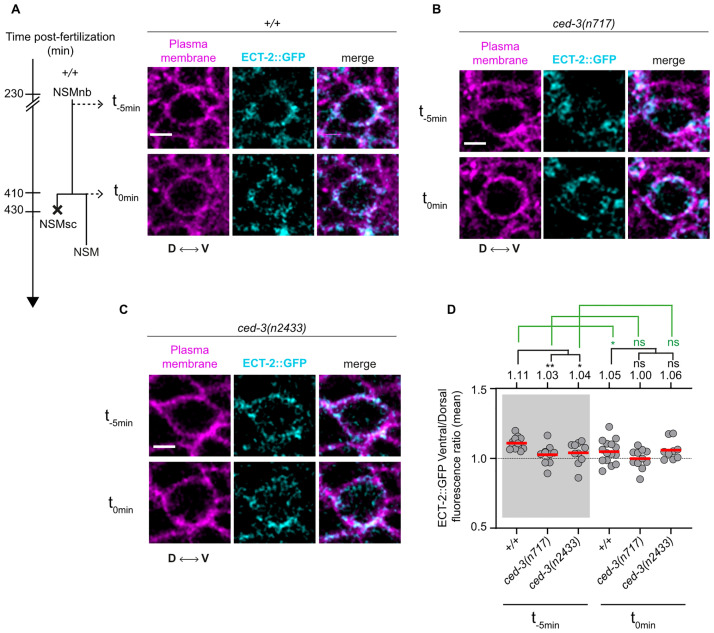
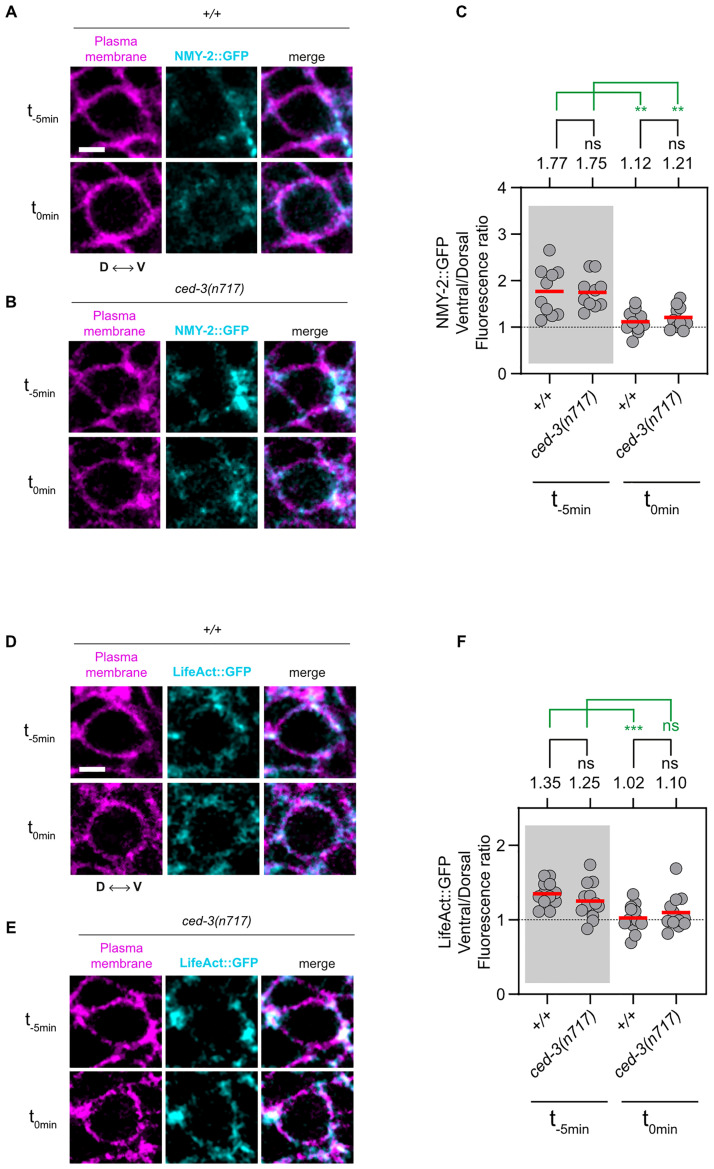
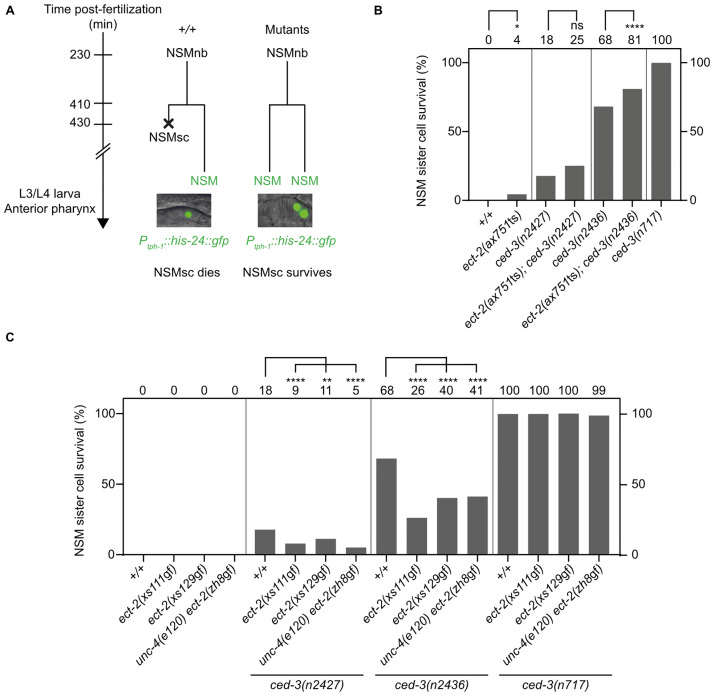
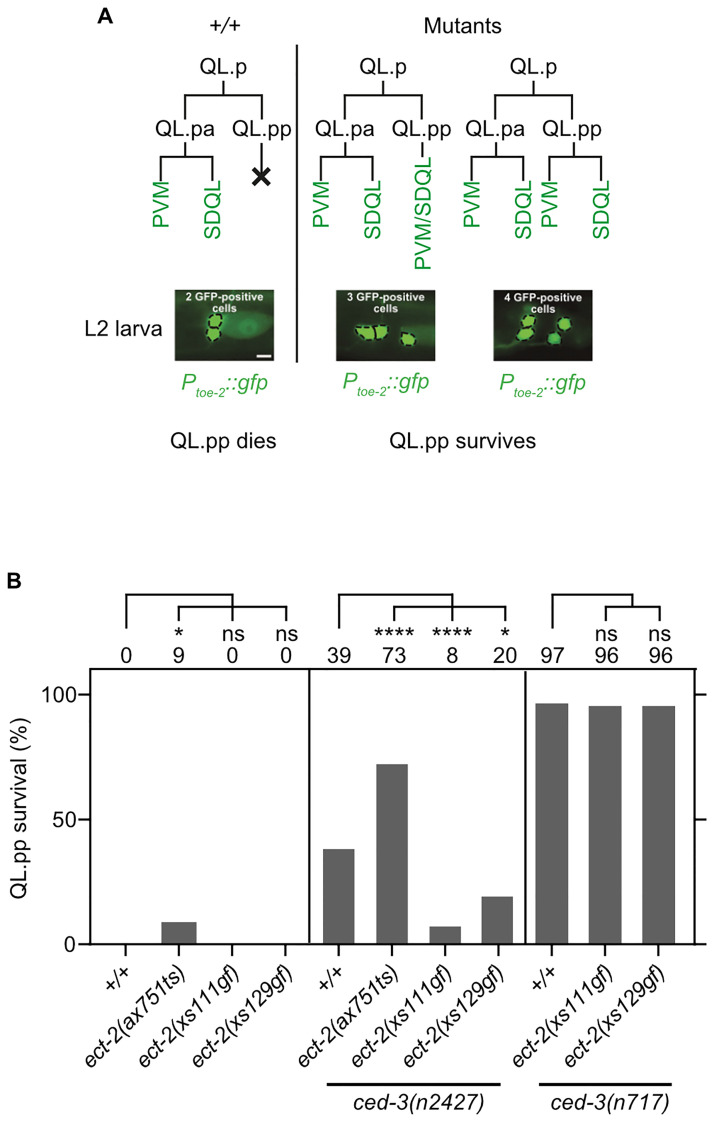
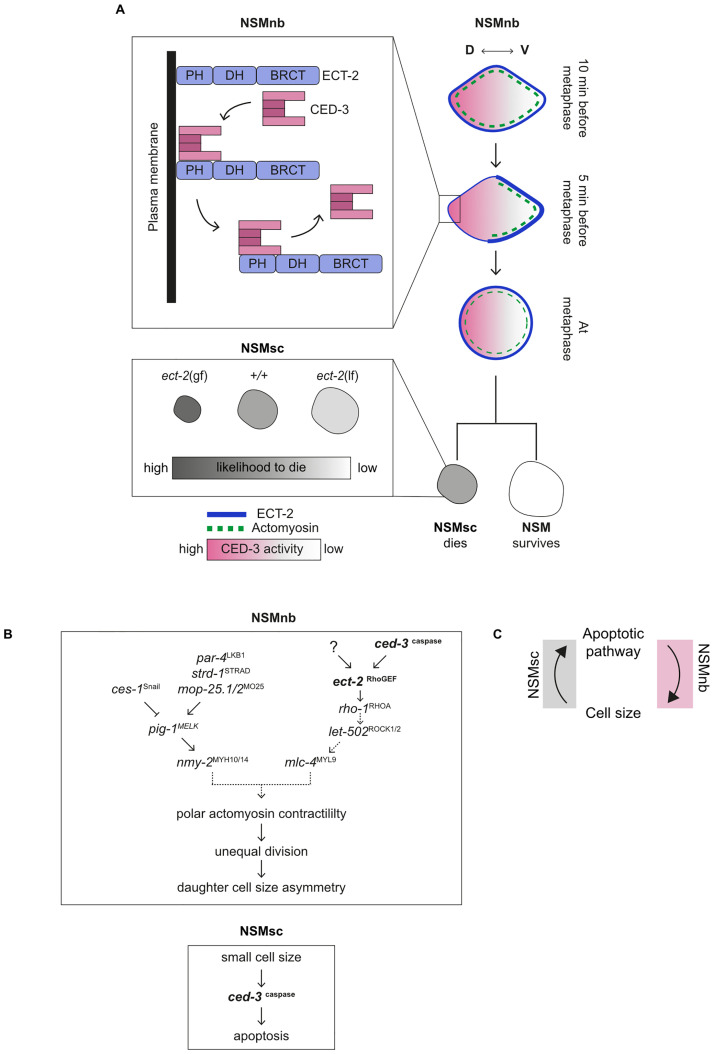
A cell's size affects the likelihood that it will die. But how is cell size controlled in this context and how does cell size impact commitment to the cell death fate? We present evidence that the caspase CED-3 interacts with the RhoGEF ECT-2 in Caenorhabditis elegans neuroblasts that generate "unwanted" cells. We propose that this interaction promotes polar actomyosin contractility, which leads to unequal neuroblast division and the generation of a daughter cell that is below the critical "lethal" size threshold. Furthermore, we find that hyperactivation of ECT-2 RhoGEF reduces the sizes of unwanted cells. Importantly, this suppresses the "cell death abnormal" phenotype caused by the partial loss of ced-3 caspase and therefore increases the likelihood that unwanted cells die. A putative null mutation of ced-3 caspase, however, is not suppressed, which indicates that cell size affects CED-3 caspase activation and/or activity. Therefore, we have uncovered novel sequential and reciprocal interactions between the apoptosis pathway and cell size that impact a cell's commitment to the cell death fate.


Conflict of interest statement

The authors have declared that no competing interests exist.

Figures

Fig 1
Fig 1. CED-3caspase physically interacts with ECT-2RhoGEF in vitro.
(A) Schematic representation of the yeast 2-hybrid screen performed by Next Interactions (https://nextinteractions.com/) to identify physical interactors of proCED-3(C358S). (B) Schematic representation of the various constructs used in the GST pull-down assay along with their expected molecular weight in kilodalton (kDa) on the left. (C and D) Autoradiographs and Coomassie-stained gels of representative GST pull-down experiments. Black asterisks indicate potential breakdown products resulting from growing recombinant proteins in bacterial cultures. The different lanes shown in the figure are from the same gel. (E) Autoradiographs of representative in vitro cleavage experiments with CED-9, ECT-2, and ECT-2’s PH domain. Red asterisks indicate CED-9 cleavage products. Black asterisks indicate potential ECT-2 cleavage products resulting from incubation with bacterial lysate.
Fig 2
Fig 2. ced-3 caspase cooperates with ect-2 RhoGEF in the control of daughter cell sizes in the NSM lineage.
(A) Schematic representation of the NSM lineage. The NSMsc and NSM can be identified in comma stage embryos using the transgene Ppie-1::mCherry::PHPLCΔ (ltIs44), which labels the plasma membrane of cells (orange arrow indicates the NSMsc and blue arrow indicates the NSM). Using confocal imaging, a Z-stack of the NSMsc and NSM can be obtained immediately post-division and the size ratio of the NSMsc:NSM can be estimated. The Z-stack of a pair of NSMsc (orange) and NSM (blue) in +/+, ect-2(ax751ts) and ect-2(xs111gf) mutants is shown. The corresponding mean daughter cell size ratios (NSMsc:NSM) are given below. Scale bars: 10 μm and 2 μm. (B–D) Daughter cell size ratios in +/+ and various ect-2 and ced-3 single and double mutants measured using ltIs44 (n = 10–20). Each gray dot represents the daughter cell size ratio of 1 pair of daughter cells. Horizontal red lines represent mean values, which are also indicated on top. The horizontal red dotted line represents the mean daughter cell size ratio of wild-type (+/+) embryos for comparison. The horizontal black dotted line in Fig 2B and 2C represents a daughter cell size ratio of 1.0 indicating equal division. The horizontal black dotted line in Fig 2D represents a daughter cell size ratio of 0.5 indicating that the smaller daughter is twice as small as the larger daughter. Statistical significance was determined using the Dunnett’s T3 multiple comparisons test (**** = P < 0.0001, ** = P < 0.01, * = P < 0.05, ns = P > 0.05). NSM, neurosecretory motor neuron.
Fig 3
Fig 3. ced-3 caspase is required for the asymmetric enrichment of ECT-2 RhoGEF in the NSM neuroblast.
(A) Schematic representation of the NSM lineage indicating the 2 time points (t-5min = 5 minutes before metaphase, t0min = metaphase) of the NSM neuroblast used for imaging and central Z-slices of representative wild-type (+/+) NSM neuroblasts expressing the transgene ltIs44 (Ppie-1::mCherry::PHPLCΔ) (magenta) and CRISPR allele zhIs135 (ect-2::zf-1::gfp) (cyan). D indicates the dorsal side and V the ventral side of the NSMnb. Scale bar: 2 μm. (B and C) Representative images of central Z-slices of representative ced-3(n717) and ced-3(n2433) NSM neuroblasts expressing the transgene ltIs44 (Ppie-1::mCherry::PHPLCΔ) (magenta) and CRISPR allele zhIs135 (ect-2::zf-1::gfp) (cyan) at 2 time points (t-5min = 5 minutes before metaphase, t0min = metaphase). Scale bar: 2 μm. (D) Ventral/dorsal ratios of mean GFP fluorescence intensities in the NSM neuroblast in animals of indicated genotypes carrying the CRISPR allele zhIs135 (ect-2::zf-1::gfp). Each gray dot represents the ventral/dorsal fluorescence intensity ratio of 1 NSM neuroblast (n = 10–15). The mean values are indicated by the horizontal red lines and are also given on top. The horizontal black dotted line represents a fluorescence intensity ratio of 1, which indicates no asymmetry in fluorescence intensity between the ventral and dorsal side of the NSM neuroblast. Statistical significance is indicated on top. The black lines represent statistical significance comparing the wild-type to ced-3(n717) and ced-3(n2433). The green dotted lines represent statistical significance comparing the 2 time points (t-5min = 5 minutes before metaphase, t0min = metaphase) of the same genotype. Statistical significance was determined using the Welch’s 2 sample t test (** = P < 0.01, * = P < 0.05, ns = P > 0.05). NSM, neurosecretory motor neuron.
Fig 4
Fig 4. Asymmetric enrichment of NMY-2 and F-actin in the NSM neuroblast is not dependent on ced-3 caspase.
(A and B) Representative images of central Z-slices of representative wild-type (+/+) and ced-3(n717) NSM neuroblasts expressing the transgene ltIs44 (Ppie-1::mCherry::PHPLCΔ) (magenta) and CRISPR allele cp13 (nmy-2::gfp + LoxP) (cyan) at 2 time points (t-5min = 5 minutes before metaphase, t0min = metaphase). D is the dorsal side and V is the ventral side. Scale bar: 2 μm. (C and F) Ventral/dorsal ratios of mean GFP fluorescence intensities in the NSM neuroblast in animals of indicated genotypes carrying the CRISPR allele cp13 (nmy-2::gfp + LoxP) (C) or the transgene ddIs86 (Ppie-1::LifeAct::gfp) (F). Each gray dot represents the ventral/dorsal fluorescence intensity ratio of 1 NSM neuroblast (n = 10–15). The mean values are indicated by the horizontal red lines and are also given on top. The horizontal black dotted line represents a fluorescence intensity ratio of 1, which indicates no asymmetry in fluorescence intensity between the ventral and dorsal side of the NSM neuroblast. Statistical significance is indicated on top. The black lines represent statistical significance comparing the wild-type to ced-3(n717) and ced-3(n2433). The green lines represent statistical significance comparing the 2 time points (t-5min = 5 minutes before metaphase, t0min = metaphase) of the same genotype. Statistical significance was determined using the Welch’s 2 sample t test (*** = P < 0.001, ** = P < 0.01, ns = P > 0.05). (D and E) Representative images of central Z-slices of representative wild-type (+/+) and ced-3(n717) NSM neuroblasts expressing the transgenes ltIs44 (Ppie-1::mCherry::PHPLCΔ) (magenta) and ddIs86 (Ppie-1::LifeAct::gfp) (cyan) at 2 time points (t-5min = 5 minutes before metaphase, t0min = metaphase). D is the dorsal side and V is the ventral side. Scale bar: 2 μm. NSM, neurosecretory motor neuron.
Fig 5
Fig 5. ect-2 RhoGEF promotes apoptosis in the NSM lineage.
(A) Schematic of NSM lineage and NSMsc survival assay. The differentiated NSM neuron can be identified in the anterior pharynx of L3/L4 larvae using the transgene bcIs66 (Ptph-1::his-24::gfp). In wild-type (+/+), the NSMsc always dies, resulting in 1 NSM for each NSM neuroblast. In various mutants, the NSMsc survives, resulting in 2 “NSM”-like cells for each NSM neuroblast. (B, C) NSMsc survival (%) in various genotypes (n = 100–200). The NSMsc survival (%) is indicated on top of each bar graph. Statistical significance was determined using Fisher’s exact test (**** = P < 0.0001, ** = P < 0.01, * = P < 0.05, ns = P > 0.05). NSM, neurosecretory motor neuron.
Fig 6
Fig 6. ect-2 RhoGEF promotes apoptosis in the QL.p lineage.
(A) Schematic of QL.pp survival assay. In wild-type (+/+), QL.pp dies and its sister cell QL.pa divides to form the neurons PVM and SDQL, which can be visualized in L2 larvae using the transgene bcIs133 (Ptoe-2::gfp). In various mutants, QL.pp survives and either differentiates into a PVM/SDQL-like neuron or divides to form 2 PVM/SDQL-like neurons. (B) QL.pp survival (%) in various genotypes (n = 50–100). The QL.pp survival (%) is indicated on top of each bar graph. Statistical significance was determined using Fisher’s exact test. (**** = P < 0.0001, * = P < 0.05, ns = P > 0.05).
Fig 7
Fig 7. Working model.
(A) Schematic representation of molecular and cellular events leading to unequal division of the NSMnb (top) and the subsequent death of the NSMsc (bottom). See text for further details. (B) Genetic pathways involved in sequential and reciprocal interactions between the apoptosis pathway and cell size in the NSM neuroblast (NSMnb) (top) and the NSM sister cell (NSMsc) (bottom). See text for further details. (C) Schematic indicating reciprocal interactions exist between the apoptotic pathway and cell size. See text for further details. NSM, neurosecretory motor neuron.

Similar articles

Cited by

References

    1. Conradt B, Wu YC, Xue D. Programmed Cell Death During Caenorhabditis elegans Development. Genetics. 2016;203(4):1533–1562. doi: 10.1534/genetics.115.186247 - DOI - PMC - PubMed
    1. Fuchs Y, Steller H. Programmed cell death in animal development and disease. Cell. 2011;147(4):742–758. doi: 10.1016/j.cell.2011.10.033 - DOI - PMC - PubMed
    1. Kerr JFR, Wyllie AH, Currie AR. Apoptosis: a basic biological phenomenon with wide-ranging implications in tissue kinetics. Br J Cancer. 1972;26:239–257. doi: 10.1038/bjc.1972.33 - DOI - PMC - PubMed
    1. Lang F, Hoffmann EK. Role of ion transport in control of apoptotic cell death. Compr Physiol. 2012;2(3):2037–2061. doi: 10.1002/cphy.c110046 - DOI - PubMed
    1. Driscoll K, Stanfield GM, Droste R, Horvitz HR. Presumptive TRP channel CED-11 promotes cell volume decrease and facilitates degradation of apoptotic cells in Caenorhabditis elegans. Proc Natl Acad Sci U S A. 2017;114(33):8806–8811. doi: 10.1073/pnas.1705084114 - DOI - PMC - PubMed

Publication types

MeSH terms