Genome-wide association studies and genomic selection assays made in a large sample of cacao (Theobroma cacao L.) germplasm reveal significant marker-trait associations and good predictive value for improving yield potential
- PMID: 36201531
- PMCID: PMC9536643
- DOI: 10.1371/journal.pone.0260907
Genome-wide association studies and genomic selection assays made in a large sample of cacao (Theobroma cacao L.) germplasm reveal significant marker-trait associations and good predictive value for improving yield potential
Abstract
A genome-wide association study (GWAS) was undertaken to unravel marker-trait associations (MTAs) between SNP markers and phenotypic traits. It involved a subset of 421 cacao accessions from the large and diverse collection conserved ex situ at the International Cocoa Genebank Trinidad. A Mixed Linear Model (MLM) in TASSEL was used for the GWAS and followed by confirmatory analyses using GAPIT FarmCPU. An average linkage disequilibrium (r2) of 0.10 at 5.2 Mb was found across several chromosomes. Seventeen significant (P ≤ 8.17 × 10⁻⁵ (-log10 (p) = 4.088)) MTAs of interest, including six that pertained to yield-related traits, were identified using TASSEL MLM. The latter accounted for 5 to 17% of the phenotypic variation expressed. The highly significant association (P ≤ 8.17 × 10⁻⁵) between seed length to width ratio and TcSNP 733 on chromosome 5 was verified with FarmCPU (P ≤ 1.12 × 10⁻⁸). Fourteen MTAs were common to both the TASSEL and FarmCPU models at P ≤ 0.003. The most significant yield-related MTAs involved seed number and seed length on chromosome 7 (P ≤ 1.15 × 10⁻¹⁴ and P ≤ 6.75 × 10-05, respectively) and seed number on chromosome 1 (P ≤ 2.38 × 10-05), based on the TASSEL MLM. It was noteworthy that seed length, seed length to width ratio and seed number were associated with markers at different loci, indicating their polygenic nature. Approximately 40 candidate genes that encode embryo and seed development, protein synthesis, carbohydrate transport and lipid biosynthesis and transport were identified in the flanking regions of the significantly associated SNPs and in linkage disequilibrium with them. A significant association of fruit surface anthocyanin intensity co-localised with MYB-related protein 308 on chromosome 4. Testing of a genomic selection approach revealed good predictive value (genomic estimated breeding values (GEBV)) for economic traits such as seed number (GEBV = 0.611), seed length (0.6199), seed width (0.5435), seed length to width ratio (0.5503), seed/cotyledon mass (0.6014) and ovule number (0.6325). The findings of this study could facilitate genomic selection and marker-assisted breeding of cacao thereby expediting improvement in the yield potential of cacao planting material.
Conflict of interest statement
The authors declare that they have no competing interests.
Figures


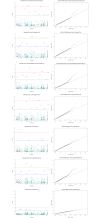
Based on TASSEL version 5.2.50 MLM results for 421 cacao accessions (612 SNPs).
Chromosome “11” was designated for unmapped SNP markers (some of which have recently been mapped).
X- and Y-axes represent the SNP markers along each chromosome and the -log10(P-value), respectively.
The red horizontal line corresponds to the Bonferonni significance threshold of P-values ≤ 8.17 × 10⁻⁵ (–log10 (P) = 4.088) and the blue line corresponds to a significance level of 0.005.

Similar articles
-
Integrated phenotypic analysis, predictive modeling, and identification of novel trait-associated loci in a diverse Theobroma cacao collection.BMC Plant Biol. 2025 Aug 9;25(1):1050. doi: 10.1186/s12870-025-07128-y. BMC Plant Biol. 2025. PMID: 40781653 Free PMC article.
-
Association mapping of seed and disease resistance traits in Theobroma cacao L.Planta. 2016 Dec;244(6):1265-1276. doi: 10.1007/s00425-016-2582-7. Epub 2016 Aug 17. Planta. 2016. PMID: 27534964
-
Genome-wide association study identifies key quantitative trait loci (QTL) for fruit morphometric traits in avocado (Persea spp.).BMC Genomics. 2024 Nov 25;25(1):1135. doi: 10.1186/s12864-024-11043-1. BMC Genomics. 2024. PMID: 39587474 Free PMC article.
-
Genome-wide association study as a powerful tool for dissecting competitive traits in legumes.Front Plant Sci. 2023 Aug 14;14:1123631. doi: 10.3389/fpls.2023.1123631. eCollection 2023. Front Plant Sci. 2023. PMID: 37645459 Free PMC article. Review.
-
Theobroma cacao L. cultivar CCN 51: a comprehensive review on origin, genetics, sensory properties, production dynamics, and physiological aspects.PeerJ. 2022 Jan 5;10:e12676. doi: 10.7717/peerj.12676. eCollection 2022. PeerJ. 2022. PMID: 35036091 Free PMC article. Review.
Cited by
-
Forastero cacao bean extract gel decreases IL-6 positive osteoblasts, osteoclasts, and osteocytes on OIRR model: A primitive study.J Taibah Univ Med Sci. 2025 Mar 2;20(2):129-138. doi: 10.1016/j.jtumed.2025.02.005. eCollection 2025 Apr. J Taibah Univ Med Sci. 2025. PMID: 40125534 Free PMC article.
-
Integrated phenotypic analysis, predictive modeling, and identification of novel trait-associated loci in a diverse Theobroma cacao collection.BMC Plant Biol. 2025 Aug 9;25(1):1050. doi: 10.1186/s12870-025-07128-y. BMC Plant Biol. 2025. PMID: 40781653 Free PMC article.
-
Bioactive Compounds, Antioxidant, and Antimicrobial Activity of Seeds and Mucilage of Non-Traditional Cocoas.Antioxidants (Basel). 2025 Feb 28;14(3):299. doi: 10.3390/antiox14030299. Antioxidants (Basel). 2025. PMID: 40227260 Free PMC article.
-
Genome-wide association study for yield-related traits in faba bean (Vicia faba L.).Front Plant Sci. 2024 Mar 13;15:1328690. doi: 10.3389/fpls.2024.1328690. eCollection 2024. Front Plant Sci. 2024. PMID: 38545396 Free PMC article.
References
-
- Expert market research. Expert Market Research Report. 2020. https://www.expertmarketresearch.com/reports/chocolate-market. Accessed August 6, 2020.
-
- Cheesman EE. Notes on the nomenclature, classification and possible relationships of cacao populations. Tropical Agriculture. 1944;21(8).
-
- Eskes A, Lanaud C. Cocoa. In: Charrier A, Jacquot M, Hamon S, Nicolas D, editors. Tropical Plant Breeding. Montpellier: CIRAD; 2001. p. 78–105.
Publication types
MeSH terms
Substances
LinkOut - more resources
Full Text Sources
Miscellaneous

