. 2022 Oct 6;18(10):e1010604.
doi: 10.1371/journal.pcbi.1010604. eCollection 2022 Oct.

Identifying the genes impacted by cell proliferation in proteomics and transcriptomics studies

Affiliations

Identifying the genes impacted by cell proliferation in proteomics and transcriptomics studies

Marie Locard-Paulet et al. PLoS Comput Biol. .

Abstract

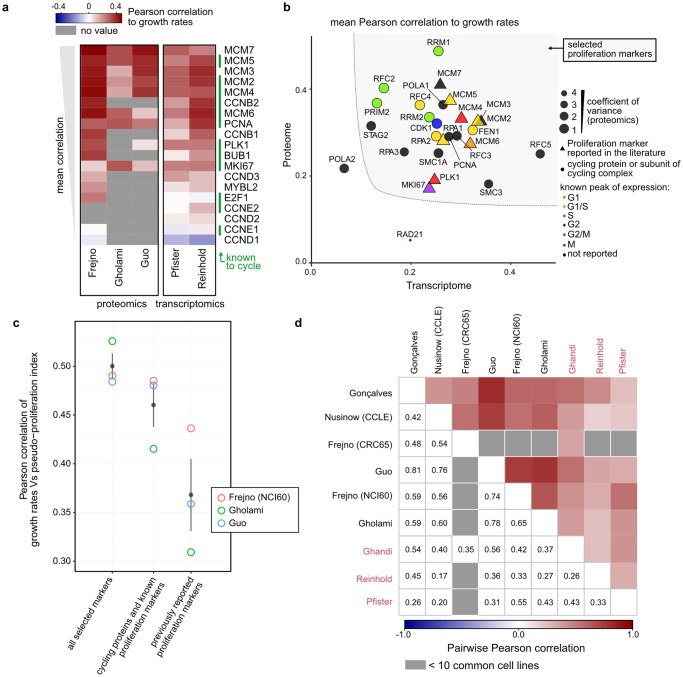
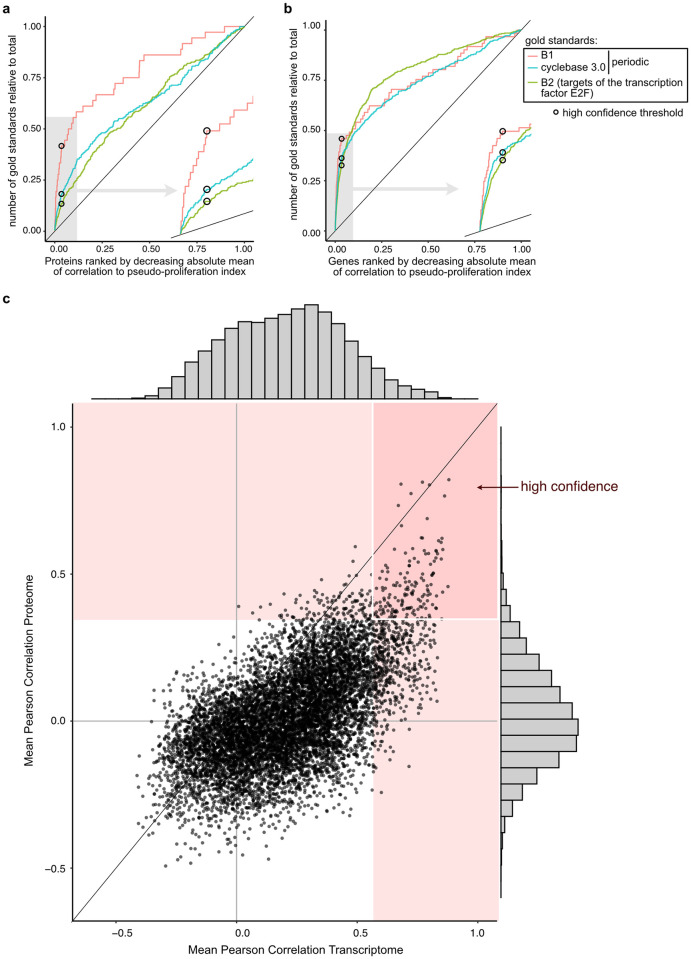
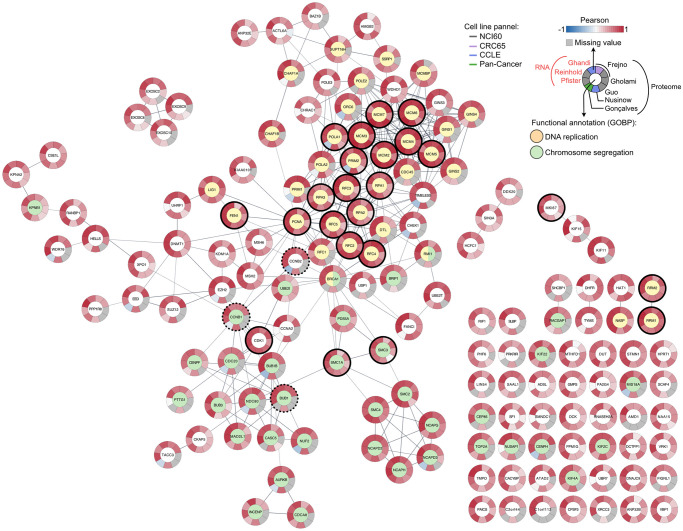
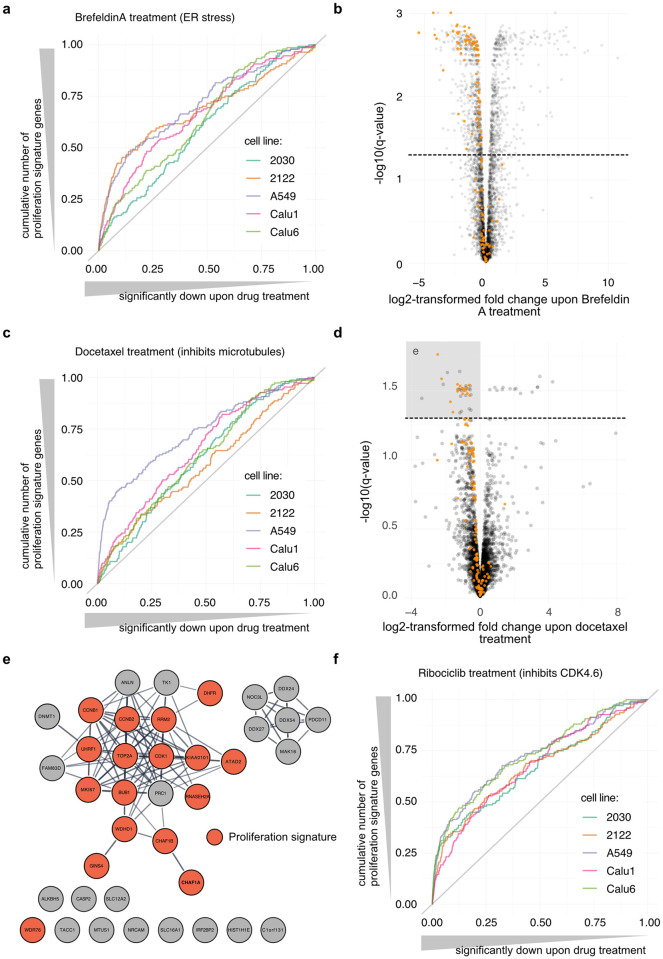
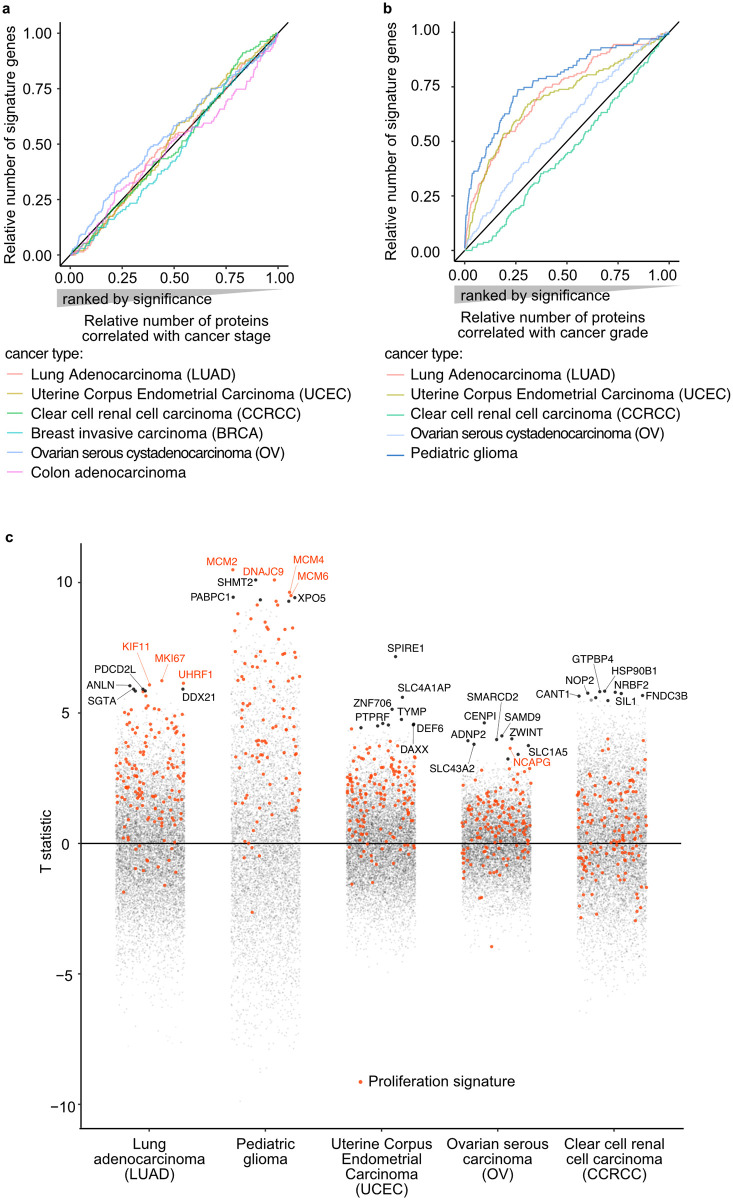
Hypothesis-free high-throughput profiling allows relative quantification of thousands of proteins or transcripts across samples and thereby identification of differentially expressed genes. It is used in many biological contexts to characterize differences between cell lines and tissues, identify drug mode of action or drivers of drug resistance, among others. Changes in gene expression can also be due to confounding factors that were not accounted for in the experimental plan, such as change in cell proliferation. We combined the analysis of 1,076 and 1,040 cell lines in five proteomics and three transcriptomics data sets to identify 157 genes that correlate with cell proliferation rates. These include actors in DNA replication and mitosis, and genes periodically expressed during the cell cycle. This signature of cell proliferation is a valuable resource when analyzing high-throughput data showing changes in proliferation across conditions. We show how to use this resource to help in interpretation of in vitro drug screens and tumor samples. It informs on differences of cell proliferation rates between conditions where such information is not directly available. The signature genes also highlight which hits in a screen may be due to proliferation changes; this can either contribute to biological interpretation or help focus on experiment-specific regulation events otherwise buried in the statistical analysis.


Conflict of interest statement

The authors have declared that no competing interests exist.

Figures

Fig 1
Fig 1. Calculation of pseudo-proliferation index.
a) Pearson correlation with growth rates of the NCI60 cell lines that follow the Developmental Therapeutics Program (DTP)’s growing instructions for proliferation markers referenced in the literature. The proteins that cycle in Cyclebase 3.0 are indicated by green bars on the right (“known to cycle”), and the data set names are indicated in the bottom. b) Set of known markers, cycling genes and complex-associated subunits considered as proliferation marker for pseudo-proliferation index calculation. Mean Pearson correlation with growth rates in the datasets presented in (a) in the proteome (vertical axis) and transcriptome (horizontal axis). The point size is proportional to the inverse of the coefficient of variance in the proteomics data, proteins present in less than 2 data sets were excluded, as well as the cycling CDC27 due to its negative correlation with growth rates in the proteomics data sets. Periodic genes are color-coded by the phase of their expression peak, proliferation markers reported in the literature are indicated by triangles. The selected proliferation markers are indicated by the grey area. c) Pearson correlations between pseudo-proliferation index and growth rates in the proteomics data sets presented in (a) using the mean signal of the proliferation markers as selected in (b) (grey area), all the previously reported proliferation markers, or the previously reported proliferation markers and cycling genes with the exclusion of RAD21. Grey points and bars are mean and confidence intervals across data sets. d) Pairwise Pearson correlation between the pseudo-proliferation indexes calculated in the different data sets (proteomics and transcriptomics in black and red, respectively) Pairwise comparisons with less than 10 cell lines were excluded (in grey).
Fig 2
Fig 2. Signature genes of cell proliferation.
a-b) Definition of the cutoff for correlation with pseudo-proliferation index with three sets of gold standards in the proteomes (a) and the transcriptomes (b). Proteins/genes were ranked by decreasing absolute Pearson correlation to pseudo-proliferation index (horizontal axis) and the vertical axis presents the cumulative number of gold standards for each set. Proteins/genes quantified in less than 3 and 2 data sets were excluded in (a) and (b), respectively. c) Scatter plot of the mean Pearson correlation to pseudo-proliferation index at protein (vertical axis) and transcript (horizontal axis) level across all data sets. The red areas contain the proteins above the threshold in the proteome and/or transcriptome and the rectangle with white borders indicates the final list of proliferation signature genes defined in this study. The point distribution in the proteomes and transcriptomes are presented on the sides of the plot.
Fig 3
Fig 3. Proliferation signature.
STRING subnetwork of physical interactions (score ≥ 0.7) corresponding to the proliferation signature as selected in Fig 2. The genes used to calculate the pseudo-proliferation index and the known proliferation markers not included for pseudo-proliferation index calculation are highlighted by black solid and dashed borders, respectively. The nodes are color-coded by selected gene annotations of biological processes. External ring are the Pearson correlations for each data set independently.
Fig 4
Fig 4. Proliferation signature in the context of drug treatment.
a) Enrichment of the proliferation signature in the proteomes of cells treated with Brefeldin A. Proteins were ranked by significance of down-regulation according to Ruprecht et al. [7] (q-value) (horizontal axis) and the vertical axis presents the cumulative number of signature genes for each cell line. “2030” and “2122” correspond to the NCIH-2030 and NCIH-2122 cell lines, respectively. b) Volcano plot for A549 cells treated with Brefeldin A. Proliferation signature genes are highlighted in orange. The dashed line corresponds to a q-value of 0.05. c) Enrichment of the proliferation signature in the proteomes of cells treated with Docetaxel as in (a). d) Volcano plot for A549 cells treated with Docetaxel as presented in (b). e) Significantly down-regulated proteins (grey square in (d)) are presented in a STRING network of functional associations (score ≥ 0.7). Proliferation signature genes are highlighted in orange. f) Enrichment of the proliferation signature in the proteomes of cells treated with Ribociclib as in (a).
Fig 5
Fig 5. Proliferation signature in the context of cancer grade.
a-b) Enrichment of the proliferation signature in proteins associated with cancer stage (a) and grade (b). Proteins were ranked by significance of correlation according to Monsivais et al. [6] (p-value of Pearson correlation) (horizontal axis) and the vertical axis presents the cumulative number of signature genes for each cancer type. d) Proteins T-statistic provided by Monsivais et al. [6] for the analysis of cancer grades (positive = high correlation with cancer grade) for each cancer type (horizontal axis). Each point corresponds to a protein, signature genes are highlighted in orange. The seven top hits for each cancer type are indicated by their gene names.

Similar articles

Cited by

References

    1. Polymenis M. Proteins associated with the doubling time of the NCI-60 cancer cell lines. Cell Division. 2017;12(1). doi: 10.1186/s13008-017-0032-y - DOI - PMC - PubMed
    1. Chao HX, Fakhreddin RI, Shimerov HK, Kedziora KM, Kumar RJ, Perez J, et al.. Evidence that the human cell cycle is a series of uncoupled, memoryless phases. Molecular Systems Biology. 2019;15(3). doi: 10.15252/msb.20188604 - DOI - PMC - PubMed
    1. Whitfield ML, George LK, Grant GD, Perou CM. Common markers of proliferation. Nature Reviews Cancer. 2006;6(2):99–106. doi: 10.1038/nrc1802 - DOI - PubMed
    1. Perou CM, Jeffrey SS, Van De Rijn M, Rees CA, Eisen MB, Ross DT, et al.. Distinctive gene expression patterns in human mammary epithelial cells and breast cancers. Proceedings of the National Academy of Sciences. 1999;96(16):9212–7. doi: 10.1073/pnas.96.16.9212 - DOI - PMC - PubMed
    1. Ross DT, Scherf U, Eisen MB, Perou CM, Rees C, Spellman P, et al.. Systematic variation in gene expression patterns in human cancer cell lines. Nature Genetics. 2000;24(3):227–35. doi: 10.1038/73432 - DOI - PubMed

Publication types