. 2022 Oct 11;119(41):e2113896119.
doi: 10.1073/pnas.2113896119. Epub 2022 Oct 6.

Comparing the development of cortex-wide gene expression patterns between two species in a common reference frame

Affiliations

Comparing the development of cortex-wide gene expression patterns between two species in a common reference frame

Sebastian S James et al. Proc Natl Acad Sci U S A. .

Abstract

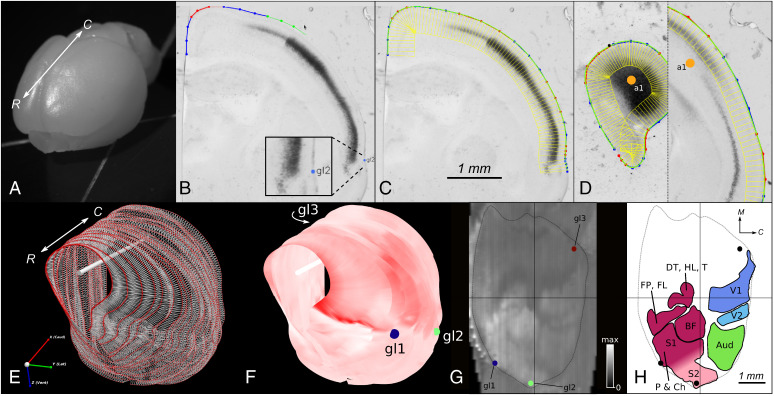
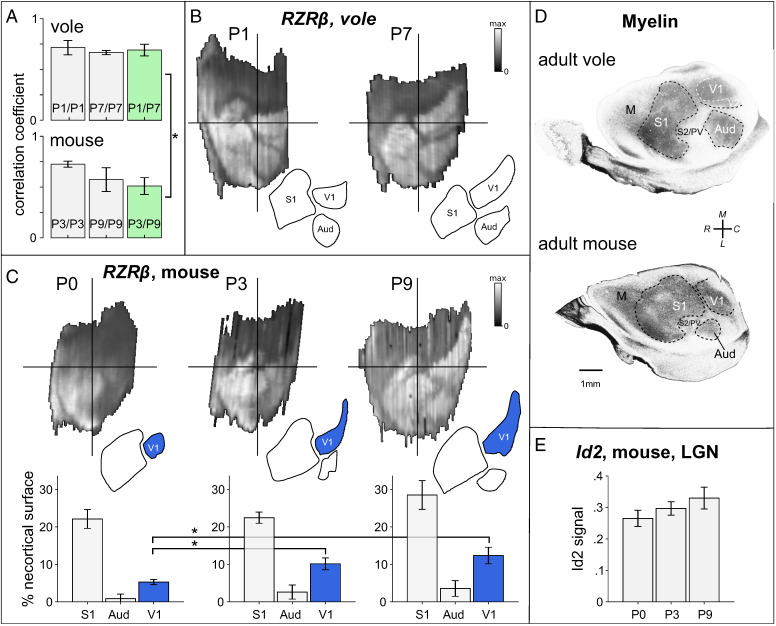
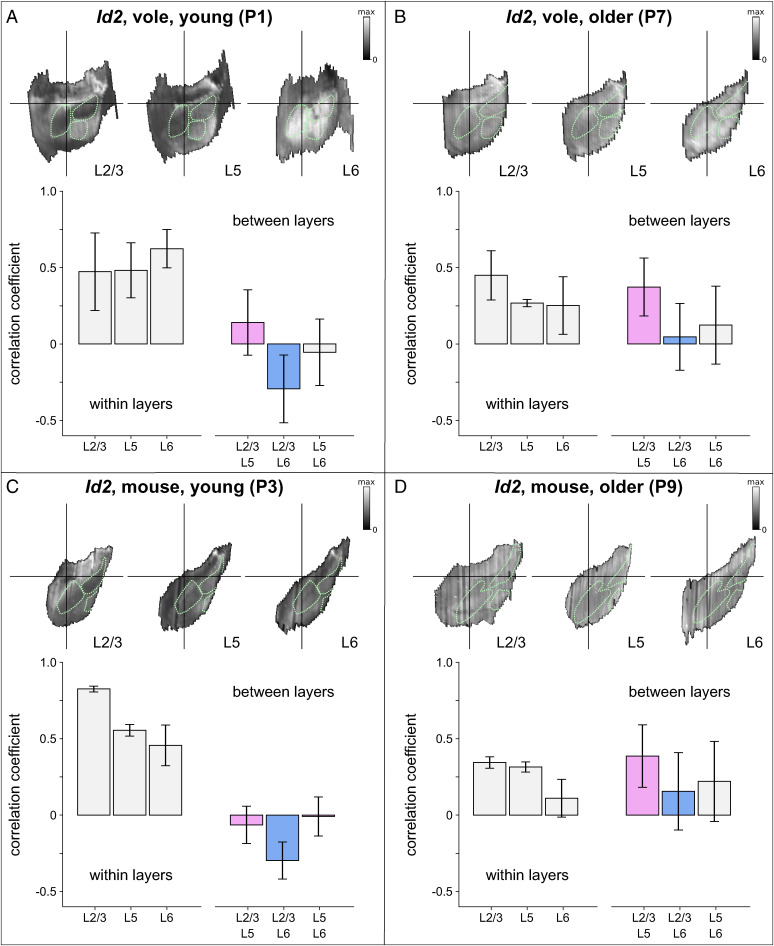
Advances in sequencing techniques have made comparative studies of gene expression a current focus for understanding evolutionary and developmental processes. However, insights into the spatial expression of genes have been limited by a lack of robust methodology. To overcome this obstacle, we developed methods and software tools for quantifying and comparing tissue-wide spatial patterns of gene expression within and between species. Here, we compare cortex-wide expression of RZRβ and Id2 mRNA across early postnatal development in mice and voles. We show that patterns of RZRβ expression in neocortical layer 4 are highly conserved between species but develop rapidly in voles and much more gradually in mice, who show a marked expansion in the relative size of the putative primary visual area across the first postnatal week. Patterns of Id2 expression, by contrast, emerge in a dynamic and layer-specific sequence that is consistent between the two species. We suggest that these differences in the development of neocortical patterning reflect the independent evolution of brains, bodies, and sensory systems in the 35 million years since their last common ancestor.

Keywords: brain development; brain evolution; cortical arealization; evo-devo; neocortex.


Conflict of interest statement

The authors declare no competing interest.

Figures

Fig. 1.
Fig. 1.
Stalefish workflow. (A) Rostral view of an unfixed vole brain. The rostral-caudal axis is shown (white arrow). (BD) Screenshots from Stalefish of coronal sections of RZRβ-hybridized vole tissue showing the curve drawing method. Dark regions indicate a high expression of RZRβ mRNA. (B) Marked locations around the perimeter of the brain. The perimeter points are collected into small sets of 4 or 5 points at a time. The green points are the newest set of perimeter locations and will become the next ‘red’ set (the red and blue colors are simply a guide for the user). The number of points in each section determines the order of the Bezier curve which will be fitted to that section. The blue dot labelled ‘gl2’ shows a global landmark placement for transformations. (C) Once the perimeter points have been laid out, a piecewise fit is found for the points by modifying the individual Bezier curves to ensure that the curve gradient is continuous at the joints. The green line shows the final fit. Evenly spaced normal vectors extended down from the fit line give sampling boxes in yellow. (D) An axis mark (orange dot) on the first and last slice define a brain axis for digital alignment. (E) Stalefish output using sfview. Curve points are shown as red spheres. By connecting the spheres to make a mesh, a surface is generated. The white bar shows the user-defined brain axis. The rostral-caudal axis is shown (white arrow). (F) The mean luminance of the sampling boxes can then be displayed on the smoothed surface to give a 3D reconstruction of the gene expression. Here, we used a monochrome colormap for which full-saturation red corresponds to the maximum RZRβ expression signal. (G) Digitally flattened and reference-frame transformed 3D surface map (from BF) using sfview. (H) Freehand loops drawn around the identifiable regions of expression in (G). Areas (mm2) are: V1 1.78; V2 0.49; Aud 1.74; FP/FL 0.71; DT/HL 0.58; BF 1.16; P/C S1 and S2: 3.07. Neocortical area (dotted line): 23.9. Abbreviations: rostral (R), caudal (C), medial (M), barrel field (BF), dorsal trunk (DT), hind leg (HL), tail (T), forepaw (FP), forelimb (FL), perioral (P), chin (Ch).
Fig. 2.
Fig. 2.
Highly correlated patterns of RZRβ expression between species develop at different rates. (A) Bar graphs showing the correlation between (and among) digitally reconstructed RZRβ expression maps obtained from layer 4 of young (P1) and older (P7) voles (Top), and of young (P3) and older (P9) mice age-matched by postconception day. Maps are strongly correlated between species and over time, but are significantly less correlated over time in mice (green bars). (B) Example layer 4 RZRβ expression maps digitally reconstructed from a P1 and a P7 vole. At both ages, RZRβ expression levels are high in spatially distinct regions whose shapes and locations correspond to those of adult neocortical fields (including the S1, V1, Aud, V2, S2, and PV). (C) Example layer 4 RZRβ expression maps obtained from a P0, P3, and a P9 mouse. The patterns of expression come into focus across developmental time, with an area of high expression at the location corresponding to putative V1 clearly increasing in expression strength and growing in size over time. Below each example is a bar graph showing the area of the region of high expression corresponding to the primary sensory fields. Compared to P0, the putative V1 (blue bars) was significantly larger at P3 and at P9, relative to the size of the neocortex. (D) Flattened cortical sections stained for myelin in an adult vole (Top) and mouse (Bottom) showing cortical field boundaries. (E) A nonsignificant trend in the levels of expression of Id2 in digitally reconstructed LGN was for a small increase in the mean expression level over time.
Fig. 3.
Fig. 3.
Layer-specific development of expression patterns of Id2 in mice and voles. Digitally reconstructed patterns of Id2 expression were obtained from (A) P1 voles, (B) P7 voles, (C) P3 mice, and (D) P9 mice, at depths that corresponded to layer 2/3, layer 5, and layer 6. In each panel the Top Row shows an example of an Id2 expression map for each cortical layer, and the bar graphs show correlations between all maps measured from within a given layer (Left) and for each pair of maps measured from two different layers (Right). Bars colored pink (showing correlations between layer 5 maps and layer 2/3 maps) and blue (showing correlations between layer 6 and layer 2/3 maps) represent data that were submitted for the main analysis. This analysis revealed distinct layer-specific changes in map development that was highly consistent between the two species. Layer 5 and layer 2/3 map patterns are uncorrelated in early postnatal development and become correlated over time, whereas layer 6 and layer 2/3 map patterns are anti-correlated in early postnatal development and become uncorrelated over time. Green dotted lines show outlines of the presumptive S1, V1, Aud, obtained by digitally tracing regions of high RZRβ expression from one example brain in each of the four age/species combinations.

Similar articles

Cited by

References

    1. Bayraktar O. A., et al. , Astrocyte layers in the mammalian cerebral cortex revealed by a single-cell in situ transcriptomic map. Nat. Neurosci. 23, 500–509 (2020). - PMC - PubMed
    1. Hirokawa J., Watakabe A., Ohsawa S., Yamamori T., Analysis of area-specific expression patterns of RORbeta, ER81 and Nurr1 mRNAs in rat neocortex by double in situ hybridization and cortical box method. PLoS One 3, e3266 (2008). - PMC - PubMed
    1. Zhu Q., Shah S., Dries R., Cai L., Yuan G.-C., Identification of spatially associated subpopulations by combining scRNAseq and sequential fluorescence in situ hybridization data. Nat. Biotechnol. 36, 1183–1190 (2018). - PMC - PubMed
    1. Crombach A., Cicin-Sain D., Wotton K. R., Jaeger J., Medium-throughput processing of whole mount in situ hybridisation experiments into gene expression domains. PLoS One 7, e46658 (2012). - PMC - PubMed
    1. Cadwell C. R., Bhaduri A., Mostajo-Radji M. A., Keefe M. G., Nowakowski T. J., Development and arealization of the cerebral cortex. Neuron 103, 980–1004 (2019). - PMC - PubMed

Publication types