Transcriptional changes in Plasmodium falciparum upon conditional knock down of mitochondrial ribosomal proteins RSM22 and L23
- PMID: 36201550
- PMCID: PMC9536634
- DOI: 10.1371/journal.pone.0274993
Transcriptional changes in Plasmodium falciparum upon conditional knock down of mitochondrial ribosomal proteins RSM22 and L23
Abstract
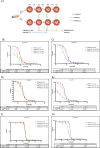
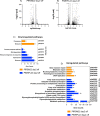
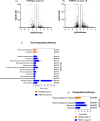
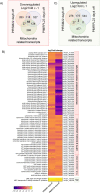
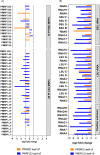
The mitochondrion of malaria parasites is an attractive antimalarial drug target, which require mitoribosomes to translate genes encoded in the mitochondrial (mt) DNA. Plasmodium mitoribosomes are composed of highly fragmented ribosomal RNA (rRNA) encoded in the mtDNA. All mitoribosomal proteins (MRPs) and other assembly factors are encoded in the nuclear genome. Here, we have studied one putative assembly factor, RSM22 (Pf3D7_1027200) and one large subunit (LSU) MRP, L23 (Pf3D7_1239100) in Plasmodium falciparum. We show that both proteins localize to the mitochondrion. Conditional knock down (KD) of PfRSM22 or PfMRPL23 leads to reduced cytochrome bc1 complex activity and increased sensitivity to bc1 inhibitors such as atovaquone and ELQ-300. Using RNA sequencing as a tool, we reveal the transcriptomic changes of nuclear and mitochondrial genomes upon KD of these two proteins. In the early phase of KD, while most mt rRNAs and transcripts of putative MRPs were downregulated in the absence of PfRSM22, many mt rRNAs and several MRPs were upregulated after KD of PfMRPL23. The contrast effects in the early phase of KD likely suggests non-redundant roles of PfRSM22 and PfMRPL23 in the assembly of P. falciparum mitoribosomes. At the late time points of KD, loss of PfRSM22 and PfMRPL23 caused defects in many essential metabolic pathways and transcripts related to essential mitochondrial functions, leading to parasite death. In addition, we enlist mitochondrial proteins of unknown function that are likely novel Plasmodium MRPs based on their structural similarity to known MRPs as well as their expression profiles in KD parasites.
Conflict of interest statement
The authors declare that they have no conflicts of interest with the contents of this article.
Figures



Similar articles
-
Plasmodium falciparum Mitochondrial Complex III, the Target of Atovaquone, Is Essential for Progression to the Transmissible Sexual Stages.Int J Mol Sci. 2024 Aug 26;25(17):9239. doi: 10.3390/ijms25179239. Int J Mol Sci. 2024. PMID: 39273187 Free PMC article.
-
The mitochondrial ribosomal protein L13 is critical for the structural and functional integrity of the mitochondrion in Plasmodium falciparum.J Biol Chem. 2018 May 25;293(21):8128-8137. doi: 10.1074/jbc.RA118.002552. Epub 2018 Apr 6. J Biol Chem. 2018. PMID: 29626096 Free PMC article.
-
Genetic ablation of the mitoribosome in the malaria parasite Plasmodium falciparum sensitizes it to antimalarials that target mitochondrial functions.J Biol Chem. 2020 May 22;295(21):7235-7248. doi: 10.1074/jbc.RA120.012646. Epub 2020 Apr 9. J Biol Chem. 2020. PMID: 32273345 Free PMC article.
-
Exploration of 4(1H)-pyridones as a novel family of potent antimalarial inhibitors of the plasmodial cytochrome bc1.Future Med Chem. 2012 Dec;4(18):2311-23. doi: 10.4155/fmc.12.177. Future Med Chem. 2012. PMID: 23234553 Review.
-
The putative mitochondrial genome of Plasmodium falciparum.J Protozool. 1991 May-Jun;38(3):243-5. doi: 10.1111/j.1550-7408.1991.tb04436.x. J Protozool. 1991. PMID: 1880762 Review.
Cited by
-
Unique Properties of Apicomplexan Mitochondria.Annu Rev Microbiol. 2023 Sep 15;77:541-560. doi: 10.1146/annurev-micro-032421-120540. Epub 2023 Jul 5. Annu Rev Microbiol. 2023. PMID: 37406344 Free PMC article. Review.
-
Covalent inhibition of Plasmodium falciparum Ubc13 impairs global protein synthesis.iScience. 2025 Apr 28;28(6):112545. doi: 10.1016/j.isci.2025.112545. eCollection 2025 Jun 20. iScience. 2025. PMID: 40491475 Free PMC article.
-
Comparative 3D ultrastructure of Plasmodium falciparum gametocytes.Nat Commun. 2025 Jan 2;16(1):69. doi: 10.1038/s41467-024-55413-5. Nat Commun. 2025. PMID: 39747010 Free PMC article.
-
Plasmodium falciparum Mitochondrial Complex III, the Target of Atovaquone, Is Essential for Progression to the Transmissible Sexual Stages.Int J Mol Sci. 2024 Aug 26;25(17):9239. doi: 10.3390/ijms25179239. Int J Mol Sci. 2024. PMID: 39273187 Free PMC article.
-
Apicomplexan mitoribosome from highly fragmented rRNAs to a functional machine.Nat Commun. 2024 Dec 17;15(1):10689. doi: 10.1038/s41467-024-55033-z. Nat Commun. 2024. PMID: 39690155 Free PMC article.
References
MeSH terms
Substances
Grants and funding
LinkOut - more resources
Full Text Sources

