. 2022 Oct 7;378(6615):94-99.
doi: 10.1126/science.abq7860. Epub 2022 Oct 6.

Two FTD-ALS genes converge on the endosomal pathway to induce TDP-43 pathology and degeneration

Affiliations

Two FTD-ALS genes converge on the endosomal pathway to induce TDP-43 pathology and degeneration

Wei Shao et al. Science. .

Abstract

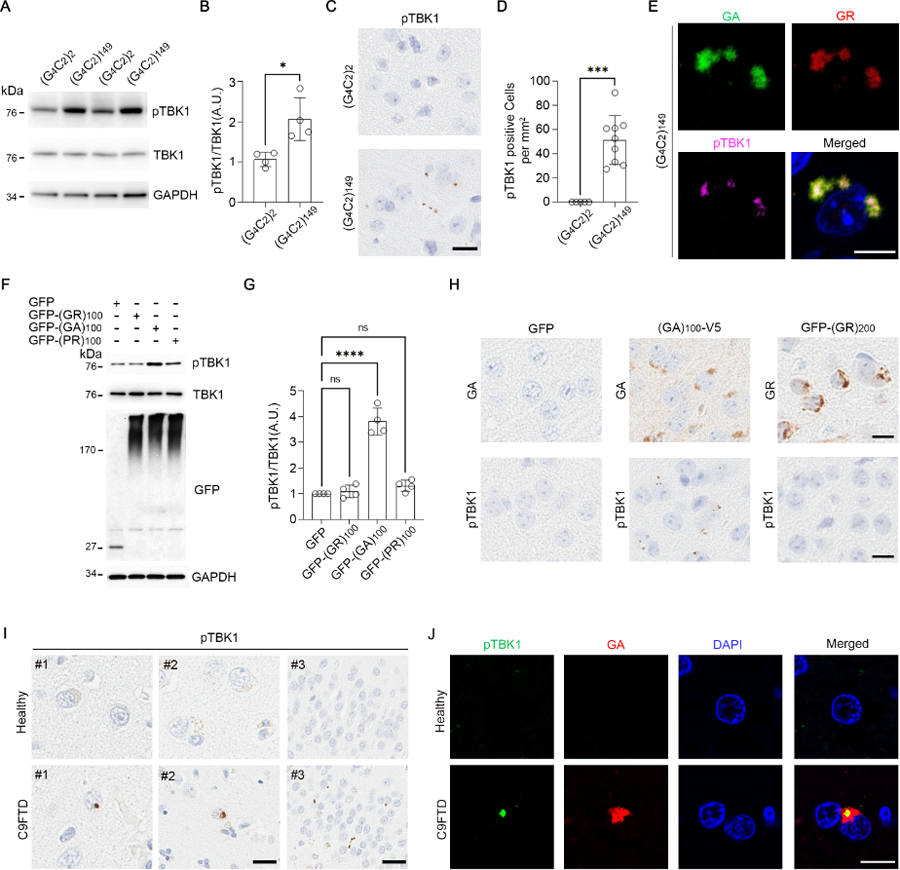
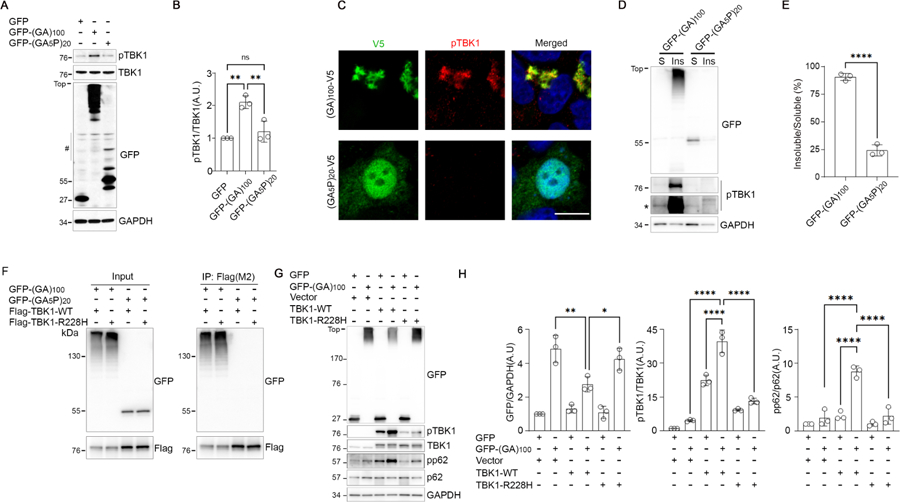
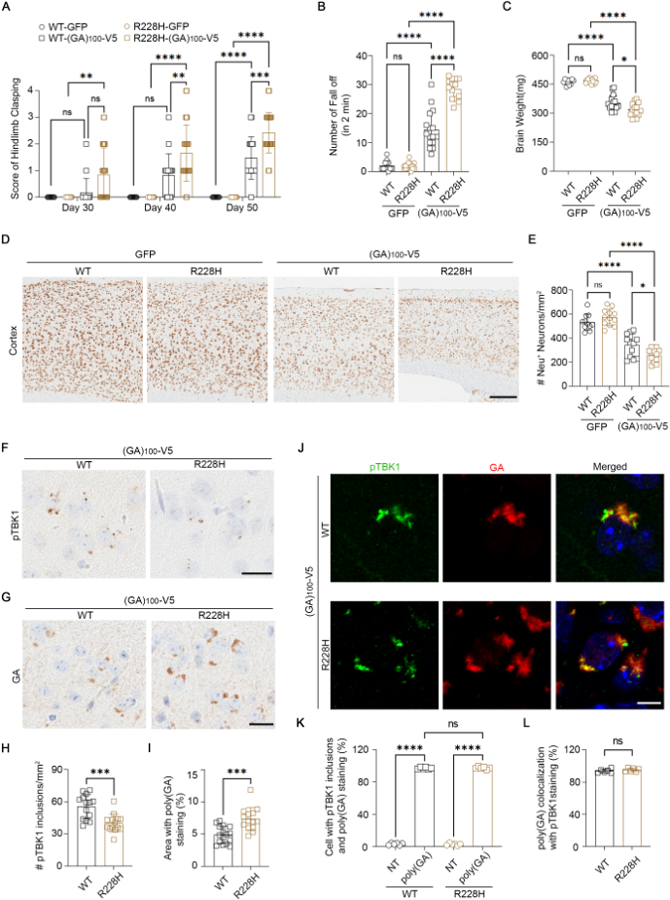
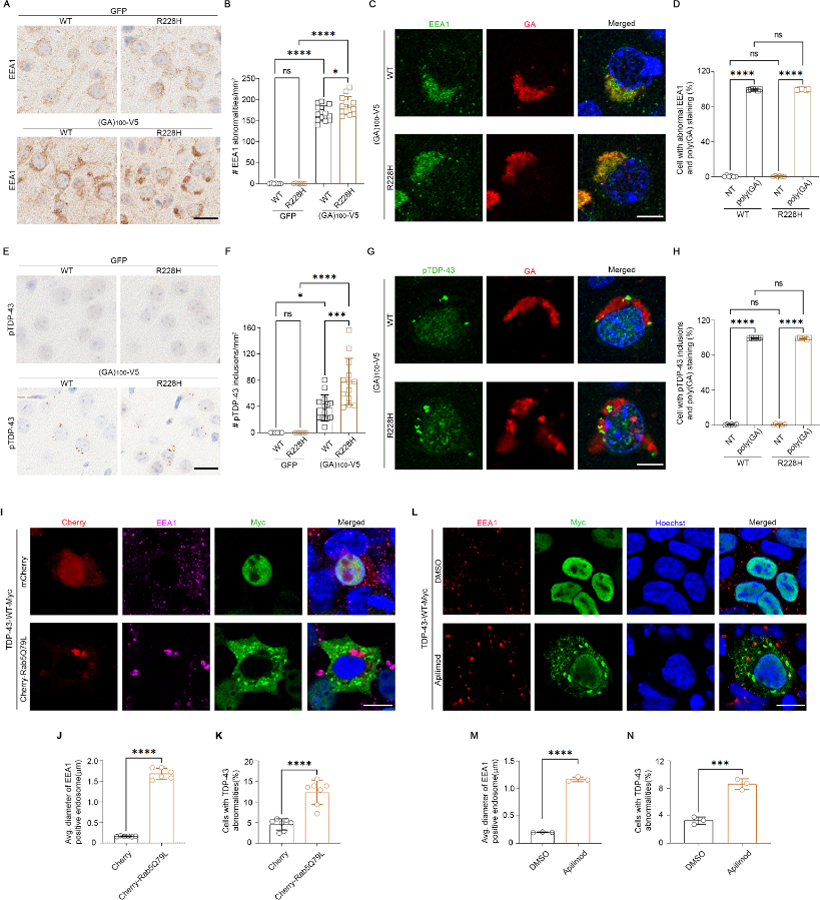
Frontotemporal dementia and amyotrophic lateral sclerosis (FTD-ALS) are associated with both a repeat expansion in the C9orf72 gene and mutations in the TANK-binding kinase 1 (TBK1) gene. We found that TBK1 is phosphorylated in response to C9orf72 poly(Gly-Ala) [poly(GA)] aggregation and sequestered into inclusions, which leads to a loss of TBK1 activity and contributes to neurodegeneration. When we reduced TBK1 activity using a TBK1-R228H (Arg228→His) mutation in mice, poly(GA)-induced phenotypes were exacerbated. These phenotypes included an increase in TAR DNA binding protein 43 (TDP-43) pathology and the accumulation of defective endosomes in poly(GA)-positive neurons. Inhibiting the endosomal pathway induced TDP-43 aggregation, which highlights the importance of this pathway and TBK1 activity in pathogenesis. This interplay between C9orf72, TBK1, and TDP-43 connects three different facets of FTD-ALS into one coherent pathway.


Conflict of interest statement

Competing interests: L.P. and Mayo Clinic have licensed technology involving C9orf72 Repeat Expansion Constructs and Virus and AAV-C9orf72–149 Repeat Expansion Mouse Model. L.P. is a consultant for Expansion Therapeutics. M.P. is a consultant for Target ALS. B.O. has consulted for Biogen, Medicinova, Mitsubishi, AnnJi and Tsumura. The other authors declare that they have no competing interests.

Figures

Fig. 1.
Fig. 1.. pTBK1 accumulates into DPR aggregates in c9FTD-ALS.
(A and B) Immunoblot (A) and quantification (B) of 6-month-old mouse cortical lysates (N = 4 mice). GAPDH, glyceraldehyde-3-phosphate dehydrogenase; A.U., arbitrary units. (C and D) Images (C) and quantification (D) of pTBK1 in 6-month-old mouse cortex (N = 9). Scale bar, 20 μm. (E) Immunofluorescence in 6-month-old mouse cortices. Scale bar, 10 μm. (F and G) Immunoblot (F) and quantification (G) of HEK293T lysates (N = 4 independent experiments). GFP monomer: ~27k Da; GFP-DPRs: high molecular weight (HMW) smears. (H) Immunostaining in the cortex of 3.5-month-old GFP and (GA)100-V5 mice and 2-week-old GFP-(GR)200 mice. Scale bars, 20 μm. (I) Immunostaining in healthy and C9-FTD frontal cortex (images labeled #1 and #2; scale bar, 10 μm) and hippocampus (images labeled #3; scale bar, 50 μm). (J) Immunofluorescence in healthy and C9-FTD frontal cortex. Scale bar, 10 μm. DAPI, 4′,6-diamidino-2-phenylindole. Data are means ± standard deviations (SDs). *P ≤ 0.05; ***P ≤ 0.001; ****P ≤ 0.0001; ns, nonsignificant. Statistics by Student’s t tests in (B) and (D) and one-way analysis of variance (ANOVA) in (G). Single-letter abbreviations for the amino acid residues are as follows: A, Ala; G, Gly; P, Pro; R, Arg.
Fig. 2.
Fig. 2.. Poly(GA) aggregation sequesters TBK1 into inclusions, which limits its activity.
(A and B) Immunoblot (A) and quantification (B) of HEK293T lysates (N = 3 independent experiments). The number symbol in (A) indicates nonspecific bands. (C) Immunofluorescence of HEK293T cells. Scale bar, 10 μm. (D and E) Immunoblot (D) and quantification € of HEK293T lysate fractions (N = 3). S, soluble; Ins, insoluble. The asterisk in (D) indicates higher exposure. (F) Coimmunoprecipitation analysis of HEK293T lysates. P, immunoprecipitation. (G and H) Immunoblot (G) and quantification (H) of HEK293T lysates (N = 3). In all blots, GFP monomer: ~27 kDa; GFP-DPRs: ~50 kDa unaggregated, HMW oligomerized. Data are means ± SDs. *P ≤ 0.05; **P ≤ 0.01; ****P ≤ 0.0001; ns, nonsignificant. Statistics by one-way ANOVA.
Fig. 3.
Fig. 3.. Reducing TBK1 activity exacerbates the behavioral, neurodegenerative, and pathological effects of poly(GA) in mice.
(A) Hindlimb clasping scores (N = 9, 10, 16, and 14 mice at each time point). WT, wild-type. (B) Hanging wire test in 3-month-old mice (N = 9, 10, 16, and 14). (C) Whole mouse brain weight (N = 12, 15, 16, and 14). (D and E) Images (D) and quantification (E) of NeuN in mouse cortex (N = 11, 12, 13, and 12). Scale bar, 200 µm. (F and H) Images (F) and quantification (H) of pTBK1 in mouse cortex (N = 14 each). Scale bar, 20 µm. (G and I) Images (G) and quantification (I) of poly(GA) in mouse cortex (N = 14 and 16). Scale bar, 20 µm. (J to L) Immunofluorescence (J) and quantification [(K) and (L)] in mouse cortex (N = 6 each). Scale bar, 10 μm. NT, non-transduced or poly(GA)-negative. Except in (A) and (B), mice were 3.5 months old. Data are means ± SDs. *P ≤ 0.05; **P ≤ 0.01; ***P ≤ 0.001; ****P ≤ 0.0001; ns, nonsignificant. Statistics by two-way ANOVA in (A), Student’s t test in (H) to (I), and one-way ANOVA in remaining panels.
Fig. 4.
Fig. 4.. Poly(GA) induces endosomal defects that trigger TDP-43 proteinopathy, and a reduction in TBK1 activity intensifies this process.
(A and B) Images (A) and quantification (B) of early endosome antigen 1 (EEA1) in mouse cortex (N = 6, 6, 13, and 13 mice). Scale bar, 20 µm. (C and D) Immunofluorescence (C) and quantification (D) in mouse cortex (N = 6 each). Scale bar, 10 μm. (E and F) Images (E) and quantification (F) of pTDP-43 in mouse cortex (N = 6, 6, 14, and 13). Scale bar, 20 µm. (G and H) Immunofluorescence (G) and quantification (H) in mouse cortex (N = 6 each). Scale bar, 10 μm. (I to K) Immunofluorescence (I) and quantification [(J) and (K)] in HEK293T cells. Scale bar, 10 μm. (L to M) Immunofluorescence (L) and quantification [(M) and (N)] in HEK293T cells ± apilimod treatment (N = 3 independent experiments). Scale bar, 10 μm. All mice were 3.5 months old. Data are means ± SDs. *P ≤ 0.05; ***P ≤ 0.001; ****P ≤ 0.0001; ns, nonsignificant. Statistics by Student’s t test in (J), (K), (M), and (N) and by one-way ANOVA in remaining panels.

Comment in

References

    1. Shahheydari H et al., Protein Quality Control and the Amyotrophic Lateral Sclerosis/Frontotemporal Dementia Continuum. Front Mol Neurosci 10, 119 (2017). - PMC - PubMed
    1. Cui R, Tuo M, Li P, Zhou C, Association between TBK1 mutations and risk of amyotrophic lateral sclerosis/frontotemporal dementia spectrum: a meta-analysis. Neurol Sci 39, 811–820 (2018). - PubMed
    1. Brenner D et al., Heterozygous Tbk1 loss has opposing effects in early and late stages of ALS in mice. J Exp Med 216, 267–278 (2019). - PMC - PubMed
    1. Xu D et al., TBK1 Suppresses RIPK1-Driven Apoptosis and Inflammation during Development and in Aging. Cell 174, 1477–1491 e1419 (2018). - PMC - PubMed
    1. Gerbino V et al., The Loss of TBK1 Kinase Activity in Motor Neurons or in All Cell Types Differentially Impacts ALS Disease Progression in SOD1 Mice. Neuron 106, 789–805 e785 (2020). - PubMed

MeSH terms

Supplementary concepts

LinkOut - more resources