. 2023 Feb 23;141(8):904-916.
doi: 10.1182/blood.2022016534.

Genetic subgroups inform on pathobiology in adult and pediatric Burkitt lymphoma

Nicole Thomas  1 Kostiantyn Dreval  1 Daniela S Gerhard  2 Laura K Hilton  3 Jeremy S Abramson  4 Richard F Ambinder  5 Stefan Barta  6 Nancy L Bartlett  7 Jeffrey Bethony  8 Kishor Bhatia  9 Jay Bowen  10 Anthony C Bryan  10 Ethel Cesarman  11 Corey Casper  12 Amy Chadburn  13 Manuela Cruz  1 Dirk P Dittmer  14 Maureen A Dyer  15 Pedro Farinha  3 Julie M Gastier-Foster  10   16 Alina S Gerrie  3 Bruno M Grande  17 Timothy Greiner  18 Nicholas B Griner  2 Thomas G Gross  19 Nancy L Harris  20 John D Irvin  21 Elaine S Jaffe  22 David Henry  6 Rebecca Huppi  23 Fabio E Leal  24 Michael S Lee  25 Jean Paul Martin  21 Marie-Reine Martin  21 Sam M Mbulaiteye  26 Ronald Mitsuyasu  27 Vivian Morris  28 Charles G Mullighan  29 Andrew J Mungall  30 Karen Mungall  30 Innocent Mutyaba  31 Mostafa Nokta  23 Constance Namirembe  31 Ariela Noy  32 Martin D Ogwang  33 Abraham Omoding  31 Jackson Orem  31 German Ott  34 Hilary Petrello  10 Stefania Pittaluga  22 James D Phelan  28 Juan Carlos Ramos  35 Lee Ratner  7 Steven J Reynolds  36 Paul G Rubinstein  37 Gerhard Sissolak  38 Graham Slack  3 Shaghayegh Soudi  1 Steven H Swerdlow  39 Alexandra Traverse-Glehen  40 Wyndham H Wilson  28 Jasper Wong  3 Robert Yarchoan  23 Jean C ZenKlusen  41 Marco A Marra  30   42 Louis M Staudt  28 David W Scott  3 Ryan D Morin  1   3   30
Affiliations

Genetic subgroups inform on pathobiology in adult and pediatric Burkitt lymphoma

Nicole Thomas et al. Blood. .

Abstract

Burkitt lymphoma (BL) accounts for most pediatric non-Hodgkin lymphomas, being less common but significantly more lethal when diagnosed in adults. Much of the knowledge of the genetics of BL thus far has originated from the study of pediatric BL (pBL), leaving its relationship to adult BL (aBL) and other adult lymphomas not fully explored. We sought to more thoroughly identify the somatic changes that underlie lymphomagenesis in aBL and any molecular features that associate with clinical disparities within and between pBL and aBL. Through comprehensive whole-genome sequencing of 230 BL and 295 diffuse large B-cell lymphoma (DLBCL) tumors, we identified additional significantly mutated genes, including more genetic features that associate with tumor Epstein-Barr virus status, and unraveled new distinct subgroupings within BL and DLBCL with 3 predominantly comprising BLs: DGG-BL (DDX3X, GNA13, and GNAI2), IC-BL (ID3 and CCND3), and Q53-BL (quiet TP53). Each BL subgroup is characterized by combinations of common driver and noncoding mutations caused by aberrant somatic hypermutation. The largest subgroups of BL cases, IC-BL and DGG-BL, are further characterized by distinct biological and gene expression differences. IC-BL and DGG-BL and their prototypical genetic features (ID3 and TP53) had significant associations with patient outcomes that were different among aBL and pBL cohorts. These findings highlight shared pathogenesis between aBL and pBL, and establish genetic subtypes within BL that serve to delineate tumors with distinct molecular features, providing a new framework for epidemiologic, diagnostic, and therapeutic strategies.


Conflict of interest statement

Conflict-of-interest disclosure: R.D.M. and D.W.S. are named inventors on a patent application describing the double-hit signature. C.G.M. received research funding from Pfizer and AbbVie; was an advisory board member at Illumina; and was on the speaker’s bureau at Amgen. R.Y. reports receiving research support from Celgene (now Bristol Myers Squibb) through CRADAs with the NCI. R.Y. also reports receiving drugs for clinical trials from Merck, EMD-Serano, Eli Lilly, and CTI BioPharma through CRADAs with the NCI, and he has received drug supply for laboratory research from Janssen Pharmaceuticals. R.Y. is a coinventor on US Patent 10 001 483 entitled “Methods for the treatment of Kaposi's sarcoma or KSHV-induced lymphoma using immunomodulatory compounds and uses of biomarkers.” An immediate family member of R.Y. is a coinventor on patents or patent applications related to internalization of target receptors, epigenetic analysis, and ephrin tyrosine kinase inhibitors. All rights, title, and interest to these patents have been assigned to the US Department of Health and Human Services; the government conveys a portion of the royalties it receives to its employee inventors under the Federal Technology Transfer Act of 1986 (P.L. 99-502). A.N. received research funding from Pharmacyclics/AbbVie, Kite/Gilead, and Cornerstone; was a consultant for Janssen, Morphosys, Cornerstone, Epizyme, EUSA Pharma, TG Therapeutics, ADC Therapeutics, and Astra Zeneca; and has received honoraria from Pharmacyclics/AbbVie. The remaining authors declare no competing financial interests.

Figures

None
Graphical abstract
Figure 1.
Figure 1.
Structural variations involving MYC in BL. Translocations between the MYC locus (chromosome 8) and the IGH (chromosome 14), IGK (chromosome 2), or IGL (chromosome 22) loci in tumors with IG-MYC breakpoints detected from WGS (N = 212). The subset of IGH-MYC breakpoints with high-confidence breakpoint positions identified are colored on the basis of their category, as determined by location within IGH (red = CSR, or blue = SHM). Bar charts on the lower left display the frequency of IG-MYC breakpoints (left) and IGH breakpoint category (right). The lower part of A and B linearly depicts IGH-MYC rearrangements colored by breakpoint category. (A) Adult (N = 80) and pediatric (N = 132) samples are shown separately. (B) EBV-negative (N = 103) and EBV-positive (N = 109) samples are shown separately. The inferred IGH breakpoint category frequencies stratified by age (C) and EBV status (D) were subjected to a Fisher exact test (∗∗P < .01). (E) AICDA expression in adult and pediatric BL tumors separated by EBV status (Wilcoxon rank sum test; ∗∗∗P < .001). AICDA, activation-induced cytidine deaminase; CSR, class-switch recombination; IGH, immunoglobulin heavy chain; IGK, immunoglobulin light chain kappa; IGL, immunoglobulin light chain lambda; SHM, somatic hypermutation.
Figure 2.
Figure 2.
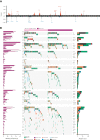
Significantly mutated genes in BL. (A) Cumulative representation of recurrent copy number aberrations across BL and DLBCL identified by Genomic Identification of Significant Targets in Cancer, version 2.0 (GISTIC2.0) (default Q value threshold). (B) EBV-positive (N = 118) and EBV-negative (N = 112) BL tumors are shown separately, and each set of genes associated with a specific pathway is separately ordered to highlight mutual exclusivity. Mutations are colored on the basis of their predicted consequence, and the frequency of each variant type is tallied in the bar plots on the right. Focal gains and deletions were defined as those <1 Mbp. Mutation prevalence in EBV-positive (N = 118) and EBV-negative (N = 112) cases was subject to a Fisher exact test with Bonferroni correction and is shown in the bar plots on the left. ∗Q < 0.1, ∗∗Q < 0.05, and ∗∗∗Q < 0.01.
Figure 3.
Figure 3.
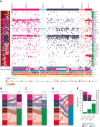
Identification of distinct genomic subgroups in BL and DLBCL. (A) Clustering solution from non–negative matrix factorization (NMF) utilizing a combination of simple somatic mutations, CNVs, SVs, SHM patterns, and hotspot mutations as features. The proportional abundance of each feature in the clusters is shown on the left side. Each individual feature is labeled on the right side of the heat map. IGH/K/L-MYC breakpoints were considered as separate features (labeled as “MYC_IG”), and when MYC was not translocated to IGH, IGK, or IGL, it was considered separately and labeled “MYC_not_IG.” The right annotation track depicts whether the feature significantly enriched in BL, DLBCL, or neither of these entities. Alluvial plots showing distribution of different entities by EBV status (B), age (C), or sex (D) between identified clusters. For all panels except A, only patient samples with available sex information are shown. IGH, immunoglobulin heavy chain; IGK, immunoglobulin light chain kappa; IGL, immunoglobulin light chain lambda.
Figure 4.
Figure 4.
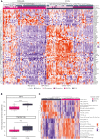
Genetic subgroups of BL are associated with unique transcriptomic patterns. (A) The heat map displays the 71 differentially expressed genes between subgroups, with rows representing differentially expressed genes and columns representing samples. Rows and columns are clustered on the basis of Pearson correlation. The top annotations indicate subgroup membership, EBV status, age, and sex. Although the separation is incomplete, when clustered on these genes, most DGG-BL cases cluster to the left, whereas most IC-BL cases cluster to the right. (B) Variance stabilized expression of IRF4 and TNFRSF13B, the genes with the strongest differential expression between DGG-BL and IC-BL. Expression values are along the y axis, with subgroup membership indicated along the x axis. Expression values are stratified on the basis of subgroup membership, with IC-BL exhibiting significantly elevated expression of both IRF4 and TNFRSF13B (∗∗∗∗P < .001; Wilcoxon rank sum test). (C) Heat map representing the hierarchical clustering of gene sets obtained from the signatureDB database. Samples are clustered and ordered on their expression of genes within each gene set. Rows represent the gene sets, and columns represent samples. Rows and columns are clustered on the basis of euclidean distance measure.
Figure 5.
Figure 5.
Genetic subgroups are characterized by distinct molecular features. (A) Rates of simple somatic mutations in 1000-bp windows sliding by 500 bp within known sites affected by aSHM. Only bins with at least 20 patients harboring mutations at the particular aSHM site are included in the visualization. Only the sites mutated at differential frequency between EBV-positive and EBV-negative, or between aBL and pBL, are shown (pairwise Fisher exact test with Benjamini-Hochberg multiple test correction). The asterisk (∗) alongside aSHM site indicates its mutation rates being significantly enriched in BL compared with DLBCL. (B) Patients with BL in the genetic subgroup DLBCL-C are characterized by the highest levels of mutation at aSHM sites across common targets (using only samples from patients with BL). Each point indicates odds ratio relative to the aSHM rates for patients in Q53-BL subgroup ± SE.

Comment in

Similar articles

Cited by

References

    1. Magrath I. Epidemiology: clues to the pathogenesis of Burkitt lymphoma. Br J Haematol. 2012;156(6):744–756. - PubMed
    1. Molyneux EM, Rochford R, Griffin B, et al. Burkitt’s lymphoma. Lancet. 2012;379(9822):1234–1244. - PubMed
    1. Grande BM, Gerhard DS, Jiang A, et al. Genome-wide discovery of somatic coding and noncoding mutations in pediatric endemic and sporadic Burkitt lymphoma. Blood. 2019;133(12):1313–1324. - PMC - PubMed
    1. Abate F, Ambrosio MR, Mundo L, et al. Distinct viral and mutational spectrum of endemic Burkitt lymphoma. PLoS Pathog. 2015;11(10) - PMC - PubMed
    1. Kaymaz Y, Oduor CI, Yu H, et al. Comprehensive transcriptome and mutational profiling of endemic Burkitt lymphoma reveals EBV type-specific differences. Mol Cancer Res. 2017;15(5):563–576. - PMC - PubMed

Publication types