Review
. 2022:36:103205.
doi: 10.1016/j.nicl.2022.103205. Epub 2022 Sep 24.

Cortical lesions, central vein sign, and paramagnetic rim lesions in multiple sclerosis: Emerging machine learning techniques and future avenues

Affiliations
Review

Cortical lesions, central vein sign, and paramagnetic rim lesions in multiple sclerosis: Emerging machine learning techniques and future avenues

Francesco La Rosa et al. Neuroimage Clin. 2022.

Abstract

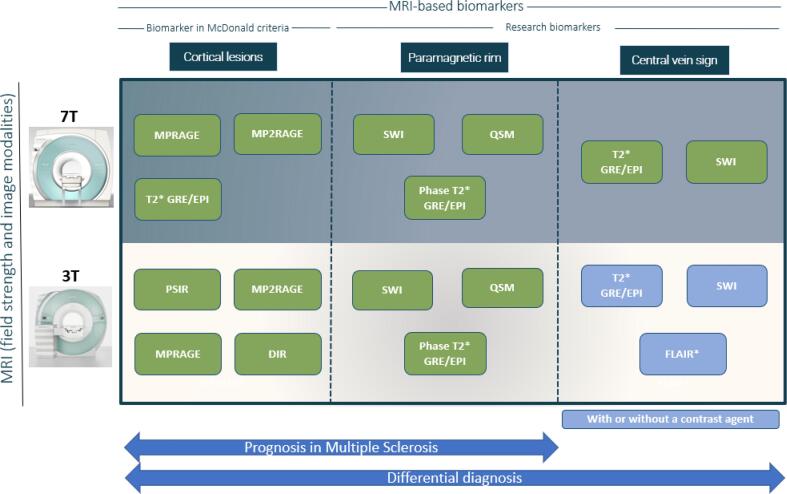
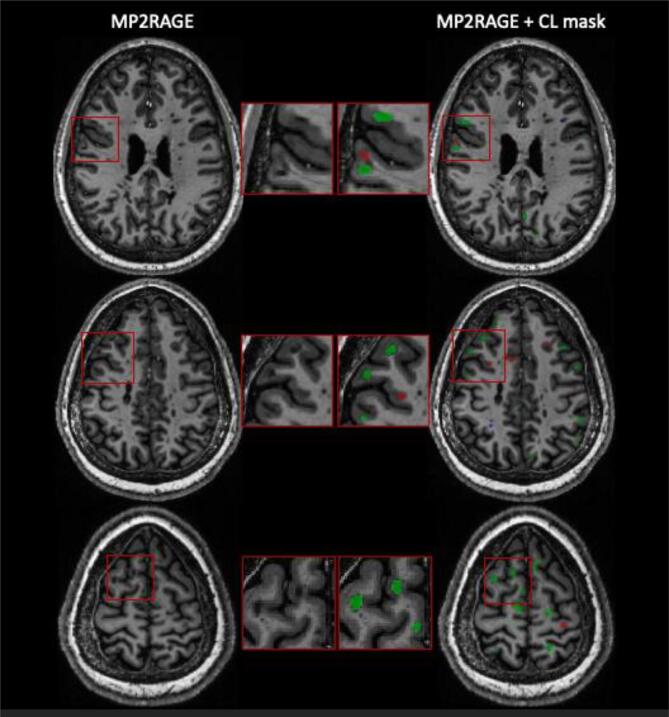
The current diagnostic criteria for multiple sclerosis (MS) lack specificity, and this may lead to misdiagnosis, which remains an issue in present-day clinical practice. In addition, conventional biomarkers only moderately correlate with MS disease progression. Recently, some MS lesional imaging biomarkers such as cortical lesions (CL), the central vein sign (CVS), and paramagnetic rim lesions (PRL), visible in specialized magnetic resonance imaging (MRI) sequences, have shown higher specificity in differential diagnosis. Moreover, studies have shown that CL and PRL are potential prognostic biomarkers, the former correlating with cognitive impairments and the latter with early disability progression. As machine learning-based methods have achieved extraordinary performance in the assessment of conventional imaging biomarkers, such as white matter lesion segmentation, several automated or semi-automated methods have been proposed as well for CL, PRL, and CVS. In the present review, we first introduce these MS biomarkers and their imaging methods. Subsequently, we describe the corresponding machine learning-based methods that were proposed to tackle these clinical questions, putting them into context with respect to the challenges they are facing, including non-standardized MRI protocols, limited datasets, and moderate inter-rater variability. We conclude by presenting the current limitations that prevent their broader deployment and suggesting future research directions.


Conflict of interest statement

Declaration of Competing Interest The University Hospital Basel (USB), as the employer of C.G., has received the following fees which were used exclusively for research support: (i) advisory board and consultancy fees from Actelion, Genzyme-Sanofi, Novartis, GeNeuro and Roche; (ii) speaker feesfrom Genzyme-Sanofi, Novartis, GeNeuro and Roche; (iii) research support from Siemens, GeNeuro, Roche. M.A. has received consultancy fees from GSK and Sanofi-Genzyme. P.M. has received support from Biogen and Cliniques universitaires Saint-Luc Fonds de Recherche Clinique. D.S.R. has received research support from Abata, Sanofi-Genzyme, and Vertex. The other authors have no known competing financial interests or personal relationships that could have appeared to influence the work reported in this paper.

Figures

Fig. 1
Fig. 1
Representative examples of the three main types of CL. From left to right: 3 T MP2RAGE (0.75 mm isometric), 7 T MP2RAGE (0.5 mm isometric), 7 T T2*-EPI (0.5 mm isometric) and 7 T T2*-GRE (0.5 mm isometric). CL, including leukocortical, intracortical, and subpial subtypes, are seen better at 7 T due to higher signal-to-noise ratios, allowing higher resolution scans, and increased susceptibility effects. The 7 T MP2RAGE image shown was obtained as the average of 4 acquisitions.
Fig. 2
Fig. 2
examples of CL seen in different MRI contrasts at 3 T. From left to right: MP2RAGE, DIR, PSIR, IR-SWIET, T2*. Red arrows point to leukocortical lesions and blue arrows to subpial lesions. (For interpretation of the references to colour in this figure legend, the reader is referred to the web version of this article.)
Fig. 3
Fig. 3
A central vein running through a lesion visible in the three planes (zoomed-in boxes) in a 3D FLAIR* obtained combining FLAIR and T2*-EPI acquisitions at 3 T. Resampling was applied to the magnified images for visualization purposes. FLAIR, T2*-EPI and FLAIR* are the MRI contrasts that have been used by ML approaches for CVS detection. Refer to the supplementary material for additional examples of the CVS on different susceptibility-weighted imaging sequences.
Fig. 4
Fig. 4
(A) Representative paramagnetic rim lesion seen on a 3 T T2*-weighted seg-EPI magnitude and unwrapped filtered phase in the three orthogonal planes (zoomed-in red boxes, the rim is indicated with red arrows). The central vein (yellow arrows) is also clearly visible within the lesion. (B) Representative periventricular MS lesion with a paramagnetic rim. Paramagnetic rims are visible on both unwrapped phase and QSM-reconstructed images (white arrows). (For interpretation of the references to colour in this figure legend, the reader is referred to the web version of this article.)
Fig. 5
Fig. 5
Scheme showing the main MRI sequences used for detecting each biomarker at both 3 T and 7 T.
Fig. 6
Fig. 6
Three representative axial slices from one MS patient showing the CL segmentation results of an automated CL segmentation method (La Rosa et al., 2020). 7 T MP2RAGE (left column) and CL mask (right column) showing true positives (green), false negatives (red), and false positives (blue) of the automated approach with respect to the CL manual segmentation. (For interpretation of the references to colour in this figure legend, the reader is referred to the web version of this article.)

References

    1. Absinta M., Sati P., Schindler M., et al. Persistent 7-tesla phase rim predicts poor outcome in new multiple sclerosis patient lesions. J Clin Invest. 2016;126(7):2597–2609. doi: 10.1172/JCI86198. - DOI - PMC - PubMed
    1. Absinta M., Sati P., Fechner A., Schindler M.K., Nair G., Reich D.S. Identification of chronic active multiple sclerosis lesions on 3T MRI. Am J Neuroradiol. 2018;39(7):1233–1238. doi: 10.3174/ajnr.A5660. - DOI - PMC - PubMed
    1. Absinta M., Sati P., Masuzzo F., et al. Association of chronic active multiple sclerosis lesions with disability in vivo. JAMA Neurol. 2019;76(12):1474. doi: 10.1001/jamaneurol.2019.2399. - DOI - PMC - PubMed
    1. Absinta M., Maric D., Gharagozloo M., et al. A lymphocyte–microglia–astrocyte axis in chronic active multiple sclerosis. Nature. 2021;597(7878):709–714. doi: 10.1038/s41586-021-03892-7. - DOI - PMC - PubMed
    1. Antonelli M, Reinke A, Bakas S, et al. The Medical Segmentation Decathlon. ArXiv210605735 Cs Eess. Published online June 10, 2021. Accessed November 8, 2021. http://arxiv.org/abs/2106.05735.