. 2022 Dec 21;110(24):4057-4073.e8.
doi: 10.1016/j.neuron.2022.09.009. Epub 2022 Oct 5.

A brain atlas of synapse protein lifetime across the mouse lifespan

Affiliations

A brain atlas of synapse protein lifetime across the mouse lifespan

Edita Bulovaite et al. Neuron. .

Abstract

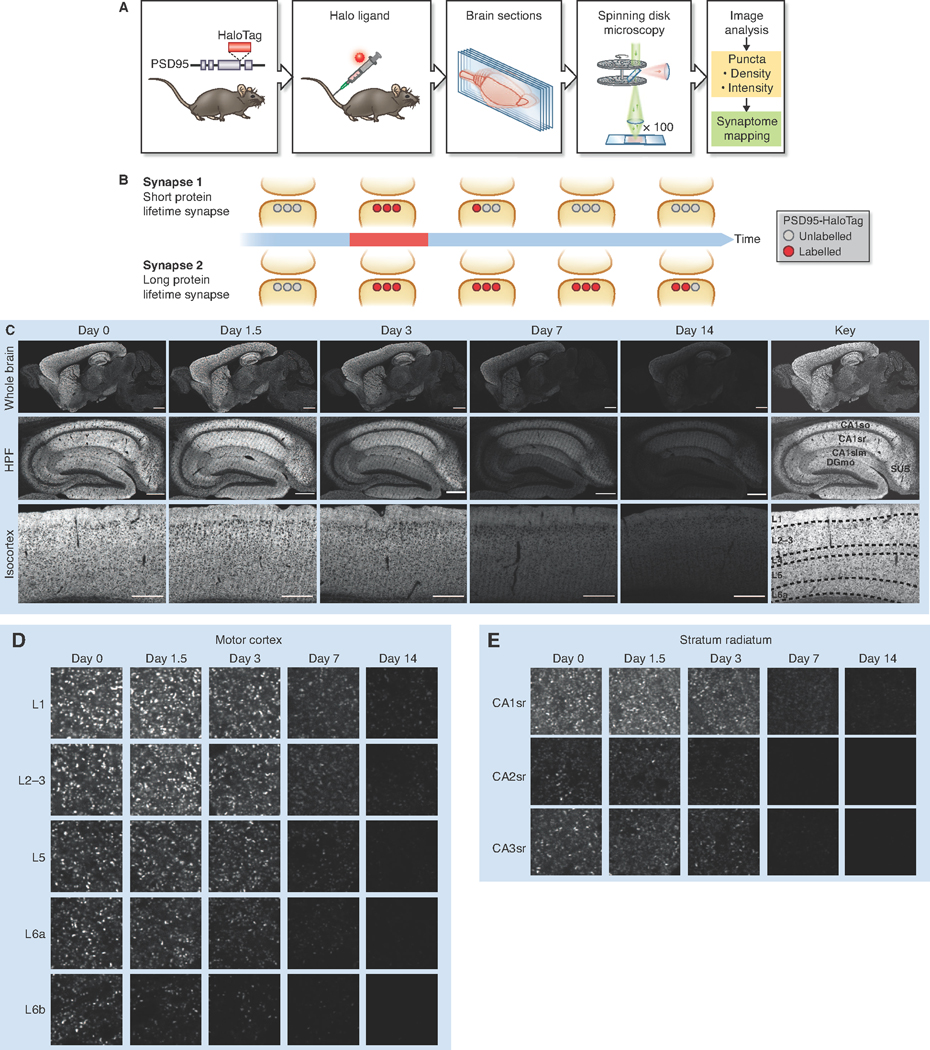
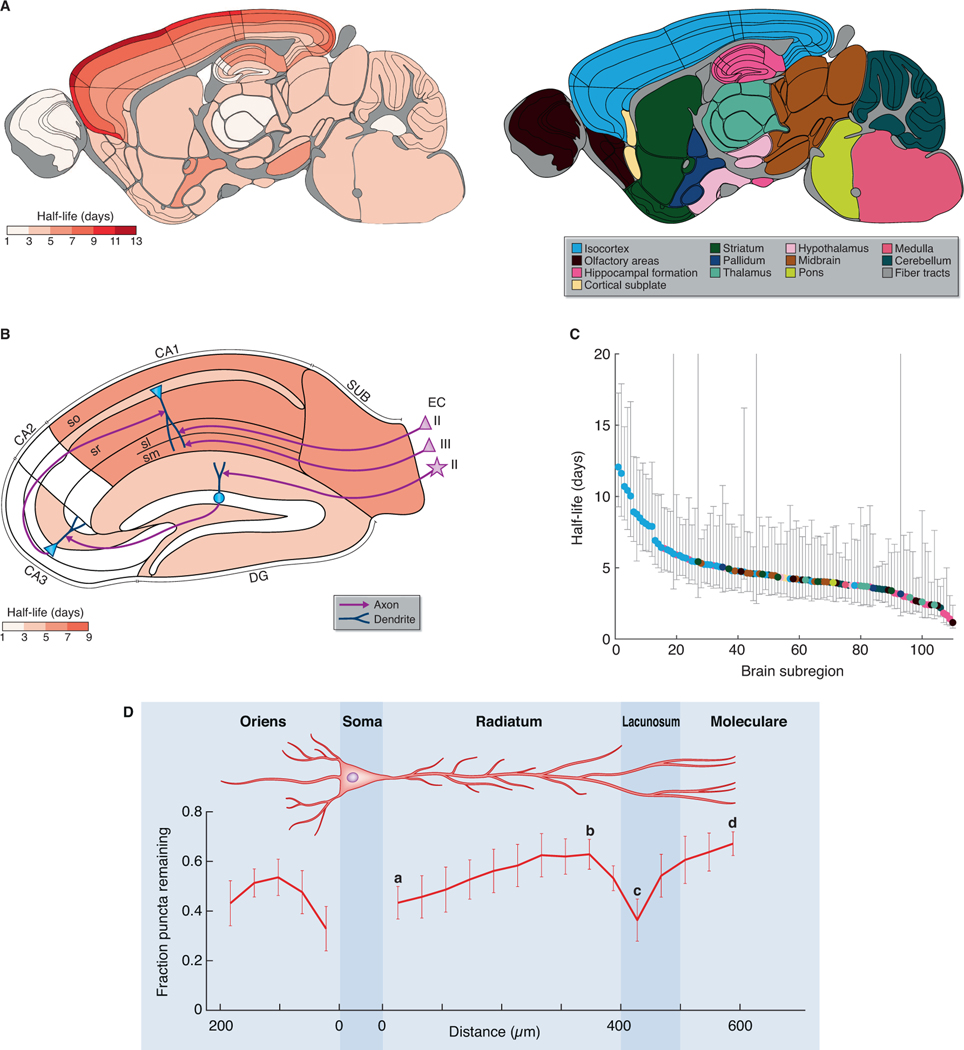
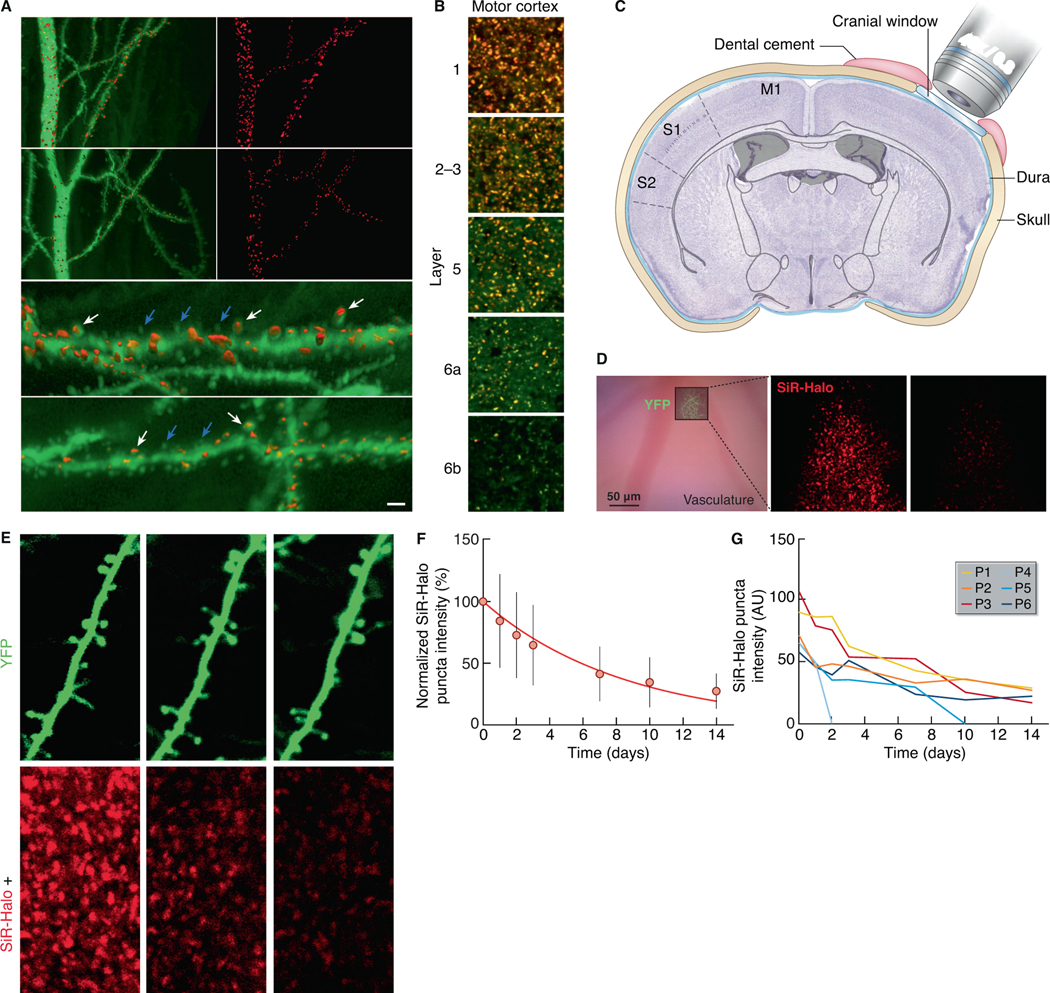
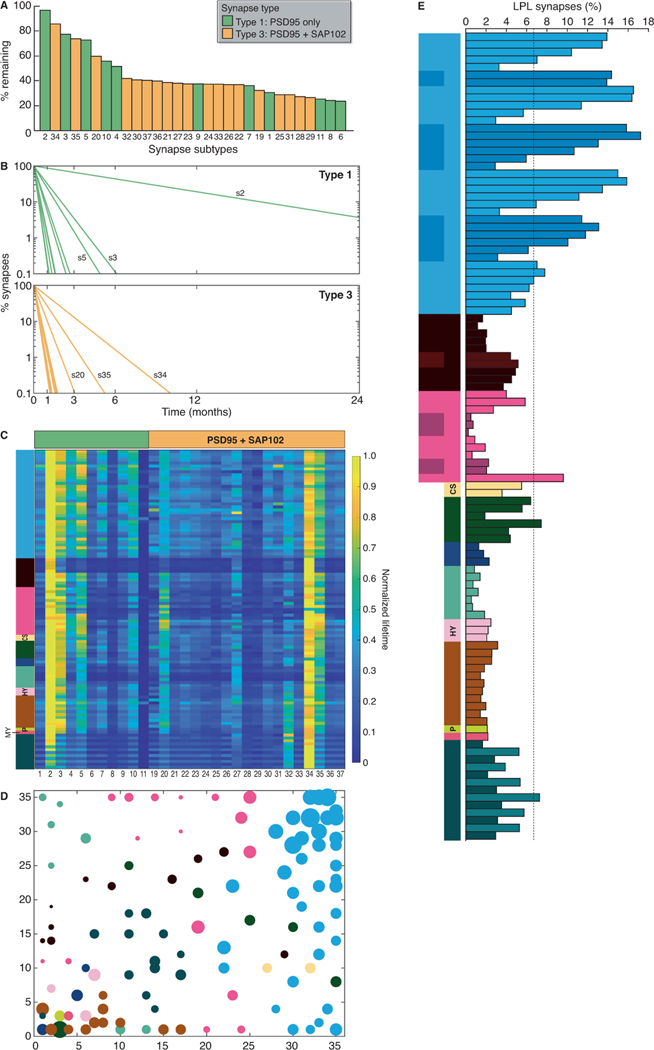
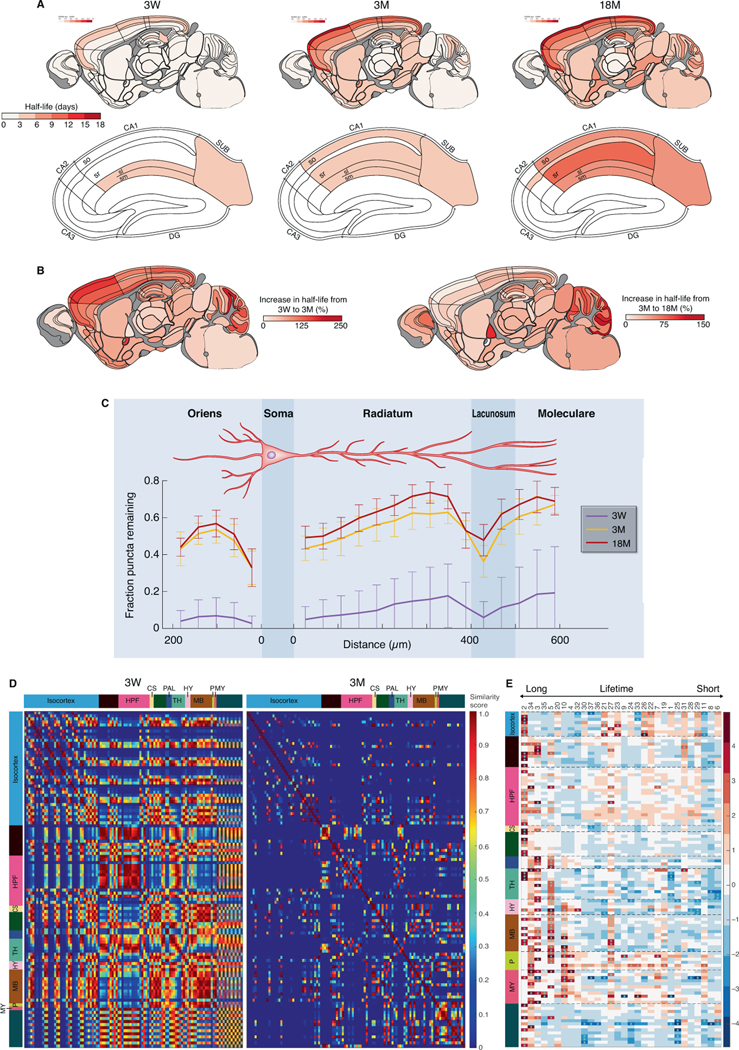
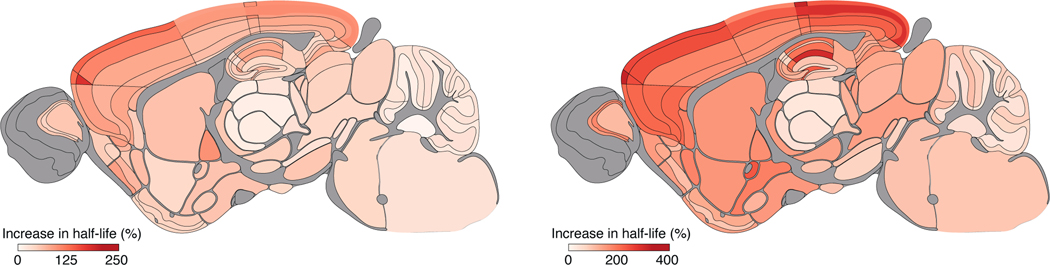
The lifetime of proteins in synapses is important for their signaling, maintenance, and remodeling, and for memory duration. We quantified the lifetime of endogenous PSD95, an abundant postsynaptic protein in excitatory synapses, at single-synapse resolution across the mouse brain and lifespan, generating the Protein Lifetime Synaptome Atlas. Excitatory synapses have a wide range of PSD95 lifetimes extending from hours to several months, with distinct spatial distributions in dendrites, neurons, and brain regions. Synapses with short protein lifetimes are enriched in young animals and in brain regions controlling innate behaviors, whereas synapses with long protein lifetimes accumulate during development, are enriched in the cortex and CA1 where memories are stored, and are preferentially preserved in old age. Synapse protein lifetime increases throughout the brain in a mouse model of autism and schizophrenia. Protein lifetime adds a further layer to synapse diversity and enriches prevailing concepts in brain development, aging, and disease.

Keywords: HaloTag; aging; autism; brain development; dendritic spine; postsynaptic density; protein turnover; proteostasis; pyramidal neuron; synapse proteome; synaptome.


Conflict of interest statement

Declaration of interests The authors declare no competing interests.

Figures

Fig. 1.
Fig. 1.. Visualizing synapse protein lifetime across the mouse brain.
(A) Experimental flow. Homozygous PSD95-HaloTag mice were injected with a Halo ligand, sagittal brain sections imaged using spinning disk confocal microscopy, and synaptic puncta analyzed and mapped. (B) Schematic of PSD95-HaloTag labeling in the postsynaptic terminal of synapses with short or long protein lifetime. (C) SiR-Halo fluorescence labeling at five time points post-injection, showing whole brain, HPF and layers of the isocortex. Key shows regions and layers (Table S1). (D,E) High-magnification representative images of puncta fluorescence decay in layers of the motor cortex (D) and in stratum radiatum of CA1, CA2 and CA3 subregions of the HPF (E). For brain region/subregion abbreviations, see Table S1. Scale bars: 2 mm (C, whole brain), 500 μm (C, HPF and CTX), 5 μm (D,E).
Fig. 2.
Fig. 2.. A brainwide atlas of synapse protein lifetime.
(A) PSD95 puncta half-life across 110 mouse brain subregions (Table S1). The 12 main brain areas are color-coded to the right. N=7–9 Psd95HaloTag/HaloTag animals. (B) PSD95 puncta half-life in HPF, with key elements of the circuitry shown. The pyramidal neurons in entorhinal cortex (EC) layer II project to CA1sl, pyramidal neurons in entorhinal cortex layer III project to CA1sm, and stellate neurons in entorhinal cortex layer II project to DG granule neurons, which in turn project to CA3, which project to CA1 (Marks et al., 2020). (C) Brain subregions ranked according to their half-life (± 95% confidence intervals), color-coded as in (A). (D) Fluorescent puncta decay (mean fraction of puncta remaining at day 7 compared with day 0, ± SD) across apical and basal dendrites of the CA1 pyramidal cells. N=3 Psd95HaloTag/HaloTag animals per time point. Reference points for calculating gradients along the apical dendrite are marked by a–d.
Fig. 3.
Fig. 3.. PSD95 turnover in dendritic spines.
(A) 3D reconstructed dye-filled CA1 neurons and SiR-Halo-positive puncta. (i-iv) CA1 apical dendrites (stratum radiatum) intracellularly injected with Alexa 488 (green) at day 0 (i, ii) and at day 10 post-injection of SiR-Halo (red) (iii, iv). (v, vi) Higher-magnification of (i) and (iii), respectively, showing dendritic spines with SiR-Halo-positive puncta (white arrows) and without SiR-Halo signal (blue arrows). Scale bar: 5 μm (i-iv), 1.5 μm (v, vi). (B) Colocalization (orange) of SiR-Halo (red) injected at day 0 and post-fixation-applied TMR-Halo (green) at day 3 in synapses across layers of the motor cortex. Scale bars: 5 μm. (C) Schematic of the cranial window implant above the somatosensory cortex. (D) Bright-field image (left) of the superficial vasculature and, superposed, a fluorescence image of YFP-labeled axons and dendrites in cortical layer 1 that are used as fiducial points for tracking SiR-Halo ligand puncta over time, as shown for day 0 (center) and day 7 (right). (E) A YFP-labeled dendrite (top) containing SiR-Halo-labeled puncta (bottom), repeatedly imaged over days to weeks. SiR-Halo puncta can be tracked in stable and dynamic spines (e.g. P1-P5) and in the immediate surrounding of the dendrite (e.g. P6). (F) The mean (± SD) fluorescence intensities of individual SiR-Halo puncta (n=295; N=3 Psd95HaloTag/HaloTag mice) normalized to the first imaging time point. Red line, a single exponential fit of the means (λ=0.12/day; t1/2=5.8 days). (G) The measured fluorescence intensity over time of the SiR-Halo puncta examples in (E).
Fig. 4.
Fig. 4.. PSD95 protein lifetimes differ between synapse subtypes.
(A) Ranked bar plot of synapse subtypes (coded 1–37, Zhu et al, 2018) according to their associated PSD95 lifetimes using whole-brain data. Shown is the percentage of each SiR-Halo-positive subtype remaining at day 7 compared with day 0. (B) Decay curves of PSD95 lifetime in type 1 and type 3 synapse subtypes, shown as percentage of synapses retaining SiR-Halo. Longest-lived subtypes (s) are indicated. (C) Synapse subtype PSD95 protein lifetimes for 110 brain subregions represented as a heatmap. The values in each row are normalized. (D) Self-organizing feature map (SOM) clustering based on subtype densities (STAR Methods). Color key as in Fig. 2A. (E) Percentage of LPL synapses in brain regions and subregions (Table S1). The cortical layers in isocortex are numbered and shown from top to bottom. Days 0 and 7 n=8 Psd95HaloTag/eGFP;Sap102mKO2/y mice.
Fig. 5.
Fig. 5.. Synapse protein lifetime changes across the lifespan.
(A) PSD95 puncta half-life across 110 mouse brain subregions in PSD95-HaloTag mice at 3W, 3M and 18M for the whole brain (top row) and HPF (bottom row). N=7–10 Psd95HaloTag/HaloTag mice for each time point and age group. (B) Percentage increase in puncta half-life between 3W and 3M (left brain map) and between 3W and 18M (right brain map). (C) Mean fraction of puncta remaining at day 7 compared with day 0 (± SD) is plotted across basal and apical dendrites of the CA1 dendritic tree at 3W, 3M and 18M (n=3 mice per group). (D) Matrix of half-life similarities between pairs of subregions (rows and columns) for the 3W and 3M age groups. Brain subregions are listed in Table S1. (E) Heatmap showing change (Cohen’s d effect size) in synapse subtype (subtype number shown at top) density across brain subregions between 3M and 18M. Subtypes are ranked with longest lifetime on the left and shortest on the right. *P<0.05 (Benjamini-Hochberg correction). See Fig. S11C for detailed heatmaps.
Fig. 6.
Fig. 6.. Synapse protein lifetime increases in Dlg2 mutant mice.
The percentage increase in PSD95 puncta density half-life in 3M mice carrying heterozygous or homozygous Dlg2 mutations, as compared with control mice. N=5–8 mice for each time point and genotype (animals are heterozygous for PSD95-HaloTag).

Similar articles

Cited by

References

    1. Akers KG, Arruda-Carvalho M, Josselyn SA, and Frankland PW. (2012). Ontogeny of contextual fear memory formation, specificity, and persistenece in mice. Learning and Memory. 19, 598–604. 10.1101/lm.027581.112 - DOI - PubMed
    1. Babiec WE, Jami SA, Guglietta R, Chen PB, and O’Dell TJ. (2017). Differential regulation of NMDA receptor-mediated transmission by SK channels underlies dorsal-ventral differences in dynamics of schaffer collateral synaptic function. J. Neurosci. 37, 1950–1964. 10.1523/JNEUROSCI.3196-16.2017 - DOI - PMC - PubMed
    1. Bähner F, and Meyer-Lindenberg A. (2017). Hippocampal–prefrontal connectivity as a translational phenotype for schizophrenia. Eur. Neuropsychopharmacol. 27, 93–106. 10.1016/j.euroneuro.2016.12.007 - DOI - PubMed
    1. Bayes A, van de Lagemaat LN, Collins MO, Croning MD, Whittle IR, Choudhary JS, and Grant SG. (2011). Characterization of the proteome, diseases and evolution of the human postsynaptic density. Nat Neurosci 14, 19–21. 10.1038/nn.2719 - DOI - PMC - PubMed
    1. Benavides-Piccione R., Fernaud-Espinosa I., Robles V., Yuste R., and DeFelipe J. (2013). Age-based comparison of human dendritic spine structure using complete three-dimensional reconstructions. Cereb. Cortex 23, 1798–1810. 10.1093/cercor/bhs154 - DOI - PMC - PubMed

Publication types

Substances

LinkOut - more resources