

Condensation of the fusion focus by the intrinsically disordered region of the formin Fus1 is essential for cell-cell fusion
- PMID: 36202103
- PMCID: PMC9671092
- DOI: 10.1016/j.cub.2022.09.026
Condensation of the fusion focus by the intrinsically disordered region of the formin Fus1 is essential for cell-cell fusion
Abstract
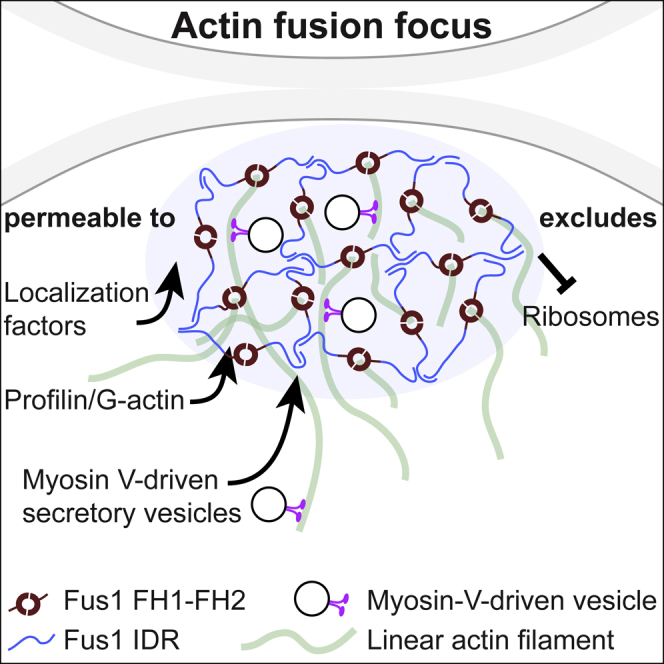
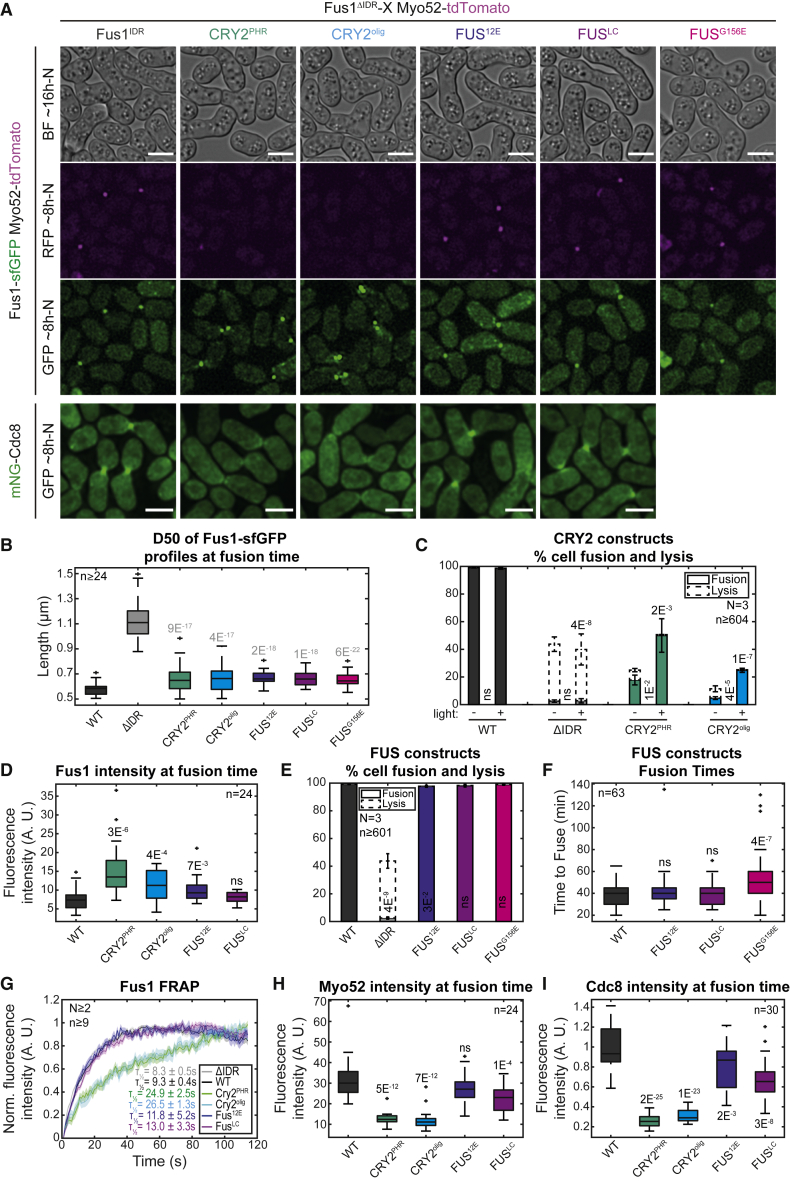
Secretory vesicle clusters transported on actin filaments by myosin V motors for local secretion underlie various cellular processes, such as neurotransmitter release at neuronal synapses,1 hyphal steering in filamentous fungi,2,3 and local cell wall digestion preceding the fusion of yeast gametes.4 During fission yeast Schizosaccharomyces pombe gamete fusion, the actin fusion focus assembled by the formin Fus1 concentrates secretory vesicles carrying cell wall digestive enzymes.5,6,7 The position and coalescence of the vesicle focus are controlled by local signaling and actin-binding proteins to prevent inappropriate cell wall digestion that would cause lysis,6,8,9,10 but the mechanisms of focusing have been elusive. Here, we show that the regulatory N terminus of Fus1 contains an intrinsically disordered region (IDR) that mediates Fus1 condensation in vivo and forms dense assemblies that exclude ribosomes. Fus1 lacking its IDR fails to concentrate in a tight focus and causes cell lysis during attempted cell fusion. Remarkably, the replacement of Fus1 IDR with a heterologous low-complexity region that forms molecular condensates fully restores Fus1 focusing and function. By contrast, the replacement of Fus1 IDR with a domain that forms more stable oligomers restores focusing but poorly supports cell fusion, suggesting that condensation is tuned to yield a selectively permeable structure. We propose that condensation of actin structures by an IDR may be a general mechanism for actin network organization and the selective local concentration of secretory vesicles.
Keywords: FUS; IDR; actin cytoskeleton; cell-cell fusion; condensate; cryptochrome CRY2; formin; fused in sarcoma; intrinsically disordered region; myosin V Myo52; optogenetics; yeast Schizosaccharomyces pombe.
Copyright © 2022 The Author(s). Published by Elsevier Inc. All rights reserved.
Conflict of interest statement
Declaration of interests The authors declare no competing interests.
Figures
Comment in
-
Targeted secretion: Myosin V delivers vesicles through formin condensates.Curr Biol. 2022 Nov 7;32(21):R1228-R1231. doi: 10.1016/j.cub.2022.10.001. Curr Biol. 2022. PMID: 36347230
Similar articles
-
Actin assembly requirements of the formin Fus1 to build the fusion focus.J Cell Sci. 2022 Jul 1;135(13):jcs260289. doi: 10.1242/jcs.260289. Epub 2022 Jul 8. J Cell Sci. 2022. PMID: 35673994 Free PMC article.
-
Capping Protein Insulates Arp2/3-Assembled Actin Patches from Formins.Curr Biol. 2019 Oct 7;29(19):3165-3176.e6. doi: 10.1016/j.cub.2019.07.088. Epub 2019 Sep 5. Curr Biol. 2019. PMID: 31495586 Free PMC article.
-
A formin-nucleated actin aster concentrates cell wall hydrolases for cell fusion in fission yeast.J Cell Biol. 2015 Mar 30;208(7):897-911. doi: 10.1083/jcb.201411124. J Cell Biol. 2015. PMID: 25825517 Free PMC article.
-
Role and organization of the actin cytoskeleton during cell-cell fusion.Semin Cell Dev Biol. 2016 Dec;60:121-126. doi: 10.1016/j.semcdb.2016.07.025. Epub 2016 Jul 27. Semin Cell Dev Biol. 2016. PMID: 27476112 Review.
-
Actin and Myosin in Non-Neuronal Exocytosis.Cells. 2020 Jun 11;9(6):1455. doi: 10.3390/cells9061455. Cells. 2020. PMID: 32545391 Free PMC article. Review.
Cited by
-
The roles of yeast formins and their regulators Bud6 and Bil2 in the pheromone response.Mol Biol Cell. 2024 Jun 1;35(6):ar85. doi: 10.1091/mbc.E23-11-0459. Epub 2024 Apr 24. Mol Biol Cell. 2024. PMID: 38656798 Free PMC article.
-
Actin polymerization counteracts prewetting of N-WASP on supported lipid bilayers.Proc Natl Acad Sci U S A. 2024 Dec 10;121(50):e2407497121. doi: 10.1073/pnas.2407497121. Epub 2024 Dec 4. Proc Natl Acad Sci U S A. 2024. PMID: 39630867 Free PMC article.
-
Actin assembly requirements of the formin Fus1 to build the fusion focus.J Cell Sci. 2022 Jul 1;135(13):jcs260289. doi: 10.1242/jcs.260289. Epub 2022 Jul 8. J Cell Sci. 2022. PMID: 35673994 Free PMC article.
-
Proteomic and phosphoproteomic analyses reveal that TORC1 is reactivated by pheromone signaling during sexual reproduction in fission yeast.PLoS Biol. 2024 Dec 20;22(12):e3002963. doi: 10.1371/journal.pbio.3002963. eCollection 2024 Dec. PLoS Biol. 2024. PMID: 39705284 Free PMC article.
-
Long non-coding RNAs as key regulators of neurodegenerative protein aggregation.Alzheimers Dement. 2025 Feb;21(2):e14498. doi: 10.1002/alz.14498. Alzheimers Dement. 2025. PMID: 39936251 Free PMC article. Review.
References
Publication types
MeSH terms
Substances
LinkOut - more resources
Full Text Sources
Molecular Biology Databases
