. 2022 Dec;214(4):107902.
doi: 10.1016/j.jsb.2022.107902. Epub 2022 Oct 3.

How to correct relative voxel scale factors for calculations of vector-difference Fourier maps in cryo-EM

Affiliations

How to correct relative voxel scale factors for calculations of vector-difference Fourier maps in cryo-EM

Jimin Wang et al. J Struct Biol. 2022 Dec.

Abstract

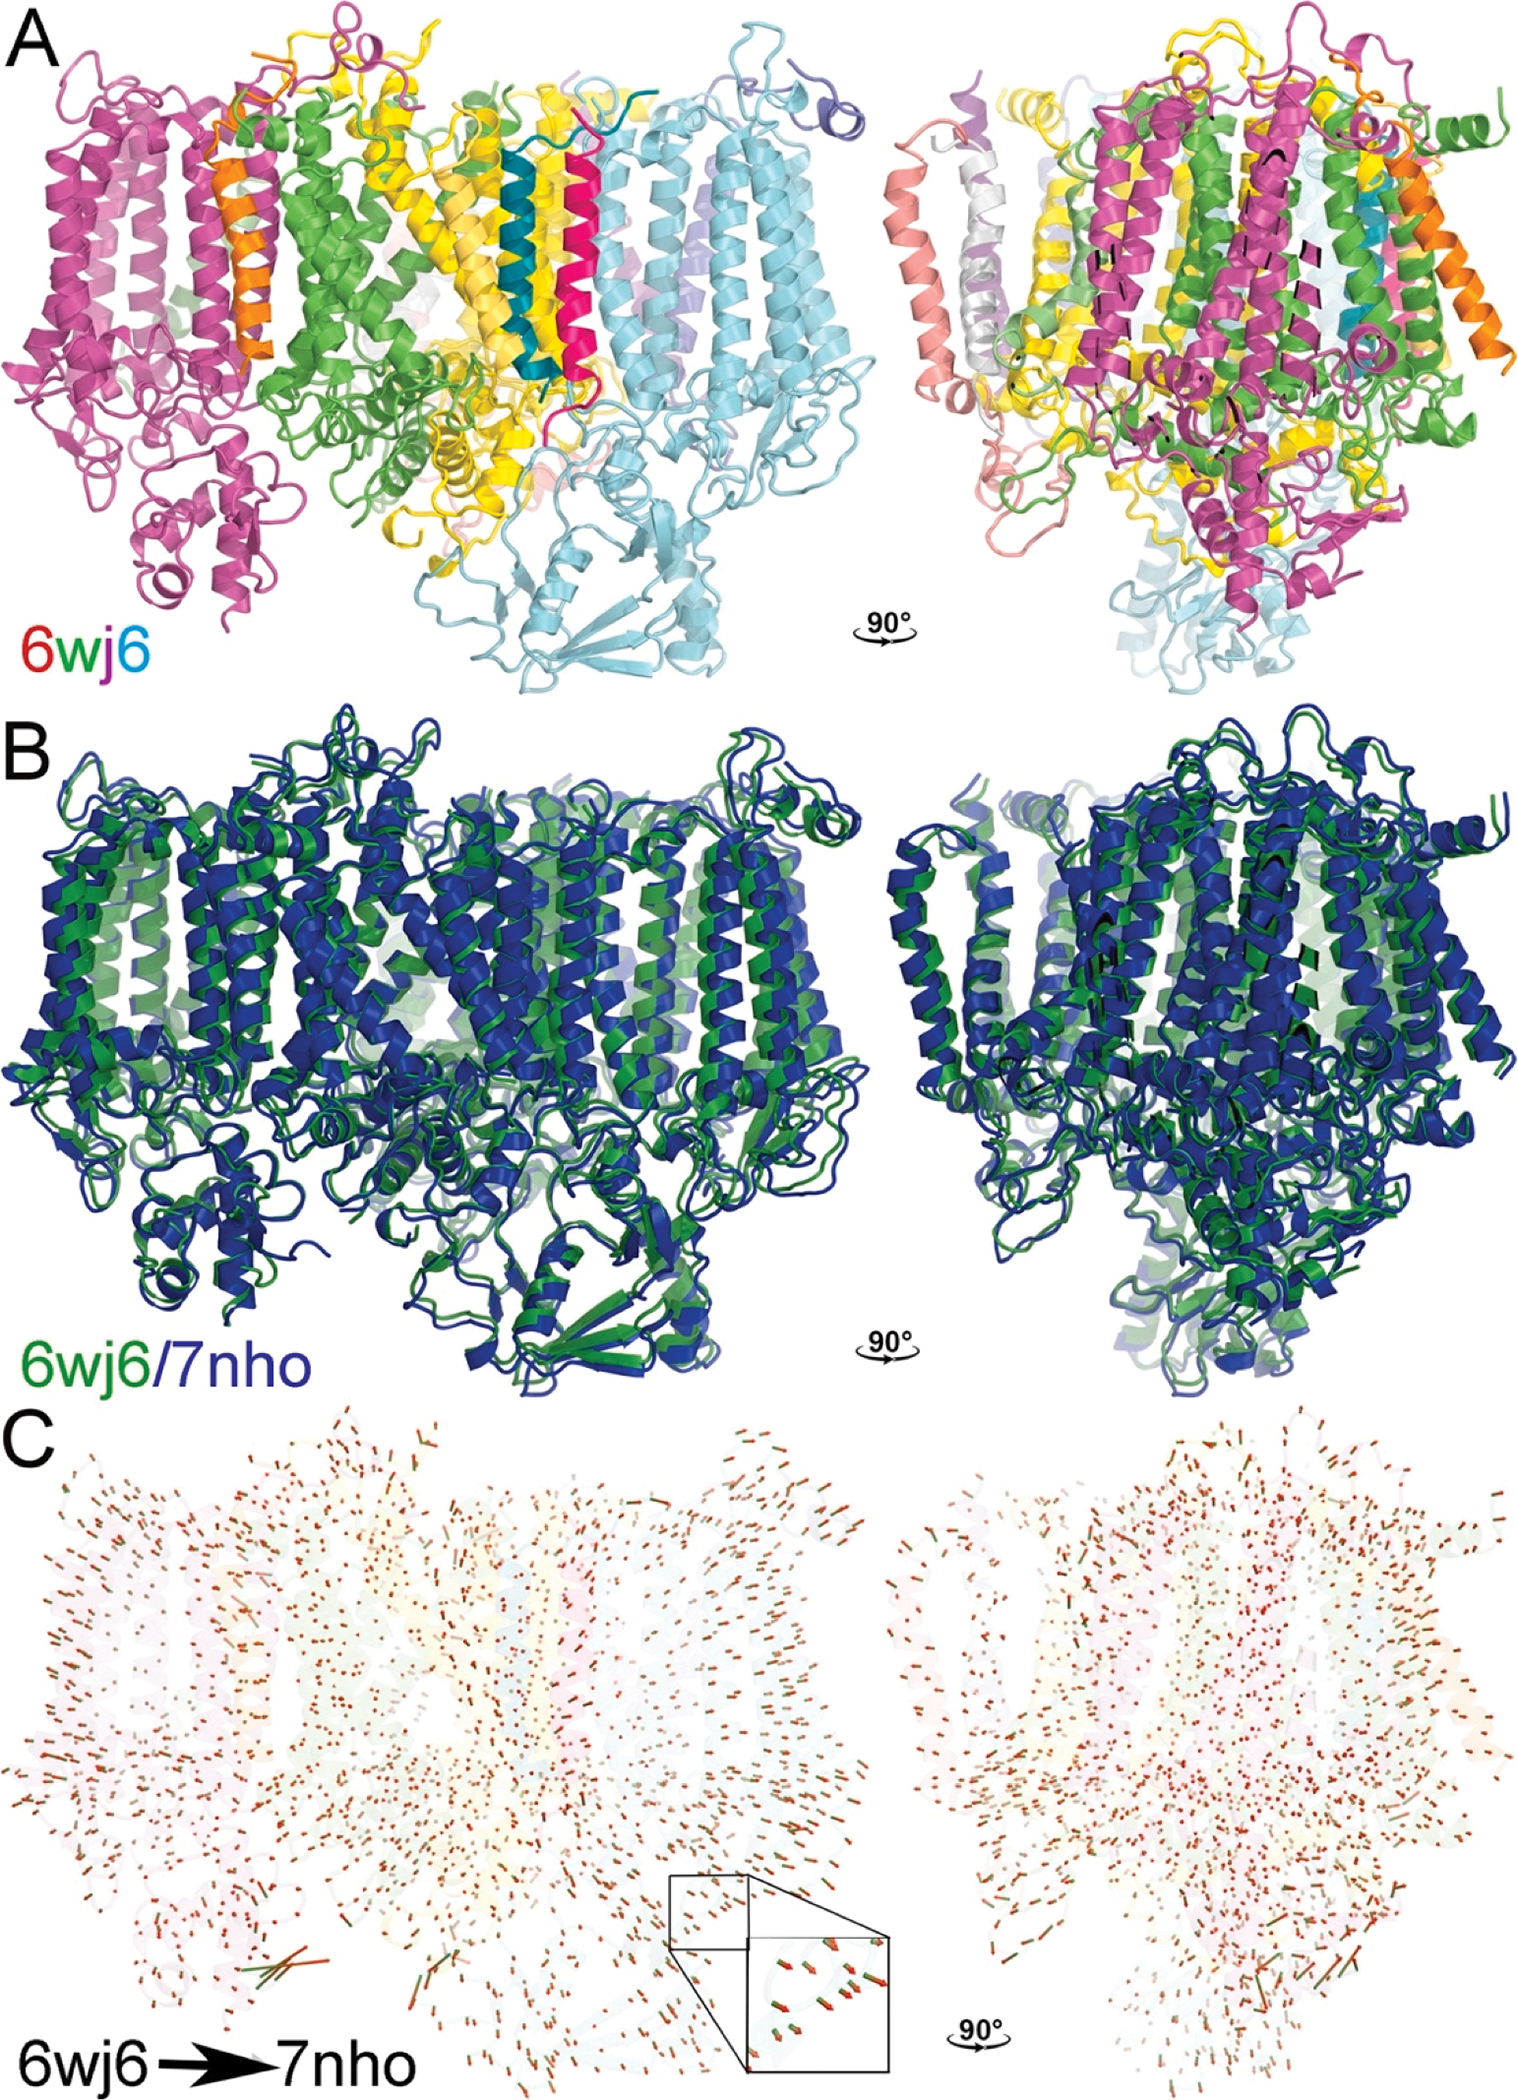
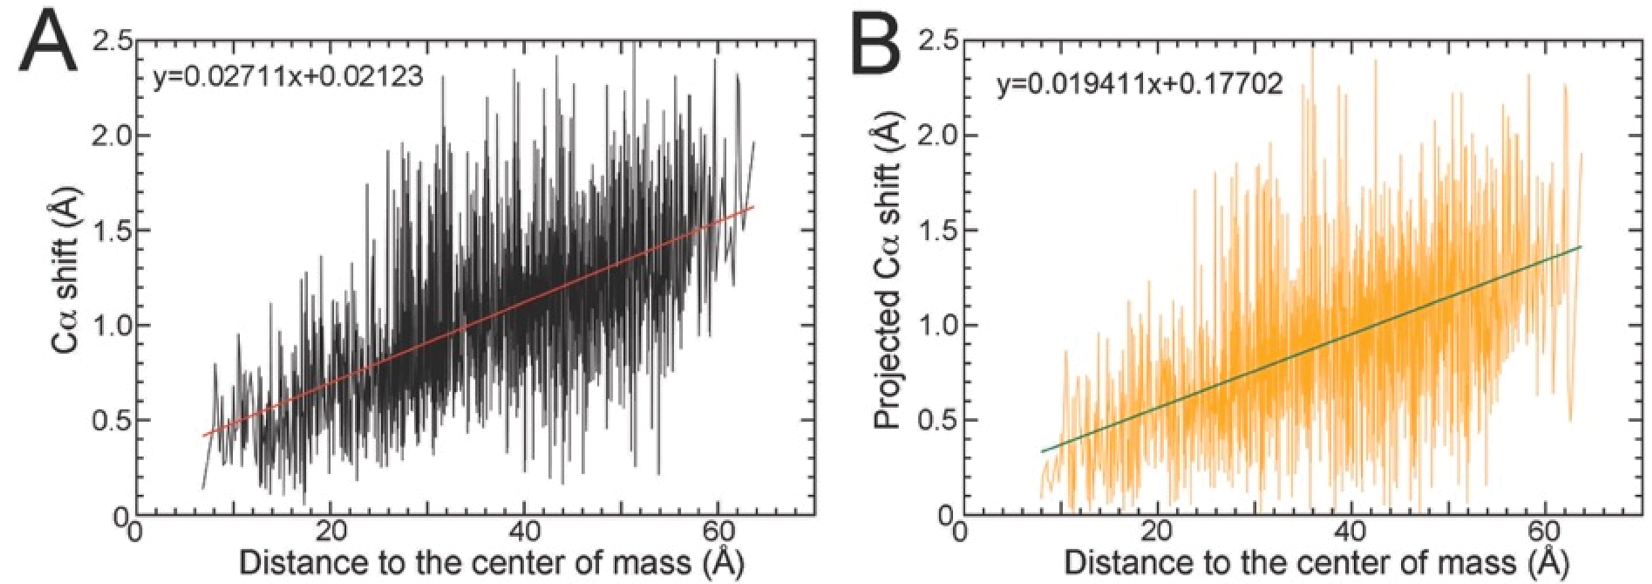
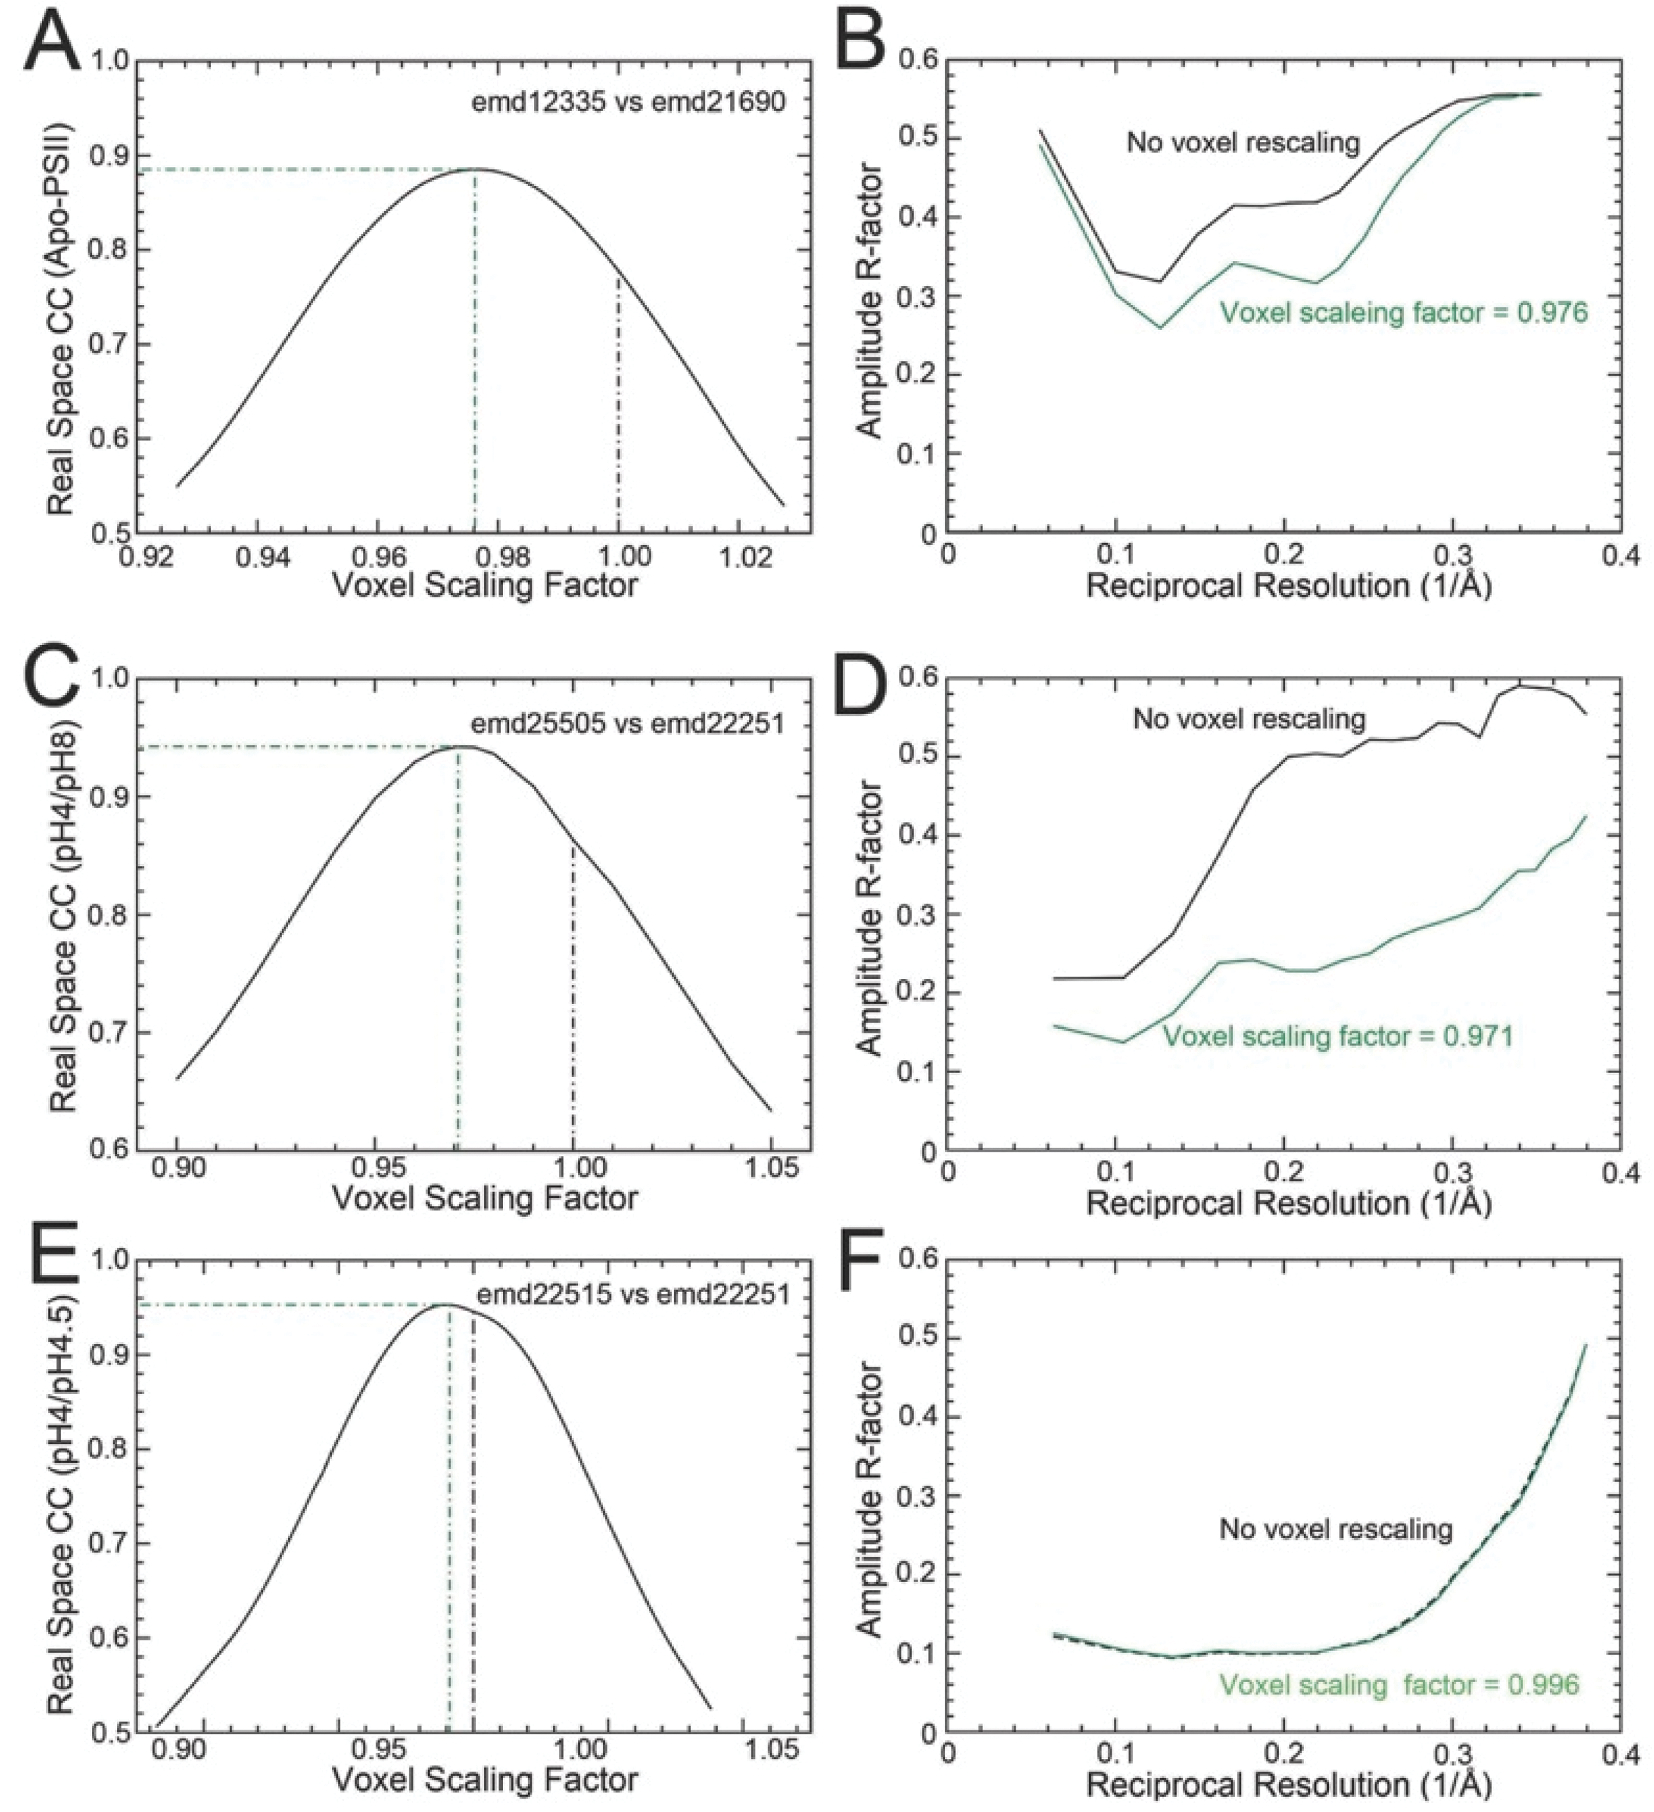
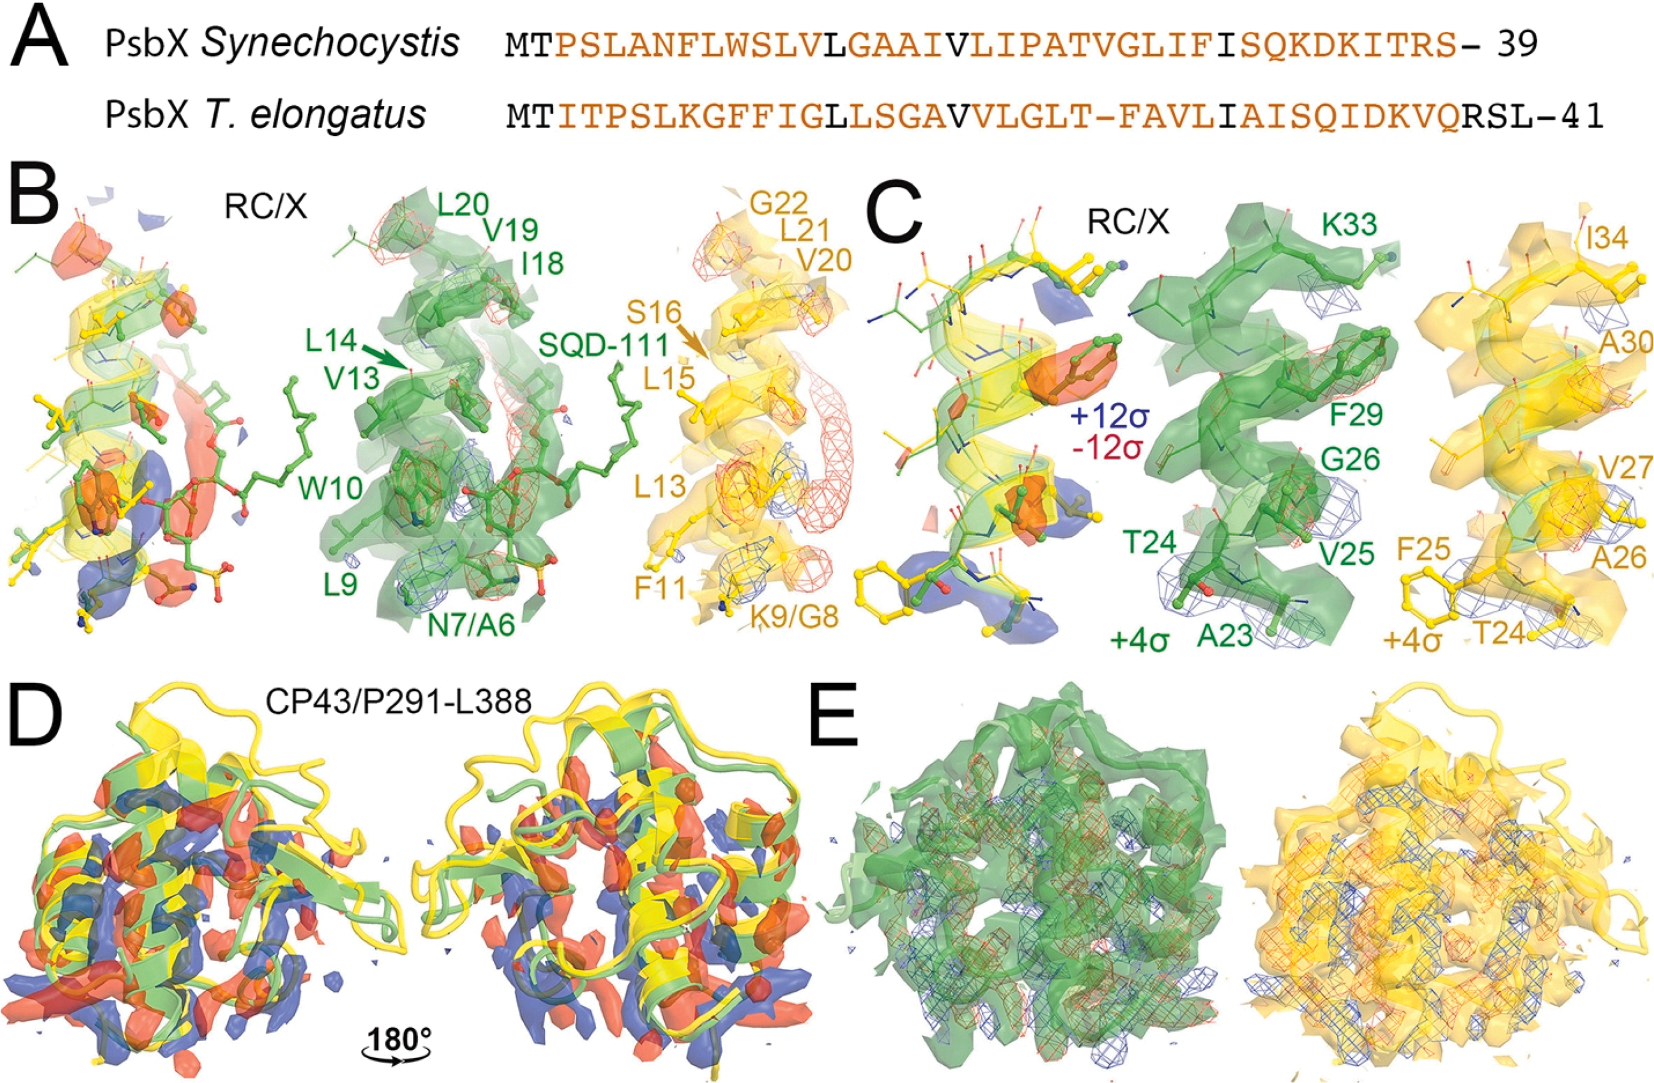
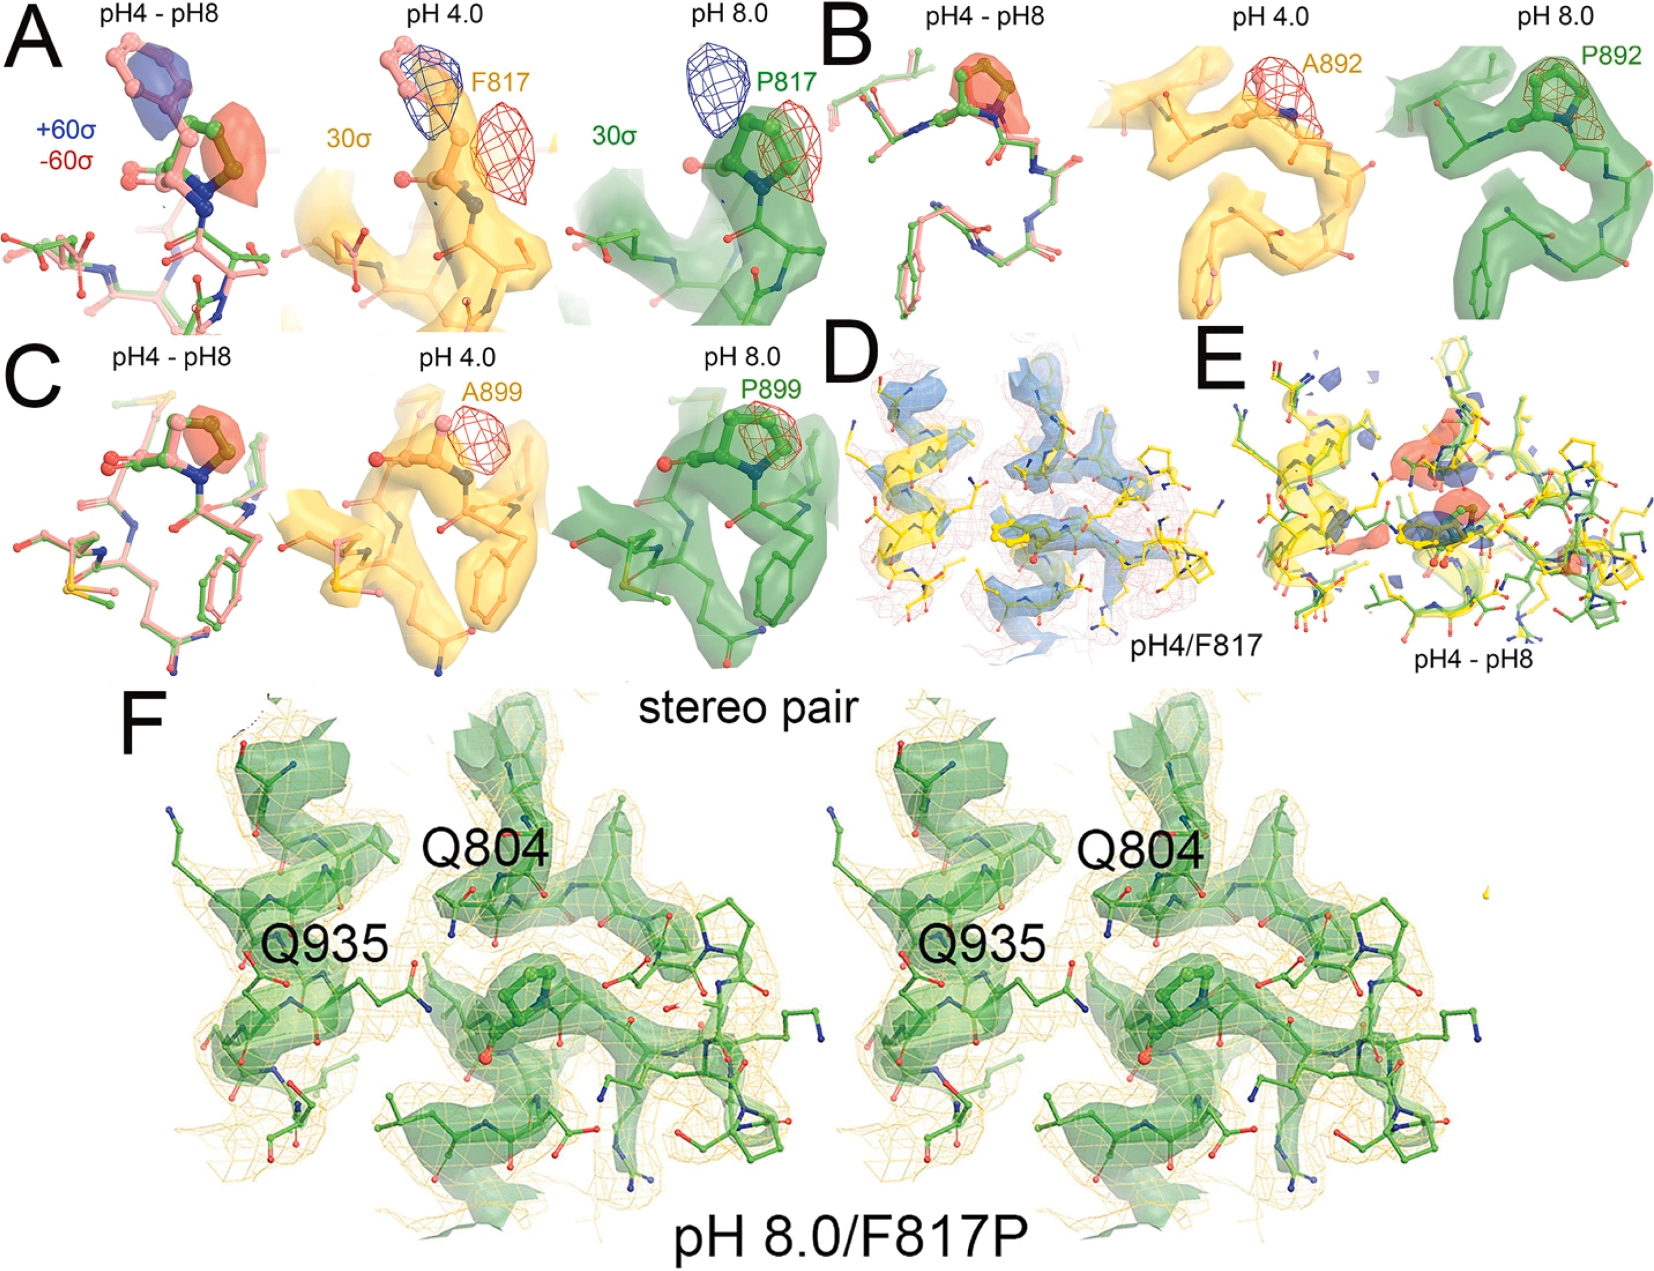
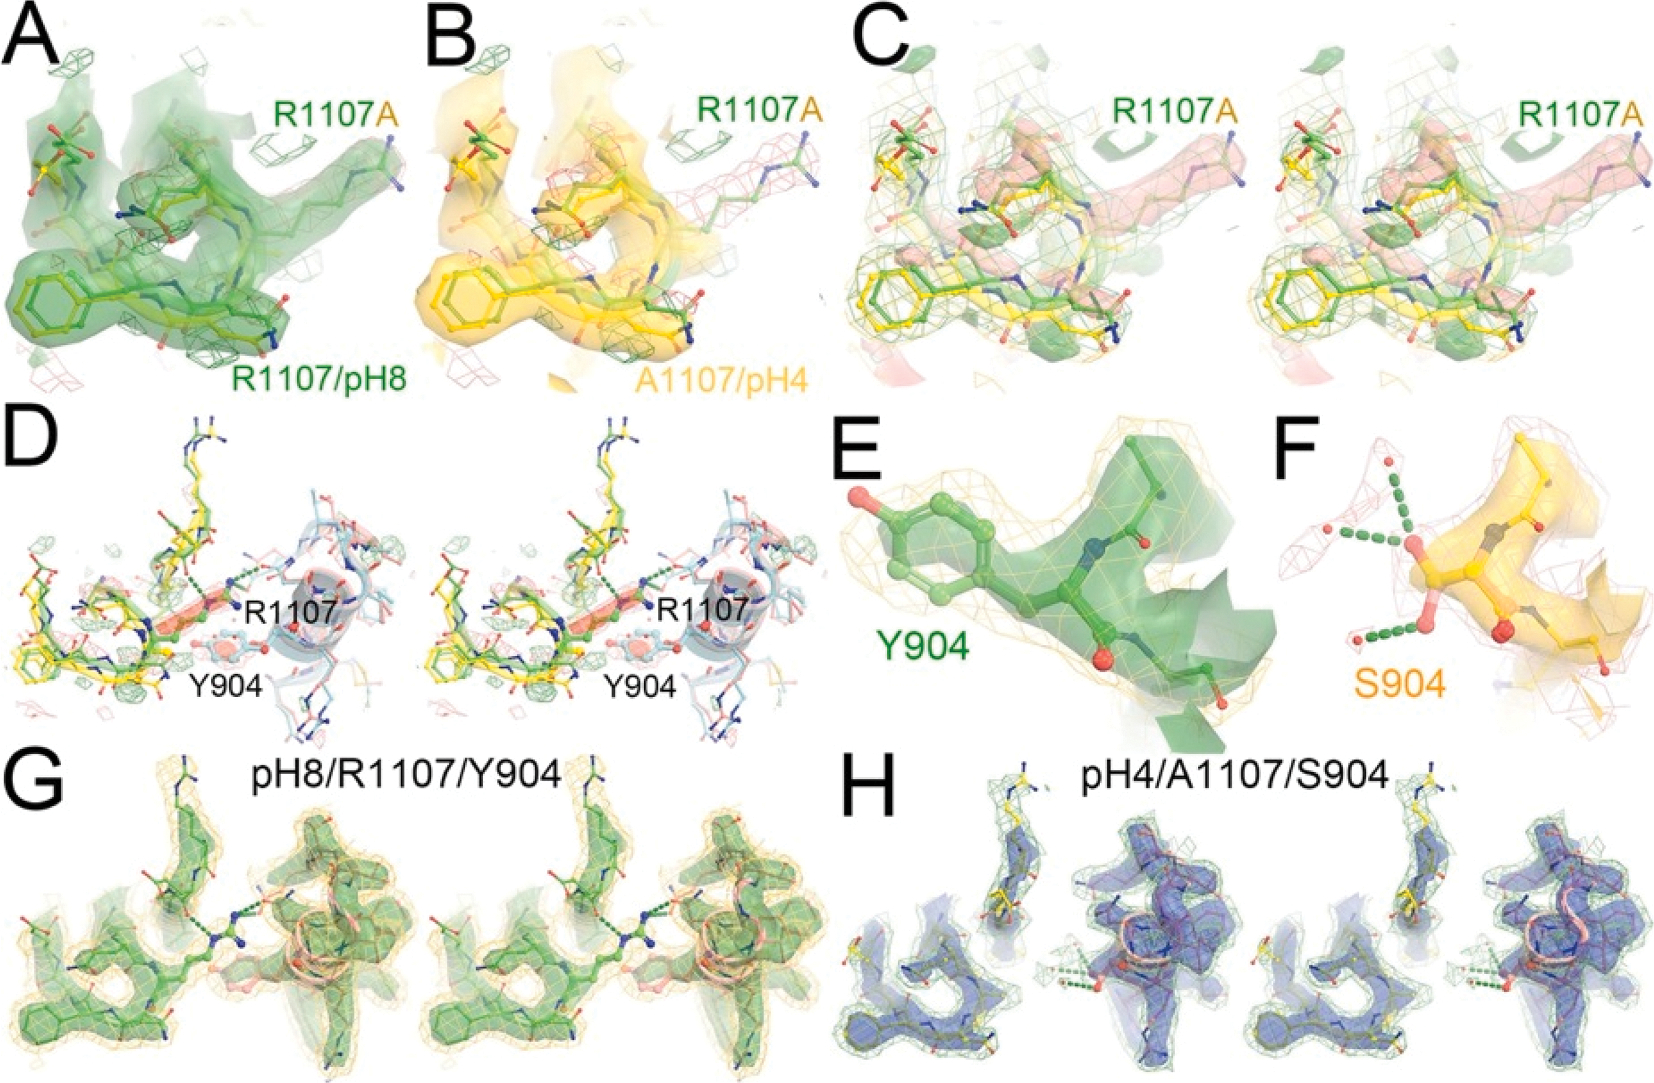
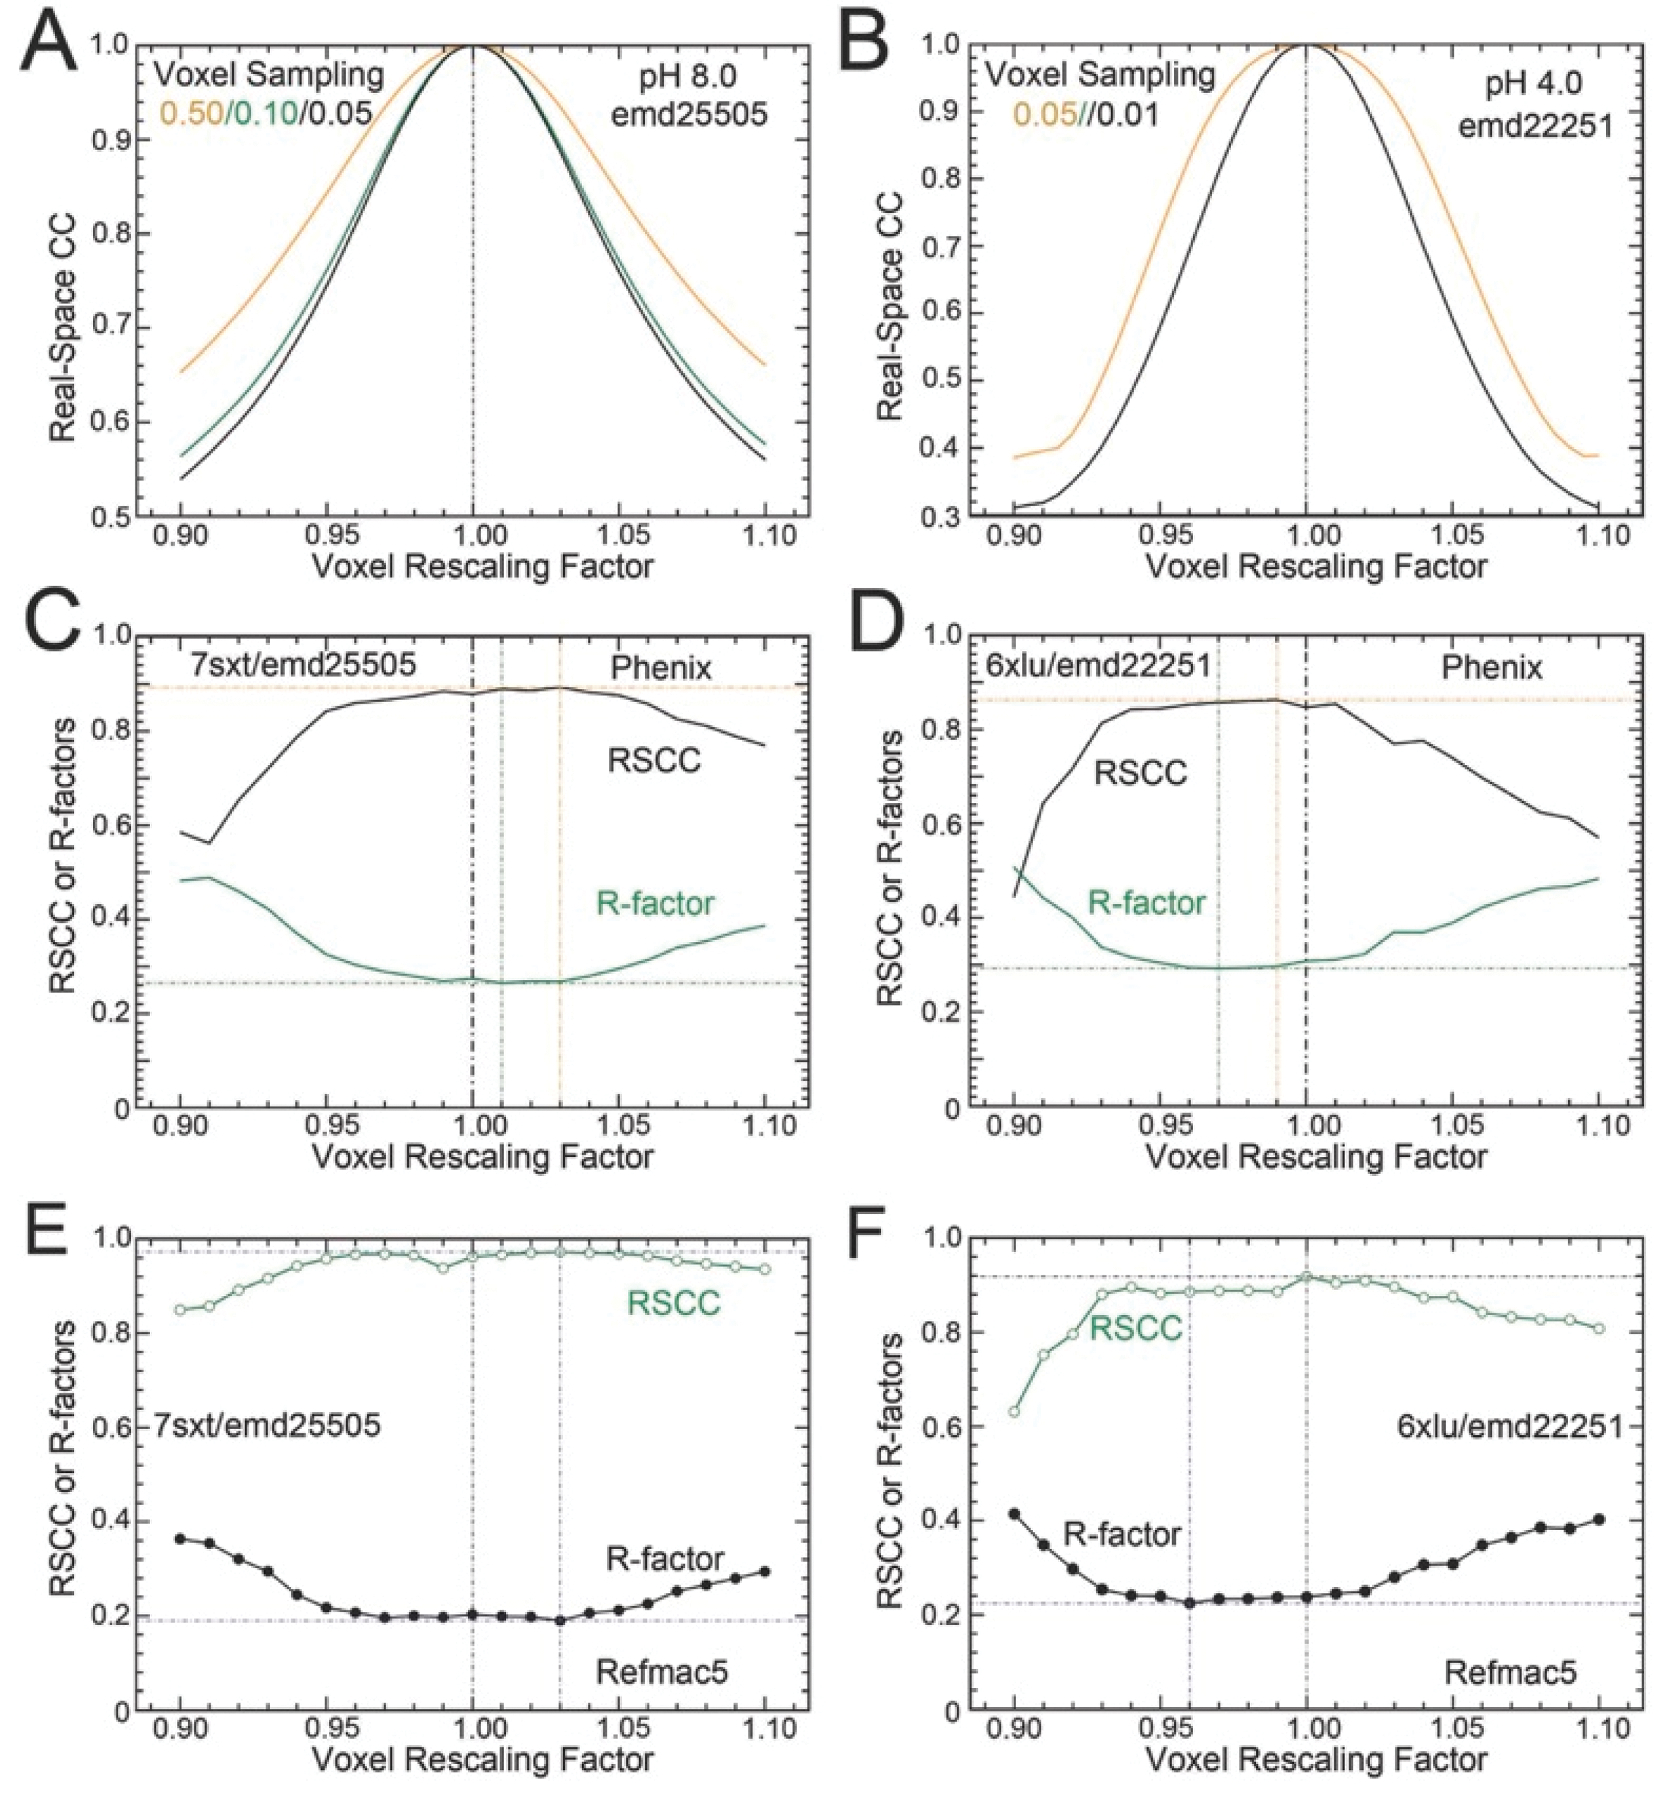
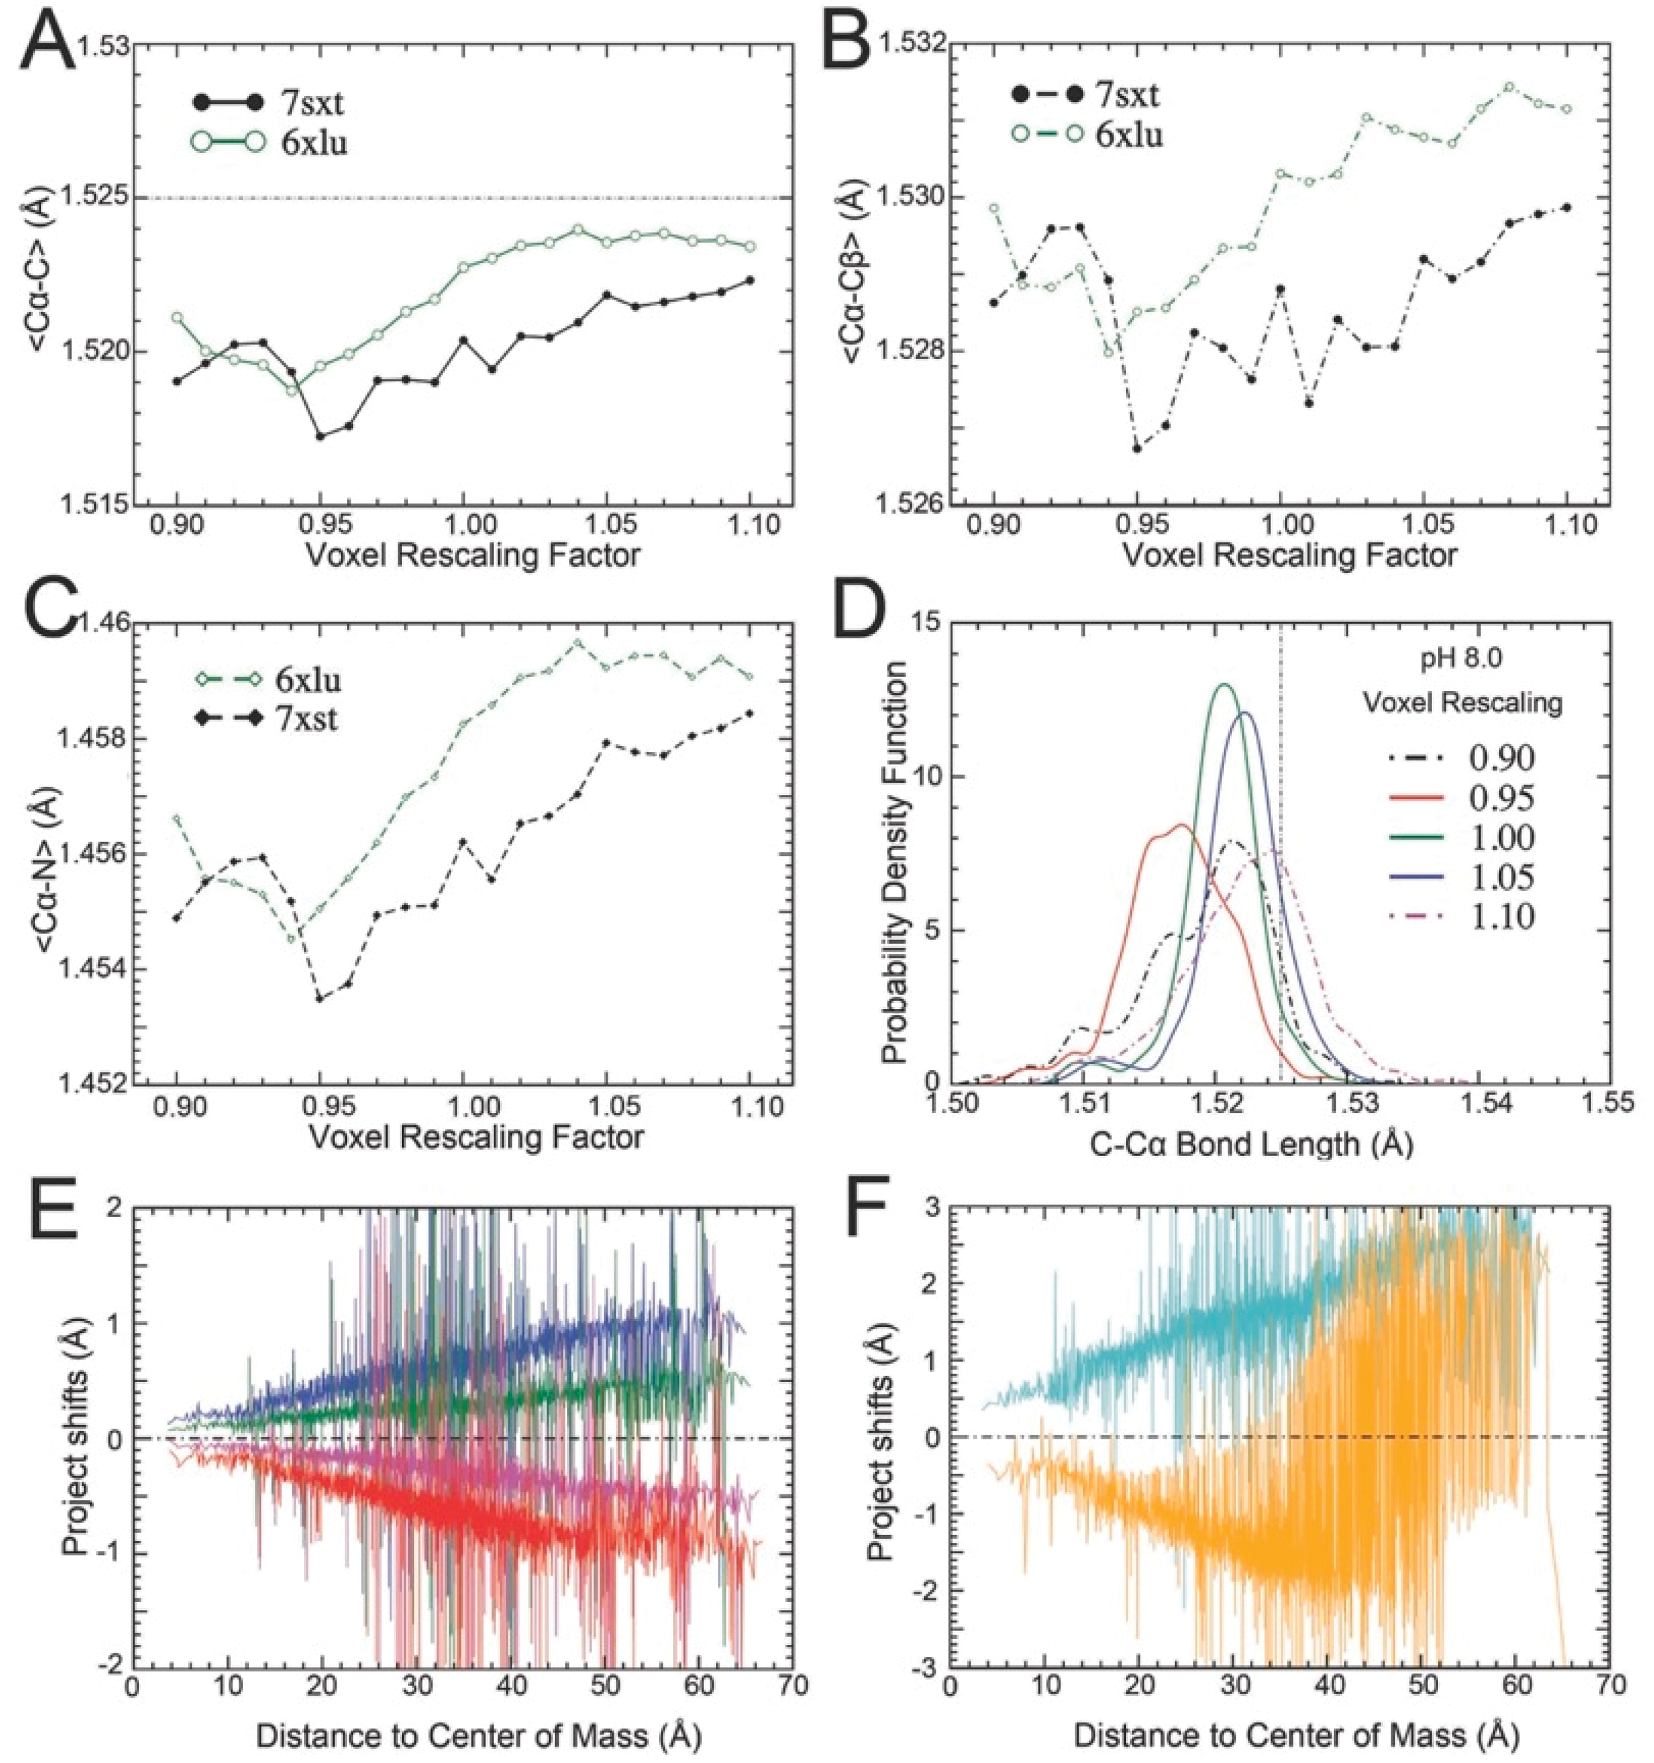
The atomic coordinates derived from cryo-electron microscopy (cryo-EM) maps can be inaccurate when the voxel scaling factors are not properly calibrated. Here, we describe a method for correcting relative voxel scaling factors between pairs of cryo-EM maps for the same or similar structures that are expanded or contracted relative to each other. We find that the correction of scaling factors reduces the amplitude differences of Fourier-inverted structure factors from voxel-rescaled maps by up to 20-30%, as shown by two cryo-EM maps of the SARS-CoV-2 spike protein measured at pH 4.0 and pH 8.0. This allows for the calculation of the difference map after properly scaling, revealing differences between the two structures for individual amino acid residues. Unexpectedly, the analysis uncovers two previously overlooked differences of amino acid residues in structures and their local structural changes. Furthermore, we demonstrate the method as applied to two cryo-EM maps of monomeric apo-photosystem II from the cyanobacteria Synechocystis sp. PCC 6803 and Thermosynechococcus elongatus. The resulting difference maps reveal many changes in the peripheral transmembrane PsbX subunit between the two species.

Keywords: Absolute EM Magnification; Center of Mass; Cryo-EM maps; Monomeric Apo-Photosystem II; SARS-CoV-2; Spike Protein; Volumetric Expansion/Contraction Coefficients; Voxel Scaling; pH-Dependent Structural Transition.


Conflict of interest statement

Declaration of Competing Interest The authors declare that they have no known competing financial interests or personal relationships that could have appeared to influence the work reported in this paper.

Figures

Fig. 1.
Fig. 1.
Comparison of two monomeric apo-PSII coordinates. (A) Two orthogonal views of the 6wj6 reference structure from Synechocystis 6803 in colors: the core subunits D1 (chain A), green, CP47 (chain B), cyan, CP43 (chain C), magenta, D2 (chain D), yellow, and PsbX (chain X), purple. (B) Superposition of the 6wj6 and 7nho structures. (C) Cα shift vectors from the Synechocystis 6803 to T. elongatus apo-PSII structures.
Fig. 2.
Fig. 2.
Correlation of Cα shift vector length with the Cα distance to the center-of-mass comparing the two apo-PSII structures. (A) The absolute length (fitted slope is 2.711%). (B) Projected Cα shifts onto the radial axes exhibit a smaller slope (fitted slope is 1.9411%).
Fig. 3.
Fig. 3.
Numerically varying correction factors for voxel scale between target and reference maps. (A, C, E) Real-space correlation coefficient (CC) after systematically varying the relative correction factors to given voxel scale. (B, D, F) Amplitude differences with and without voxel rescaling after amplitude scaling to remove resolution differences with selected resolution ranges. (A, B) The apo-PSII maps of emd12335/7nho (T. elongatus) and emd21690/6wj6 (Synechocystis 6803). (C, D) The SARS-CoV-2 spike protein maps of emd22505/7sxt and emd22251/6xlu (pH 4.0). (E, F) The SARS-CoV-2 spike protein maps of emd25515/7jwy (pH 4.5) and emd22251/6xlu (pH 4.0).
Fig. 4.
Fig. 4.
Visualization of known amino acid differences and structural differences between the Synechocystis 6803 and T. elongatus apo-PSII. (A) Sequence alignment of PsbX for the two species. (B, C) The transmembrane PsbX subunit from A6 to K33 has 16 residue differences described in this figure between the two species including an insertion/deletion involving a Pro residue in the middle (omitted in figures and as a division for panels A and B). First panels, superpositions of two structures with difference maps. Positive differences are in blue. Negative differences are in red. Middle panels, superposition of Synechocystis 6803 map with both structures, and differences in meshes. Right panels, superposition of T. elongatus map with both structures. Substituted residues are shown in large spheres and sticks. There is a lipid molecule (SQD-111) present in the Synechocystis 6803 map, but not in the T. elongatus map. (D) Two views of superposition of both models with difference maps show relative domain rotations (i.e., non-random distribution of positive and negative features). (E) Superposition of both models with each map (isosurface) and differences (isomesh). See supporting information Fig. S1 for additional stereodiagram for panels D and E.
Fig. 5.
Fig. 5.
Visualization of known amino acid substitutions in the SARS-CoV-2 spike proteins. (A-C) For F817P, A892P, and A899P substitutions. Left panels, superposition of both structures and their difference maps between pH 4 and pH 8. Middle panels, superposition of pH 4 structure with pH 4 map (isosurface) as well as difference maps (isomesh). Right panels, superposition of pH 8 structure with pH 8 map as well as difference maps. Negative differences are in red, and positive differences in blue. (D) Superposition of pH 4 structure with pH 4 map for F817. (E) Difference maps for local effects of the F817P substitution. (F) Superposition of pH 8 structure with pH 8 map for F817P in stereodiagram.
Fig. 6.
Fig. 6.
Identification of two overlooked substitutions of amino acid residues in the spike protein of a new SARS-CoV-2 variant. (A) Superposition of R1107/pH 8 structure (green) with pH 8 map (green isosurface) and the A1107/pH 4 structure (gold) with difference maps (isomesh). (B) Superposition of the A1107/pH 4 structure (gold) with pH 4 map (gold isosurface) and the R1107/pH 8 structure (green). (C) Stereodiagrams of (D and E) but with differences in isosurface and individual maps in isomesh. (D) An extended view of superposition including neighboring subunits where the Y904S substitution is identified. (E) Superposition of the Y904/pH 8 structure with the pH 8 maps at high (green isosurface) and low (gold isomesh) contour level. (F) Superposition of the S904/pH 8.0 structure with pH 4 maps at high (gold isosurface). (G) Superposition of the pH 8 structure with the pH 8 map in stereodiagram. (H) Superposition of the pH 4 structure with the pH 4 map in stereodiagram.
Fig. 7.
Fig. 7.
Artificially voxel-rescaled maps for model refinement in attempt for determination of the absolute voxel scale of cryo-EM maps using model refinement. (A, B) Pearson real-space correlation coefficients (CC) between voxel-rescaled maps and the original emd25505/7sxt map at the recommended contour level (0.10 unit), half the value, and five times the value, which alter the number of voxels used for calculation. (B) The same plot for emd22251/6xlu. (C) The CC between the voxel-rescaled maps and model-calculated maps (black) as well as model R-factors (green) after standard model refinement using Phenix. Maxima and minima are indicated, which are on the right side of unit rescaling factor. (D) The same plot for emd22251 in which maxima and minima on the left side of the unity rescaling factor after standard model refinement using Phenix. (E, F) The same as (C, D) but with model refinement using Refmac5.
Fig. 8.
Fig. 8.
Proportionality of volumetric expansion or contraction coefficients in the resulting coordinates obtained from automated model refinement against voxel-rescaled cryo-EM maps. (A) The mean Cα-C bond lengths as a function of voxel-rescaling factor for the 7sxt (green) and 6xlu (black) coordinates after standard model refinement using Phenix. The ideal Cα-C bond length of 1.525 Å is indicated in dotted line. (B) The Cα-Cβ bond length. (C) The Cα-N bond length. (D) Examples of Cα-C bond length distributions in the entire 7sxt structure for selected voxel rescaling factors of 0.90 and 1.00 in dashed curves and 0.95, 1.00, 1.05 in sold curves. (E) Projected Cα shifts as a function of the Cα distance to the center of the mass for voxel-rescaling factors of 1.01 (green), 1.02 (blue), 0.99 (magenta) and 0.98 (red) relative to the unit. (F) Those of voxel-rescaling factors 1.05 (cyan) and 0.95 (gold) relative to the unit.
Fig. 9.
Fig. 9.
Volumetric expansion/contraction in atomic coordinates of the translocating pair of the RTC complexes of SARS-CoV-2. (A) Stereodiagram showing the Cα shift vectors from the 6xez to 7bv2 structures. (B) Total vector lengths (black) and projected vector lengths (red) as a function of distance to the center-of-mass of the complexes.
Fig. 10.
Fig. 10.
The DFT derived-ED maps and difference maps. (A) The DFT-derived ED maps for the cyanide bound to the heme molecule contoured at 2.5σ (isomesh) and 5.0σ (isosurface). (B) For the apo heme. (C-G) Isomorphous difference Fourier maps between the two structures at 1.0, 2.0, 3.0, 4.0, and 5.0 Å resolution, respectively. The maps are contoured at ± 2.5σ (green/red isomesh), and ± 5.0σ (green/red isosurface). (H) Real-space difference maps without removing resolution difference (at 2.0 and 5.0 Å resolution).

Similar articles

Cited by

References

    1. Adams PD, et al., 2010. PHENIX: a comprehensive Python-based system for macromolecular structure solution. Acta Crystallogr. D Biol. Crystallogr 66, 213–221. - PMC - PubMed
    1. Bao H, Burnap RL, 2016. Photoactivation: The Light-Driven Assembly of the Water Oxidation Complex of Photosystem II. Front. Plant Sci. 7, 578. - PMC - PubMed
    1. Becke AD, 1988. Density-functional exchange-energy approximation with correct asymptotic behavior. Phys Rev A Gen Phys 38, 3098–3100. - PubMed
    1. Chen J, et al., 2020. Structural Basis for Helicase-Polymerase Coupling in the SARS-CoV-2 Replication-Transcription Complex. Cell 182, 1560–1573 e1513. - PMC - PubMed
    1. Collins MD, Kim CU, Gruner SM, 2011. High-pressure protein crystallography and NMR to explore protein conformations. Annu. Rev. Biophys. 40, 81–98. - PubMed

Publication types

Substances