

Sensor-based evaluation of a Urine Trap toilet in a shared bathroom
- PMID: 36202366
- PMCID: PMC9742848
- DOI: 10.1016/j.scitotenv.2022.159178
Sensor-based evaluation of a Urine Trap toilet in a shared bathroom
Abstract
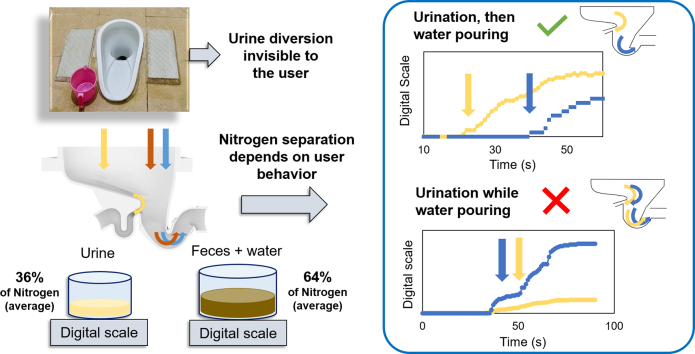
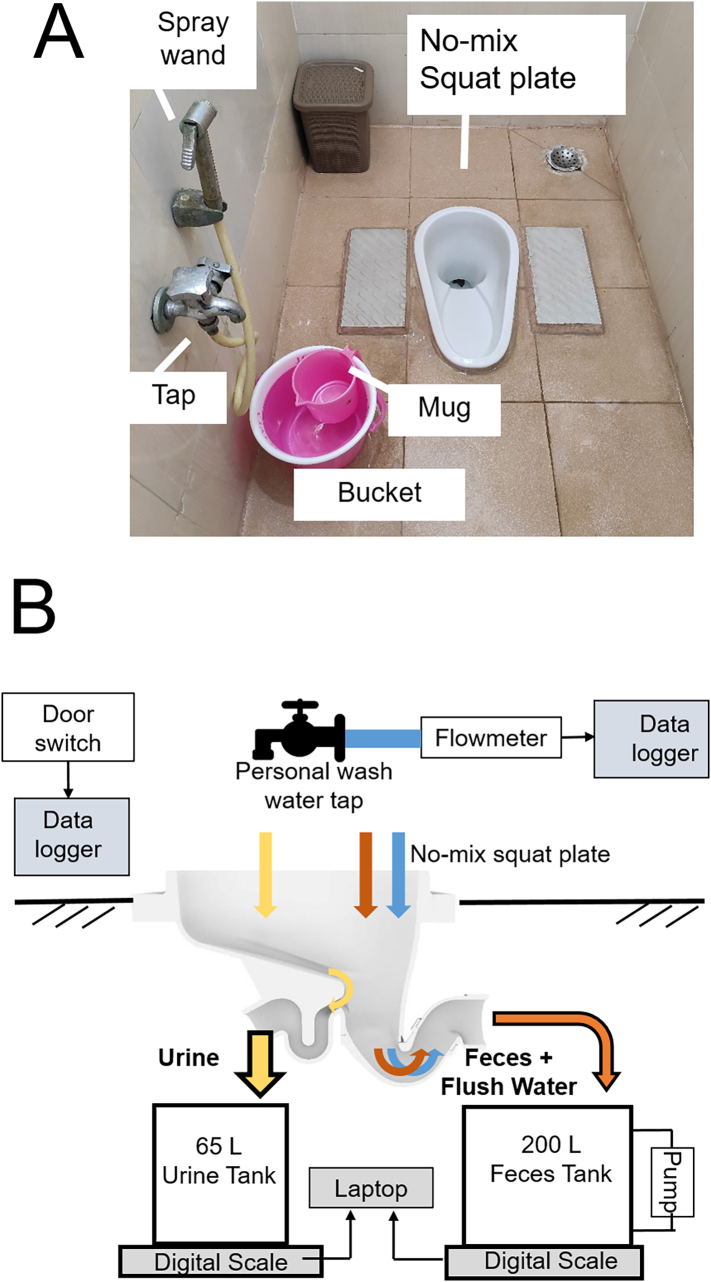
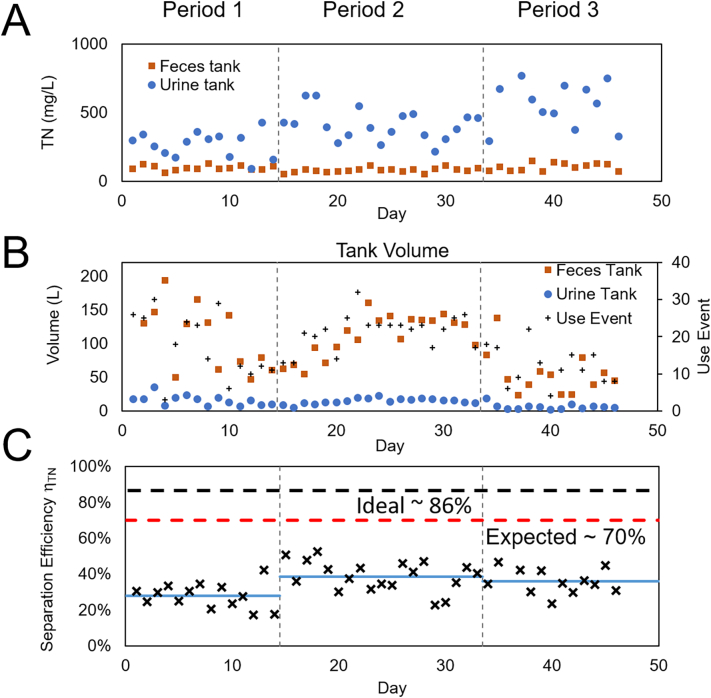
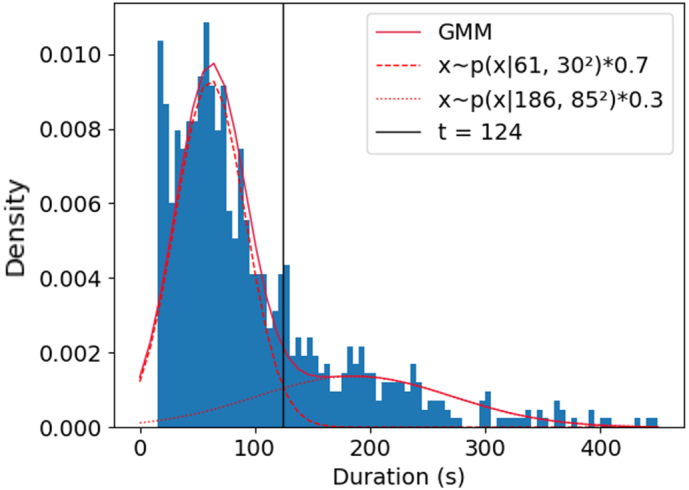
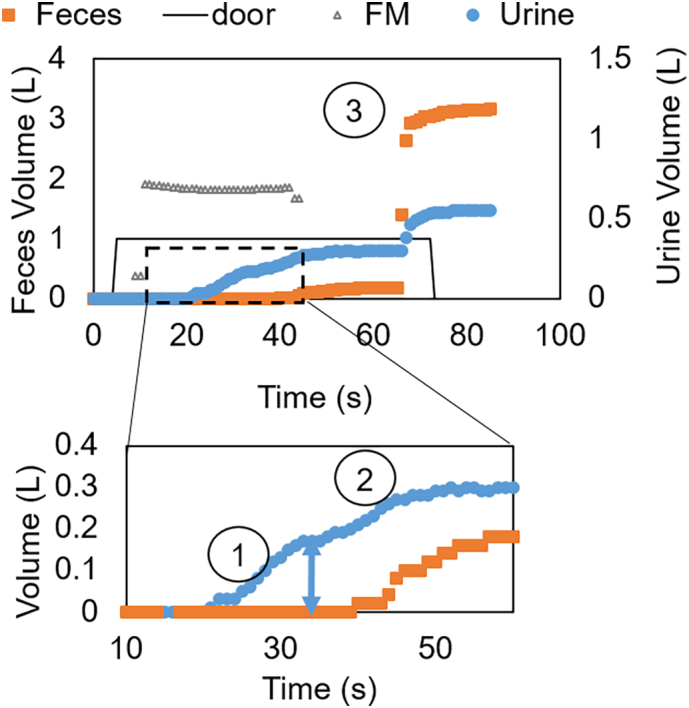
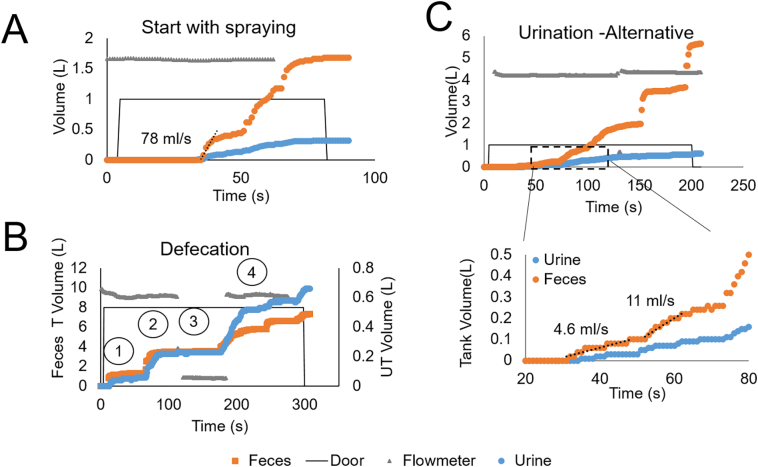
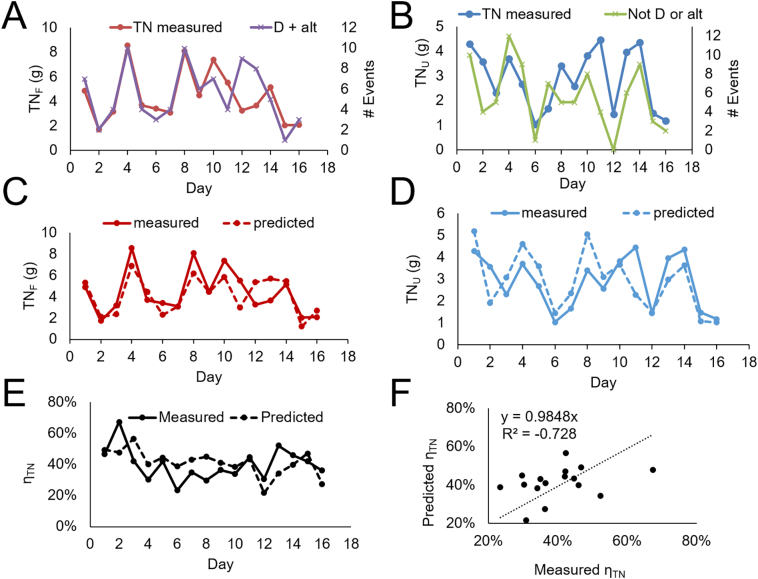
Urine diversion in a No-Mix Toilet is a promising approach for sustainable fertilizers and reduction of the nutrient load for wastewater treatment; however, user adoption remains a challenge. This study evaluates the Urine Trap, a passive No-Mix toilet design based on the teapot effect, wherein the urine stream inlet is invisible to the user and therefore it does not impact the user experience for increased adoption. This study evaluated the nutrient separation performance of a Urine Trap flush toilet in a bathroom shared by women in two sites in India. Over three different testing periods, 841 uses of this squat plate were recorded in 50 days. Analytical measurements found 36 % separation efficiency for total nitrogen (TN). While effective, the Urine Trap under test by users did not yield a 70-80 % TN separation efficiency observed under engineering characterization. High temporal resolution data from sensors on waste collection tanks, the opening of the bathroom door, and cleansing water flow were used to gain insights into hygiene practices. The data showed a frequent habit of wetting the squat plate during physiological excretion, a hygienic practice that eases cleaning but degrades the teapot separation effect of the Urine Trap design. By using sensors, we demonstrate a method to non-invasively gain quantitative insights into hygiene practices to inform sanitation technologies deployment strategies for improved outcomes.
Keywords: Nitrogen pollution; Source-separation toilet; Time series analysis; Urine diversion; User testing.
Copyright © 2022 The Authors. Published by Elsevier B.V. All rights reserved.
Conflict of interest statement
Declaration of competing interest The authors declare the following financial interests/personal relationships which may be considered as potential competing interests: HG and LK were employees of EOOS a company assigned a patent on the Urine Trap technology and pursuing its commercialization.
Figures
References
-
- Gounden T., Pfaff B., Macleod N., Buckley C. 32nd WEDC International Conference. Colombo, Sri Lanka. 2006. Provision of free sustainable basic sanitation: the Durban experience.https://wedc-knowledge.lboro.ac.uk/resources/conference/32/Gounden.pdf
-
- Gundlach J., Bryla M., Larsen T.A., Kristoferitsch L., Gründl H., Holzner M. Novel NoMix toilet concept for efficient separation of urine and feces and its design optimization using computational fluid mechanics. J. Build. Eng. 2021;33
MeSH terms
Substances
Grants and funding
LinkOut - more resources
Full Text Sources
