. 2022 Oct 7;7(1):347.
doi: 10.1038/s41392-022-01167-9.

Deciphering transcriptome alterations in bone marrow hematopoiesis at single-cell resolution in immune thrombocytopenia

Affiliations

Deciphering transcriptome alterations in bone marrow hematopoiesis at single-cell resolution in immune thrombocytopenia

Yan Liu et al. Signal Transduct Target Ther. .

Abstract

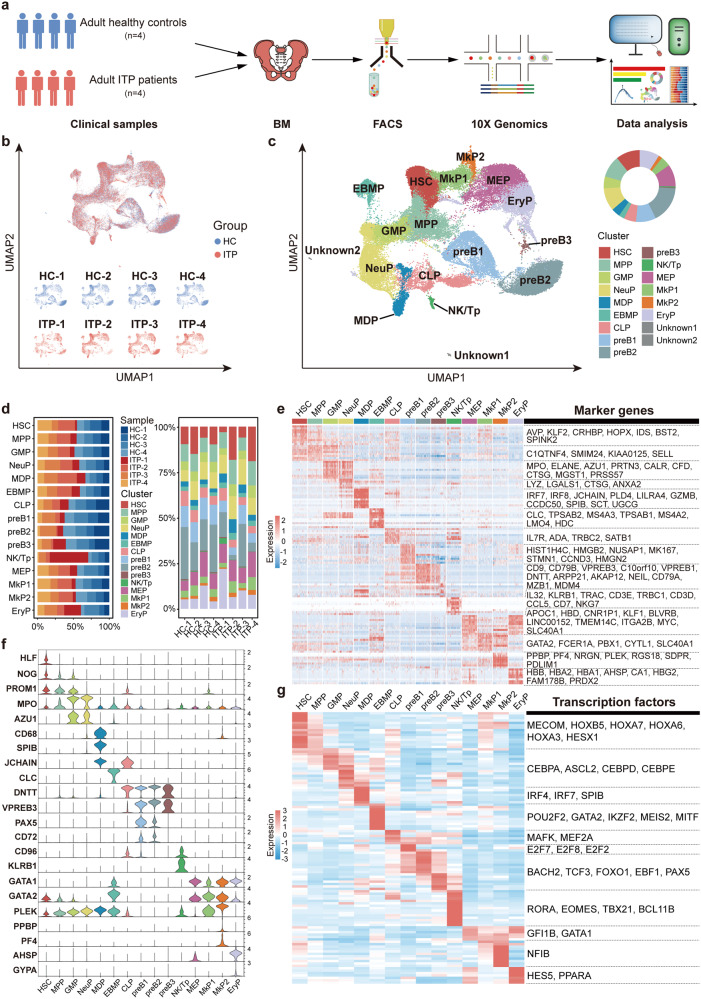
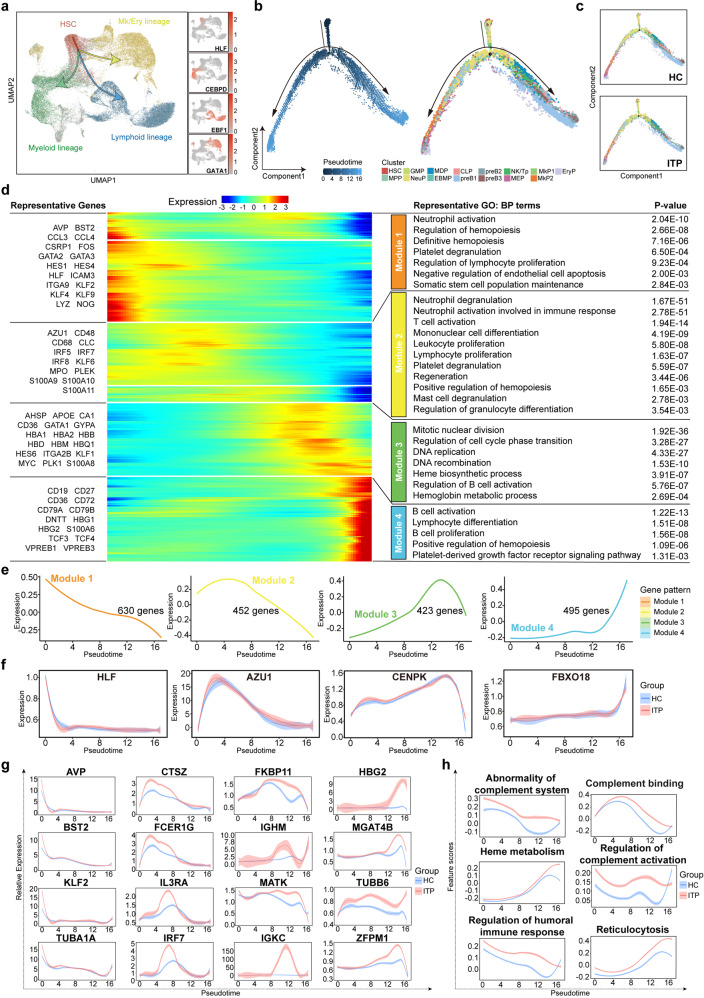
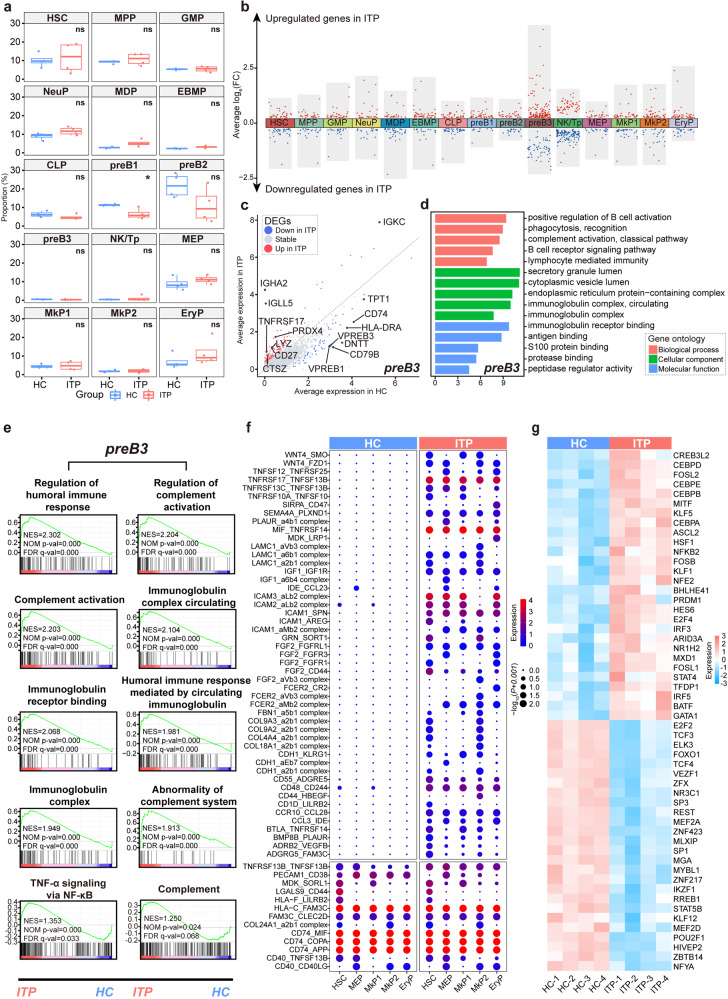
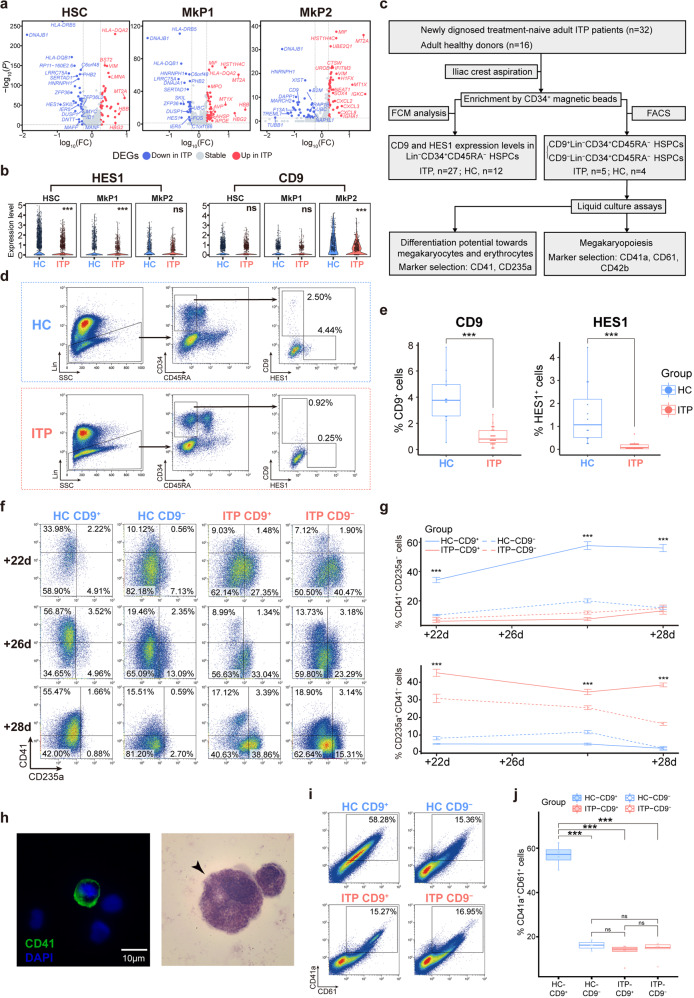
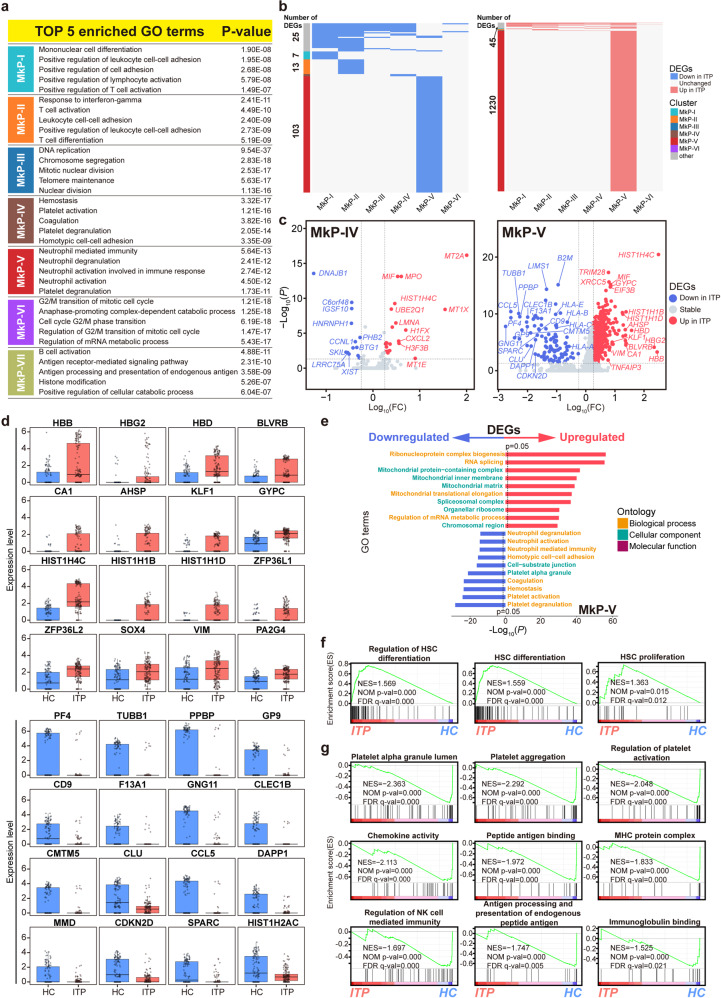
Immune thrombocytopenia (ITP) is an autoimmune disorder, in which megakaryocyte dysfunction caused by an autoimmune reaction can lead to thrombocytopenia, although the underlying mechanisms remain unclear. Here, we performed single-cell transcriptome profiling of bone marrow CD34+ hematopoietic stem and progenitor cells (HSPCs) to determine defects in megakaryopoiesis in ITP. Gene expression, cell-cell interactions, and transcriptional regulatory networks varied in HSPCs of ITP, particularly in immune cell progenitors. Differentially expressed gene (DEG) analysis indicated that there was an impaired megakaryopoiesis of ITP. Flow cytometry confirmed that the number of CD9+ and HES1+ cells from Lin-CD34+CD45RA- HSPCs decreased in ITP. Liquid culture assays demonstrated that CD9+Lin-CD34+CD45RA- HSPCs tended to differentiate into megakaryocytes; however, this tendency was not observed in ITP patients and more erythrocytes were produced. The percentage of megakaryocytes differentiated from CD9+Lin-CD34+CD45RA- HSPCs was 3-fold higher than that of the CD9- counterparts from healthy controls (HCs), whereas, in ITP patients, the percentage decreased to only 1/4th of that in the HCs and was comparable to that from the CD9- HSPCs. Additionally, when co-cultured with pre-B cells from ITP patients, the differentiation of CD9+Lin-CD34+CD45RA- HSPCs toward the megakaryopoietic lineage was impaired. Further analysis revealed that megakaryocytic progenitors (MkP) can be divided into seven subclusters with different gene expression patterns and functions. The ITP-associated DEGs were MkP subtype-specific, with most DEGs concentrated in the subcluster possessing dual functions of immunomodulation and platelet generation. This study comprehensively dissects defective hematopoiesis and provides novel insights regarding the pathogenesis of ITP.


Conflict of interest statement

The authors declare no competing interests.

Figures

Fig. 1
Fig. 1
Identifying HSPCs in ITP and HC bone marrows. a Schematic overview. Related to Figs. 1, 2, 4, 8, and 9. b UMAP plot showing cell contribution by samples. c Cell clusters were visualized using UMAP. Colors indicate cell types. Each dot represents one cell. HSC hematopoietic stem cells, MPP multipotent progenitors, GMP granulocyte and monocyte progenitors, NeuP neutrophil progenitors, MDP monocyte-dendritic-cell progenitors, EBMP eosinophil-basophil-mast-cell progenitors, CLP common lymphoid progenitors, pre-B pre-B cells, NK/Tp natural killer/T-cell progenitors, MEP megakaryocyte-erythroid progenitors, MkP megakaryocytic progenitors, EryP erythroid progenitors. Two unknown clusters could not be identified. Both were irrelevant to this study and were not analyzed later. d Stacked barplots show the percentage of sample contributions per annotated cell type (left) and the percentage of annotated cell type contributions per sample (right). e Heat map showing the scaled expression of top 10 marker genes in each cell cluster. Vital marker genes are highlighted on the right. f Violin plots showing the expression of specific marker genes in each cell cluster. Colors represent the cell clusters indicated in c. g Top 10 differentially expressed transcription factors (TFs) in each cell cluster. The vital TFs related to differentiation are listed on the right
Fig. 2
Fig. 2
Analysis of HSPC transition states in ITP and HC samples. a UMAP plots displaying the expression of known marker genes (HLF, EBF1, CEBPD, and GATA1) during hematopoietic development. Arrows indicate the main directions of differentiation, inferred from the analysis of typical marker genes. b Pseudotime-ordered analysis of HSPCs from the ITP and HC samples. Colors represent the cell clusters indicated in Fig. 1c. c 2D graph of the pseudotime-ordered HSPCs from HC (top) and ITP (bottom) samples. d Heat map showing dynamic changes in gene expression along the pseudotime (cataloged hierarchically into four gene modules). Adjusted p value < 0.05 was considered statistically significant for Gene Ontology (GO) enrichment analysis. e Loess-smoothed curves fitted to the z scored averaged expression of genes in modules 1–4 along the pseudotime trajectory. f Dynamic expression of representative genes in each module along the pseudotime trajectory. g Two-dimensional plots showing the dynamic expression of significantly enhanced genes in ITP compared with HC along the pseudotime. A log-transformed fold change value greater than 0.25, the minimum percentage >0.25, and adjusted p value < 0.05 were used to define significantly upregulated genes. h Two-dimensional plots showing the dynamic expression of scores for abnormality of complement system, complement binding, heme metabolism, regulation of complement activation, regulation of humoral immune response, and reticulocytosis along with the pseudotime in ITP (red) and HC (blue) groups. The values of the y axis are the calculated GSVA scores. Pathways are selected from the GSEA enrichment results in ITP (NES > 1, NOM p val < 0.05, and FDR q val < 0.25)
Fig. 3
Fig. 3
Transition state analysis of Mk/Ery lineages in ITP and HC samples. a Pseudotime-ordered analysis of HSC, MPP, MEP, MkP1, MkP2, and EryP populations from all ITP and HC samples. 2D graph of each cluster from HC (top) and ITP (bottom) samples are shown. b BEAM heat map depicting the expression of the branch-dependent genes over pseudotime. Genes are clustered to four modules based on expression patterns across pseudotime. The branch point shown in the middle of heat map is the beginning of pseudotime. Both sides of heat map are the ends of pseudotime. Color bar indicates the relative expression level. Directon1 matches the upper branch and Directon2 matches the lower branch as shown in Fig. 3a. c Representative GO: BP terms of each module. Adjusted p value < 0.05 was considered statistically significant for GO enrichment analysis. d Two-dimensional plots showing the dynamic expression of significantly enhanced genes in ITP along the pseudotime. e Two-dimensional plots showing the dynamic expression of scores for abnormality of complement system, complement activation, humoral immune response, humoral immune response mediated by circulating immunoglobulin, regulation of complement activation, and regulation of humoral immune response along with the pseudotime in ITP (red) and HC (blue) groups. The values of the y axis are the calculated GSVA scores. Pathways are selected from the GSEA enrichment results in ITP (NES > 1, NOM p val < 0.05, and FDR q val < 0.25)
Fig. 4
Fig. 4
Cluster-associated alterations in HSPCs of ITP patients. a Boxplot showing the fraction of each HSPC cluster in ITP (blue) and HC (red) samples. The p values were calculated using two-tailed Student’s t test; *p < 0.05. b Differential gene expression (DGE) analysis showing up- (red) and down- (blue) regulated genes in ITP across the 15 HSPC clusters. A log-transformed fold change absolute value greater than 0.25, the minimum percentage >0.25, and adjusted p value <0.05 were used to define significantly differential expression genes (DEGs) in each cluster. c Correlation between ITP and HC transcriptomes in preB3. Each axis represents the mean expression level in the HSPC subset and each point represent a single gene. Red points represent significantly upregulated genes in ITP, blue points represent significantly downregulated genes in ITP, and gray points represent non-DEGs. A log-transformed fold change absolute value >0.25, the minimum percentage >0.25, and adjusted p value < 0.05 were used to define significance. d Representative GO: BP terms were relatively enriched in preB3 from ITP versus HC. e GSEA plots showing pathways enriched in preB3 from ITP versus HC. NES normalized enrichment score, FDR false discovery rate. f Bubble heat map of ligand-receptor interactions between preB3 and Mk/Ery-lineage cells. Interaction pairs with ITP (p < 0.05) were selected. ITP and HC are presented separately. Dot size indicates logarithmic transformed p values (permutation test). Color indicates the scaled mean expression levels of ligand and receptor molecules in the corresponding cell subpopulations. The upper panels represent interaction pairs specifically in ITP (p ≥ 0.05 in HC). The lower panel represents interaction pairs specific for both ITP and HC (p < 0.05 in HC). See also Supplemental Fig. 10. g Heat map of the area under the curve (AUC) scores of TF motifs estimated per sample in preB3 using SCENIC. A log-transformed fold change value >0.25, and adjusted p value < 0.05 were used to define significantly differential expression TFs. Significant TF motifs shared by at least two ITP samples would be selected for visualization. See also Supplemental Fig. 11
Fig. 5
Fig. 5
Further investigation of HES1 and CD9 in BM. a Volcano plots highlighting significant differences in gene expression between ITP and HC in HSC (left), MkP1 (middle), and MkP2 (right). Red points represent significantly upregulated genes, blue points represent significantly downregulated genes, and gray points represent non-DEGs. Genes with an adjusted p value < 0.05, log-transformed fold change absolute value >0.25, and minimum percentage >0.25 were considered as differentially expressed genes. b Violin plot representing the expression levels of HES1 and CD9 in HSC, MkP1, and MkP2. ***adjusted p value < 0.001. ns, not significant. c Flowchart. Related to Fig. 5d–j. d Expression of HES1 and CD9 in LinCD34+CD45RA HSPCs of ITP and HC samples. e Box plots showing the proportion of CD9 (left) and HES1 (right) in LinCD34+ CD45RA HSPCs of ITP (n = 27) and HC (n = 12) samples. ***p <0.001 by two-tailed Student’s t test. f Expression of CD41 and CD235a in cultures of CD9+LinCD34+CD45RA HSPCs and CD9LinCD34+CD45RA HSPCs on the indicated days. Cells varied in size and granularity at different culture time-points, thus the voltages for flow cytometric analysis were adjusted accordingly, resulting in inconsistent thresholds. g Proportion of CD41+CD235a and CD235a+CD41 cells on days 22, 26, and 28 after culturing flow-sorted CD9+LinCD34+CD45RA HSPCs and CD9LinCD34+CD45RA HSPCs. Error bars, mean ± S.E. Data were subjected to variable transformation (arcsine square root transformed) and analyzed using one-way ANOVA. ITP, n = 5; HC, n = 4. ***p < 0.001. h Representative immunofluorescence microscopy images (left panel) showing the morphology of megakaryocytes after culture. Scale bar, 10 μm. Representative light microscopy images of Wright–Giemsa-stained cytospins (right panel) showing the morphology of megakaryocytes after culture. i The expression of CD41a, and CD61 in cultures of CD9+LinCD34+CD45RA HSPCs and CD9LinCD34+CD45RA HSPCs on day 28. j Box plots showing the proportion of CD41a+CD61+ cells in cultures of CD9+LinCD34+CD45RA HSPCs and CD9LinCD34+CD45RA HSPCs flow-sorted from ITP and HC BM samples. Data were subjected to variable transformation (arcsine square root transformed) and analyzed using one-way ANOVA with Scheffe’s post hoc test. ITP, n = 5; HC, n = 4. ***p < 0.001. ns, not significant
Fig. 6
Fig. 6
Co-culture of immune cell progenitors and Mk-biased HSPCs. a Experimental strategy. Schematic illustration of the transwell co-culture systems. Related to Fig. 6. b, c The proportion of CD41a+CD61+ cells derived from CD9+LinCD34+CD45RA HSPCs co-cultured with pre-B cells of HC and ITP, respectively. Two-tailed Student’s t test; *p < 0.05; n = 5. d, e The proportion of CD41a+CD61+ cells derived from CD9+LinCD34+CD45RA HSPCs co-cultured with NK/Tp cells of HC and ITP, respectively. Two-tailed Student’s t test; ns, not significant; n = 6
Fig. 7
Fig. 7
Transcriptomic analysis of different cell populations in human integrated dataset. a Schematic overview. Related to Fig. 7. b Cell clusters were visualized using UMAP. Colors indicate cell types. Each dot represents one cell. HSC hematopoietic stem cells, MPP multipotent progenitors, CMP common myeloid progenitors, GMP granulocyte and monocyte progenitors, NeuP neutrophil progenitors, MMP monocyte-macrophage progenitors, MDP monocyte-dendritic-cell progenitors, EBMP eosinophil-basophil-mast-cell progenitors, CLP common lymphoid progenitors, pre-B pre-B cells, NK/Tp natural killer/T cell progenitors, MEP megakaryocyte-erythroid progenitors, MkP/Mk megakaryocytic progenitors/megakaryocytes, EryP erythroid progenitors, EB erythroblasts, Ery erythrocytes, Mes mesenchymal cells, EC endothelial cells, Epi epithelial cells, G2M cells in G2/M phase. Pie chart showing the relative abundance of each cell cluster in the integrated dataset. c UMAP plots displaying the expression of four known marker genes (HLF, EBF1, CEBPD, and GATA1) during hematopoietic development. Arrows indicate the main directions of differentiation, inferred from the analysis of typical marker genes. d Top 5 GO: BP terms (upper) and KEGG pathways (lower) enriched in MkP/Mk1 (left) and MkP/Mk2 (right). e UMAP visualization of 14 subclusters resulted from sub-dividing the cells in MkP/Mk clusters, as described in Fig. 7b. Color according to subclusters. Pie chart showing the relative abundance of each subcluster. f Heat map of the top 10 significant DEGs and enriched GO terms in the MkP and Mk subclusters. See also Supplemental Fig. 12. g PAGA topology tree of MkP and Mk subclusters. Edge weights indicate the strength of the connectivity between clusters
Fig. 8
Fig. 8
Detailed analysis of MkP populations in BM. a Top 5 GO: BP terms (upper) and KEGG pathways (lower) enriched in MkP1 (left) and MkP2 (right). b UMAP plots displaying the expression of six molecular features of MkP (F2R, GATA2, ITGA2B, MEIS1, PBX1, and PLEK). c UMAP visualization of seven subclusters, resulting from sub-dividing the BM cells in the MkP1 and MkP2 clusters described in Fig. 1c. Color according to subclusters. Pie chart showing the relative abundance of each subcluster. d Stacked barplots showing the numbers of cells from different sample sources in each subcluster (left), and proportions of cells from different sample sources in each subcluster (right). e Heat map showing the scaled expression of the top 10 marker genes in each MkP subcluster. See also Supplemental Fig. 13. f Top 15 differentially expressed TFs in each subcluster. See also Supplemental Fig. 14
Fig. 9
Fig. 9
ITP-associated alterations in MkP subclusters. a TOP 5 GO: BP terms enriched in each MkP subcluster. b Heat maps showing the distribution of downregulated DEGs (left) and upregulated DEGs (right) between ITP and HC samples in each MkP subcluster. The gray bars on the left of the heat maps denote DEGs shared by at least two subclusters, while the others are subcluster-specific DEGs. c Volcano plots highlighting significant differences in gene expression between ITP and HC in MkP-IV (left) and MkP-V (right). Red points represent significantly upregulated genes, blue points represent significantly downregulated genes, and gray points represent non-differentially expressed genes. Genes with an adjusted p value < 0.05, log-transformed fold change absolute value >0.25, and minimum percentage >0.25 were considered as differentially expressed genes. d Boxplot showing the expression of DEGs in MkP-V. e Two-sided bar graph showing the top 10 enriched upregulated and downregulated GO terms in MkP-V in ITP. f GSEA plots showing representative pathways enriched in MkP-V from ITP versus HC. NES normalized enrichment score, NOM p value nominal p value, FDR q value false discovery rate q value. g GSEA plots showing representative pathways enriched in MkP-V from HC versus ITP. NES normalized enrichment score, NOM p value nominal p value, FDR q value false discovery rate q value

References

    1. Rodeghiero F, et al. Standardization of terminology, definitions and outcome criteria in immune thrombocytopenic purpura of adults and children: report from an international working group. Blood. 2009;113:2386–2393. doi: 10.1182/blood-2008-07-162503. - DOI - PubMed
    1. Audia S, et al. Pathogenesis of immune thrombocytopenia. Autoimmun. Rev. 2017;16:620–632. doi: 10.1016/j.autrev.2017.04.012. - DOI - PubMed
    1. Chang Y, Bluteau D, Debili N, Vainchenker W. From hematopoietic stem cells to platelets. J. Thromb. Haemost. 2007;5:318–327. doi: 10.1111/j.1538-7836.2007.02472.x. - DOI - PubMed
    1. Smith BW, Murphy GJ. Stem cells, megakaryocytes, and platelets. Curr. Opin. Hematol. 2014;21:430–437. doi: 10.1097/MOH.0000000000000064. - DOI - PMC - PubMed
    1. Chang M, et al. Immune thrombocytopenic purpura (ITP) plasma and purified ITP monoclonal autoantibodies inhibit megakaryocytopoiesis in vitro. Blood. 2003;102:887–895. doi: 10.1182/blood-2002-05-1475. - DOI - PubMed

Publication types