. 2022 Oct 6;13(1):5656.
doi: 10.1038/s41467-022-32771-6.

Consequences of telomere dysfunction in fibroblasts, club and basal cells for lung fibrosis development

Affiliations

Consequences of telomere dysfunction in fibroblasts, club and basal cells for lung fibrosis development

Sergio Piñeiro-Hermida et al. Nat Commun. .

Abstract

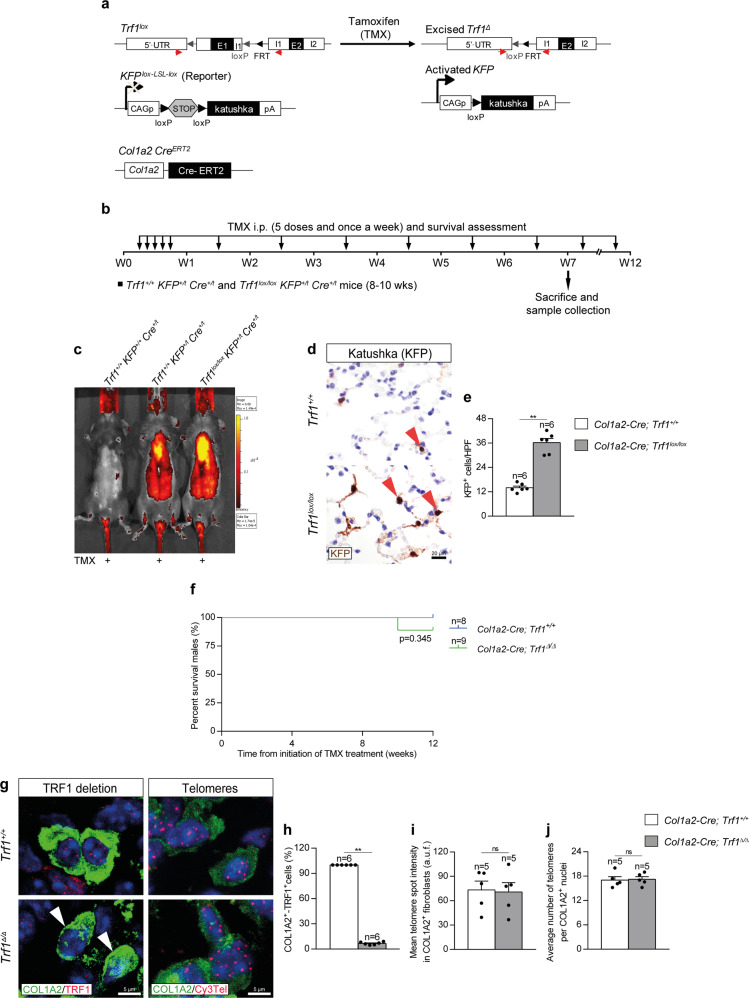
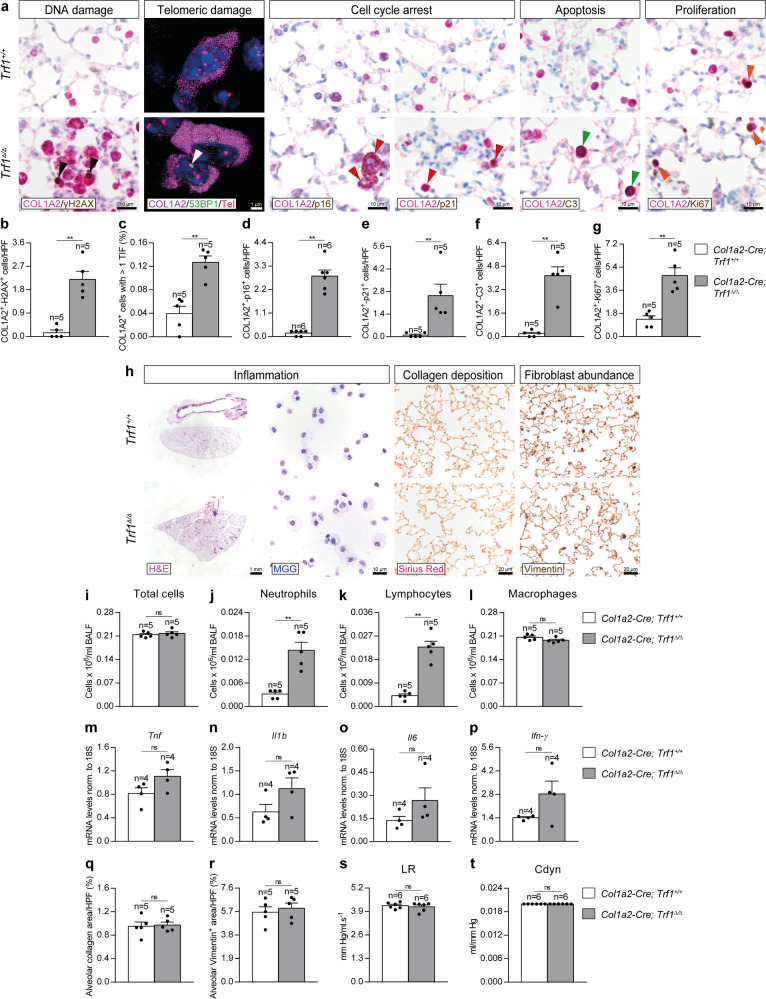
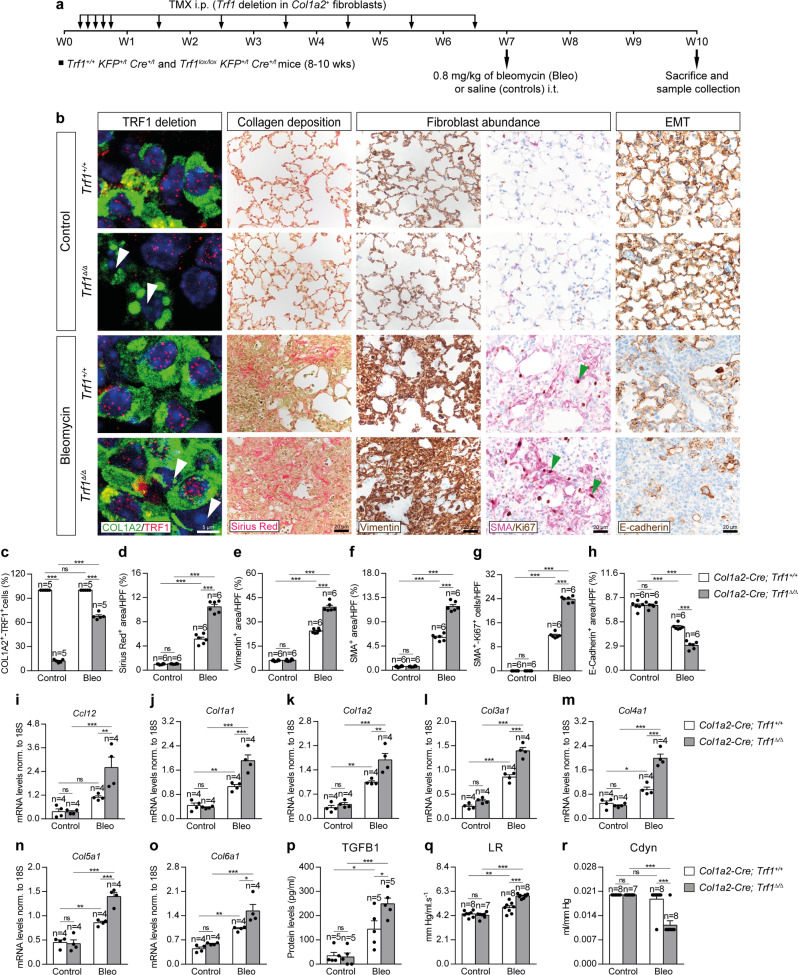
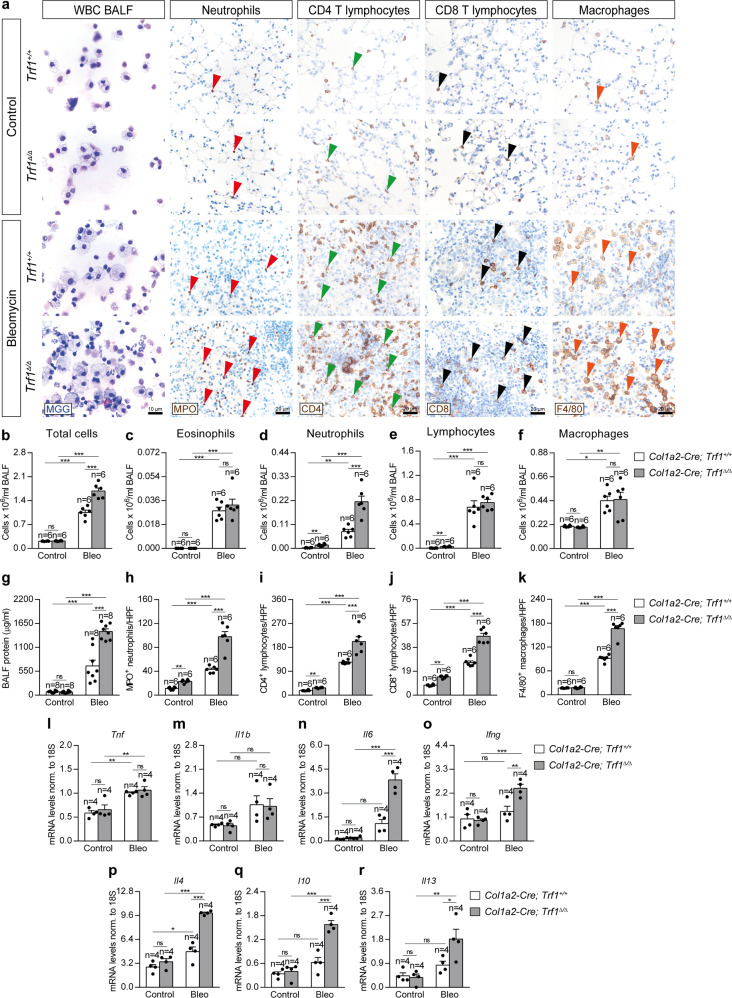
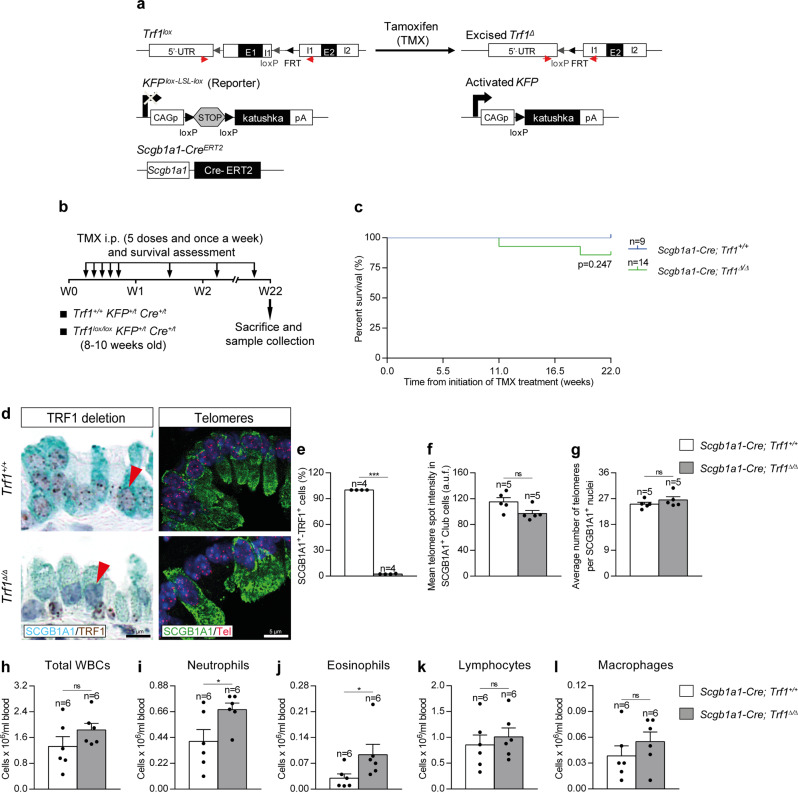
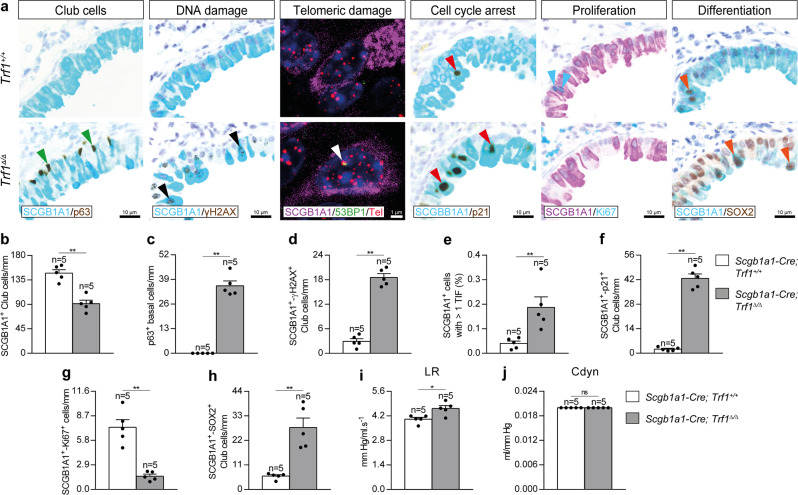
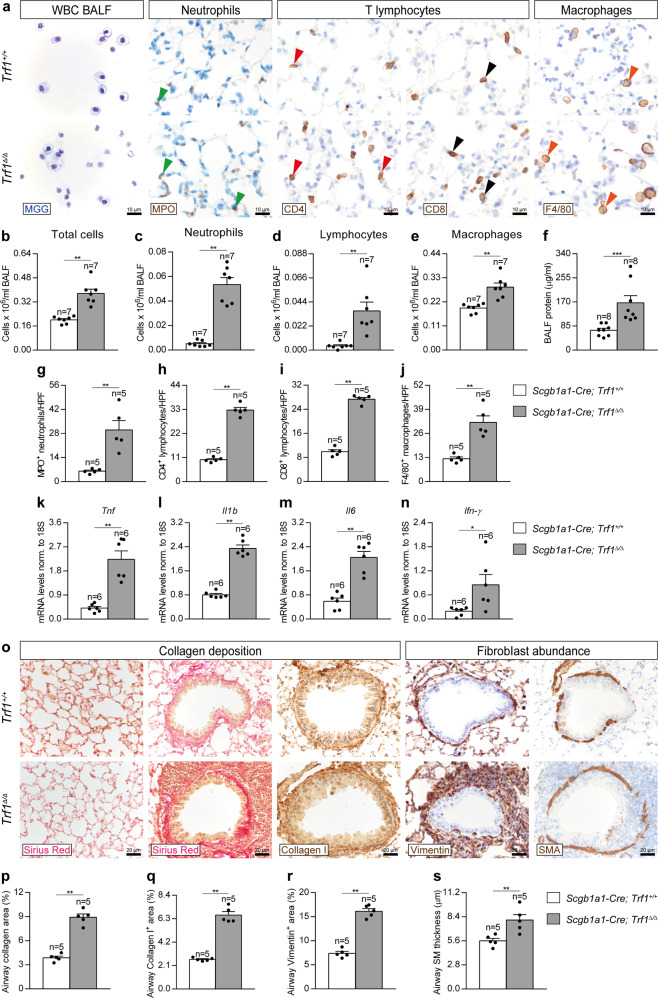
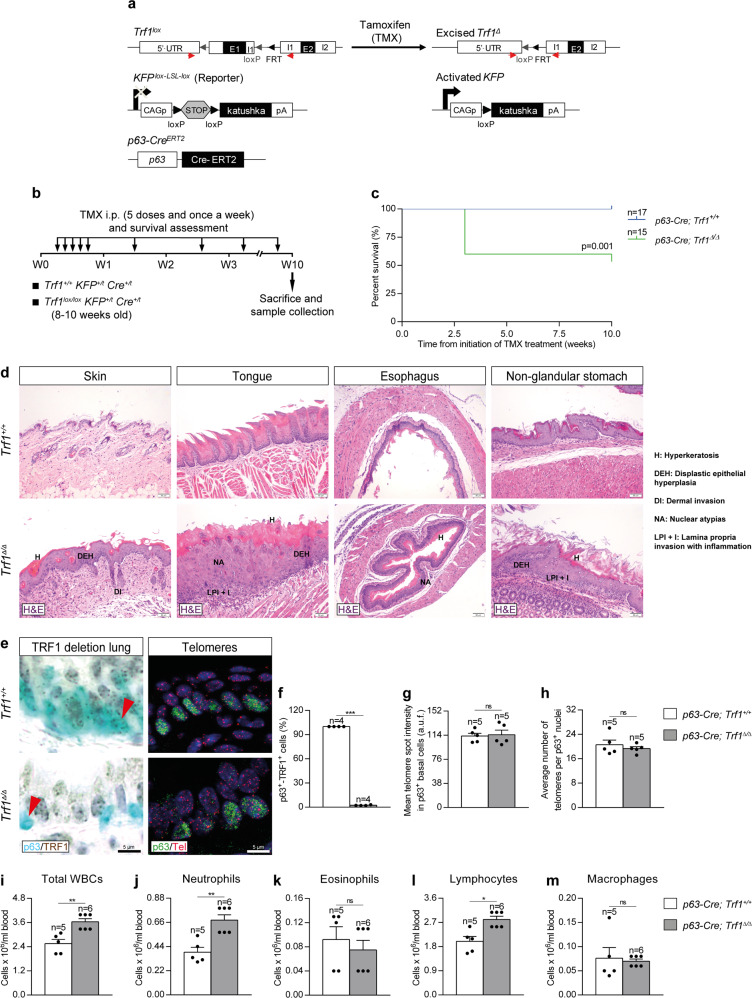
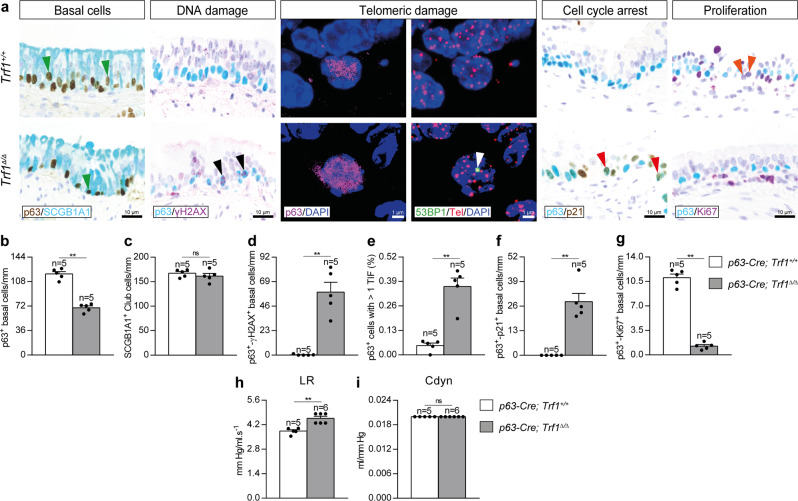
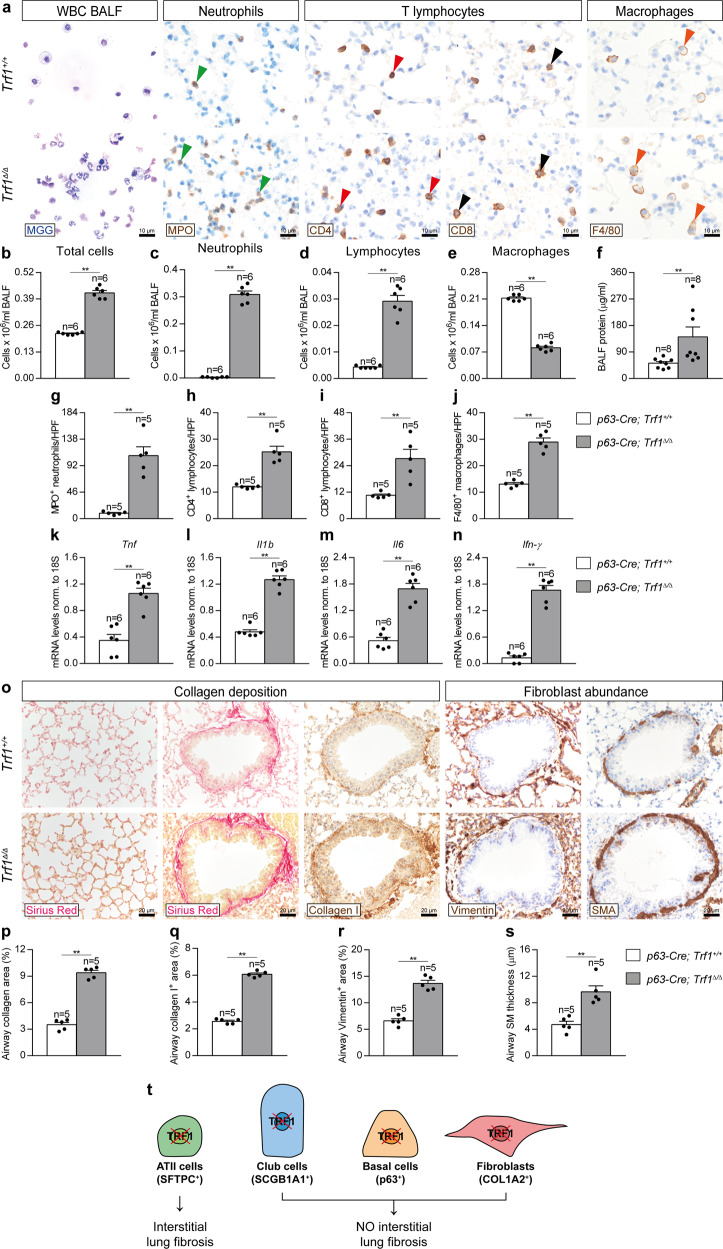
TRF1 is an essential component of the telomeric protective complex or shelterin. We previously showed that dysfunctional telomeres in alveolar type II (ATII) cells lead to interstitial lung fibrosis. Here, we study the lung pathologies upon telomere dysfunction in fibroblasts, club and basal cells. TRF1 deficiency in lung fibroblasts, club and basal cells induced telomeric damage, proliferative defects, cell cycle arrest and apoptosis. While Trf1 deletion in fibroblasts does not spontaneously lead to lung pathologies, upon bleomycin challenge exacerbates lung fibrosis. Unlike in females, Trf1 deletion in club and basal cells from male mice resulted in lung inflammation and airway remodeling. Here, we show that depletion of TRF1 in fibroblasts, Club and basal cells does not lead to interstitial lung fibrosis, underscoring ATII cells as the relevant cell type for the origin of interstitial fibrosis. Our findings contribute to a better understanding of proper telomere protection in lung tissue homeostasis.


Conflict of interest statement

The authors declare no competing interests.

Figures

Fig. 1
Fig. 1. Efficient Trf1 deletion in lung fibroblasts upon tamoxifen administration.
a Generation of the conditional knockout mouse model in which Trf1 was deleted in fibroblasts using the Cre recombinase driven by the Col1a2 promoter. Trf1lox, KFPLox-LSL-Lox, and Col1a2-CreERT2 alleles are depicted before and after Cre-mediated excision. b Tamoxifen (TMX) treatment, survival rate assessment and sample collection. Eight-to 10-week-old male Trf1+/+ KFP+/t Cre+/t (Col1a2-Cre; Trf1+/+) and Trf1lox/lox KFP+/t Cre+/t (Col1a2-Cre; Trf1lox/lox) mice were i.p. injected with TMX for five consecutive days during the first week and once a week until the sacrifice and sample collection on week (W) 7, and during the follow-up of survival until W12. c Representative images of fluorescence intensity of katushka fluorescent protein (KFP) in Trf1+/+ KFP+/+ Cre+/t, Trf1+/+ KFP+/t Cre+/t and Trf1lox/lox KFP+/t Cre+/t mice. Representative immunostainings for KFP (d), and quantification of KFP positive cells per 40X high-power field (HPF) (e) in lung sections from Trf1+/+ KFP+/t Cre+/t and Trf1lox/lox KFP+/t Cre+/t mice. f Kaplan–Meier survival curves of Col1a2-Cre; Trf1+/+ (Trf1+/+, controls) and Col1a2-Cre; Trf1Δ/Δ (Trf1Δ/Δ) mice upon TMX treatment. g Representative immunofluorescence stainings for COL1A2 (green) and TRF1 (red) (white arrowheads indicate COL1A2+ fibroblasts with deletion of TRF1), and immune-telomere-Q-FISH in COL1A2+ fibroblasts (Cy3Tel probe (red), COL1A2+ cells (green), and nuclei stained with DAPI (blue)) in lung sections from Trf1+/+ and Trf1Δ/Δ mice. Quantification of the proportion of double COL1A2+-TRF1+ fibroblasts (h) and mean telomere spot intensity (i) and average number of telomeres (j) in COL1A2+ cells from Trf1+/+ and Trf1Δ/Δ mice. Data are expressed as mean ± SEM (the number of mice is indicated in each case). **p < 0.01 (Mann–Whitney or unpaired t tests). Animal survival was assessed by the Kaplan–Meier analysis, using the log Rank (Mantel–Cox) test). Source data are provided as a Source Data file.
Fig. 2
Fig. 2. Trf1 deletion in lung fibroblasts increases telomeric damage, cell cycle arrest and apoptosis, and reduces proliferation of lung fibroblasts.
a Representative lung immunostainings for COL1A2 (purple) and γH2AX (brown; black arrowheads indicate double COL1A2+-γH2AX+ fibroblasts), COL1A2 (purple) and p16 and p21 (brown; red arrowheads indicate double COL1A2+-p16+ and COL1A2+-p21+ fibroblasts), COL1A2 (purple) and C3 (brown; green arrowheads indicate double COL1A2+-C3+ fibroblasts), and COL1A2 (purple) and Ki67 (brown; orange arrowheads indicate double COL1A2+-Ki67+ fibroblasts), as well as representative lung images of telomeric induced foci (TIF) in COL1A2+ cells (COL1A2 (purple), Cy3Tel probe (red), 53BP1+ cells (green; white arrowheads indicate TIF) and nuclei stained with DAPI (blue)) in lung sections from Trf1+/+ and Trf1Δ/Δ mice. Quantification of COL1A2+-γH2AX+ (b), COL1A2+-p16+ (d), COL1A2+-p21+ (e), COL1A2+-C3+ (f), and COL1A2+-Ki67+ (g) fibroblasts per 40X high-power field (HPF), as well as the proportion (%) of COL1A2+ cells with more than 1 TIF in lung sections from Trf1+/+ and Trf1Δ/Δ mice (c). h Representative images of Trf1+/+ and Trf1Δ/Δ lungs (H&E), BALF cytospin preparations (May-Grünwald Giemsa (MGG)) and Sirius Red staining, and Vimentin immunostainings in lung sections from Trf1+/+ and Trf1Δ/Δ mice. Quantification of total (i) and differential BALF cell counts for neutrophils (j), lymphocytes (k) and macrophages (l), and Lung tissue mRNA expression levels of Tnf (m) Il1b (n), Il6 (o) and Ifn-γ (p) (Th1 inflammation) in Trf1+/+ and Trf1Δ/Δ mice. Quantification of alveolar collagen (Sirius Red) (q) and Vimentin (r) positive areas (%), and lung resistance (LR) (s) and dynamic compliance (Cdyn) (t) evaluated by plethysmography in Trf1+/+ and Trf1Δ/Δ mice. Data are expressed as mean ± SEM (the number of mice is indicated in each case). **p < 0.01 (Mann–Whitney or unpaired t tests). Source data are provided as a Source Data file.
Fig. 3
Fig. 3. Trf1 deletion in lung fibroblasts exacerbates profibrotic pathologies upon bleomycin-induced pulmonary fibrosis.
a Tamoxifen (TMX) was intraperitoneally (i.p.) injected to eight-to 10-week-old male Trf1+/+ KFP+/t Cre+/t (Col1a2-Cre; Trf1+/+) and Trf1lox/lox KFP+/t Cre+/t (Col1a2-Cre; Trf1lox/lox) mice for five consecutive days during the first week and then once a week until week (W) 7. Then, at W7, animals were intra-tracheally instilled with either a single dose of 0.8 mg/kg of bleomycin (BLM) or saline (controls). Sacrifice and sample collection were performed at W10. b Representative immunofluorescence stainings for COL1A2 (green) and TRF1 (red) (white arrowheads indicate COL1A2+ fibroblasts with deletion of TRF1), Sirius Red stainings and immunostainings for Vimentin, Smooth Muscle Actin (SMA) and Ki67 (SMA (purple) and Ki67 (brown); green arrowheads indicate double SMA+-Ki67+ fibroblasts), and E-cadherin in lung sections from control and BLM-challenged Trf1+/+ and Trf1Δ/Δ mice. Quantification of the proportion of double COL1A2+-TRF1+ fibroblasts in COL1A2+ cells (c), and airway collagen (Sirius Red) (d), Vimentin (e), SMA (f) and E-cadherin (h) positive areas (%), and SMA+-Ki67+ fibroblasts per 40X high-power field (HPF) (g) in lung sections from control and BLM-challenged Trf1+/+ and Trf1Δ/Δ mice. Lung tissue mRNA expression levels of Ccl12 (recruitment of fibrocytes) (i), Col1a1 (j), Col1a2 (k), Col3a1 (l), Col4a1 (m), Col5a1 (n) and Col6a1 (o) (collagen markers), and TGFB1 (myofibroblast differentiation) protein levels (p) in lung homogenates from control and BLM-challenged Trf1+/+ and Trf1Δ/Δ mice. Quantification of lung resistance (LR) (q) and dynamic compliance (Cdyn) (r) evaluated by plethysmography in control and BLM-challenged Trf1+/+ and Trf1Δ/Δ mice. Data are expressed as mean ± SEM (the number of mice is indicated in each case). *p < 0.05, **p < 0.001, ***p < 0.001 (Dunn–Sidak test for multiple comparisons). Source data are provided as a Source Data file.
Fig. 4
Fig. 4. Trf1 deletion in lung fibroblasts exacerbates bleomycin-induced inflammatory response.
a Representative BALF cytospin preparations (May-Grünwald Giemsa (MGG)) and immunostainings for MPO (red arrowheads indicate MPO+ neutrophils), CD4 and CD8 (green and black arrowheads indicate CD4+ and CD8+ T lymphocytes) and F4/80 (orange arrowheads indicate F4/80+ macrophages) in lung sections from control and BLM-challenged Trf1+/+ and Trf1Δ/Δ mice. Quantification of total (b) and differential BALF cell counts for eosinophils (c), neutrophils (d) lymphocytes (e) and macrophages (f) and total protein concentration in BALF (g), of control and BLM-challenged Trf1+/+ and Trf1Δ/Δ mice. Quantification of lung MPO (h), CD4 (i), CD8 (j) and F4/80 (k) positive cells per 40X high-power field (HPF), and lung tissue mRNA expression levels of Tnf (l) Il1b (m), Il6 (n) and Ifn-γ (o) (Th1 inflammation) and Il4 (p), Il10 (q) and Il13 (r) (Th2 inflammation) in control and BLM-challenged Trf1+/+ and Trf1Δ/Δ mice. Data are expressed as mean ± SEM (the number of mice is indicated in each case). *p < 0.05, **p < 0.01, ***p < 0.001 (Dunn–Sidak test for multiple comparisons). Source data are provided as a Source Data file.
Fig. 5
Fig. 5. Efficient Trf1 deletion in club cells upon tamoxifen administration.
a Generation of the conditional knockout mouse model in which Trf1 was deleted in club cells using the Cre recombinase driven by the Scgb1a1 promoter. Trf1lox, KFPLox-LSL-Lox, and Scgb1a1-CreERT2 alleles are depicted before and after Cre-mediated excision. b Tamoxifen (TMX) treatment, survival rate assessment and sample collection. Eight-to 10-week-old male Trf1+/+ KFP+/t Cre+/t (Scgb1a1-Cre; Trf1+/+) and Trf1lox/lox KFP+/t Cre+/t (Scgb1a1-Cre; Trf1lox/lox) mice were i.p. injected with TMX for five consecutive days during the first week and once a week until the sacrifice and sample collection on week (W) 22. c Kaplan–Meier survival curves of Scgb1a1-Cre; Trf1+/+ (Trf1+/+, controls) and Scgb1a1-Cre; Trf1Δ/Δ (Trf1Δ/Δ) mice upon TMX treatment. d Representative immunostainings for SCGB1A1 (blue) and TRF1 (brown) (red arrowheads indicate SCGB1A1+ club cells with deletion of TRF1), and immune-telomere-Q-FISH in SCGB1A1+ club cells (Cy3Tel probe (red), SCGB1A1+ cells (green), and nuclei stained with DAPI (blue)) in lung sections from Trf1+/+ and Trf1Δ/Δ mice. Quantification of SCGB1A1+-TRF1+ cells (%) (e), mean telomere spot intensity (f) and average number of telomeres (g) in SCGB1A1+ cells in Trf1+/+ and Trf1Δ/Δ mice. Quantification of total white blood cells (h), neutrophils (i), eosinophils (j), lymphocytes (k) and macrophages (l) in peripheral blood from Trf1+/+ and Trf1Δ/Δ mice. Data are expressed as mean ± SEM (the number of mice is indicated in each case). *p < 0.05, ***p < 0.001 (Mann–Whitney or unpaired t tests). Animal survival was assessed by the Kaplan–Meier analysis, using the log Rank (Mantel–Cox) test). Source data are provided as a Source Data file.
Fig. 6
Fig. 6. Trf1 deletion in club cells increases telomeric damage, cell cycle arrest and differentiation, and reduces proliferation of club cells.
a Representative immunostainings for SCGB1A1 (blue) and p63 (brown; green arrowheads indicate p63+ basal cells), SCGB1A1 (blue) and γH2AX (brown; black arrowheads indicate double SCGB1A1+-γH2AX+ club cells), SCGB1A1 (blue) and p21 (brown; red arrowheads indicate double SCGB1A1+-p21+ club cells), SCGB1A1 (purple) and Ki67 (blue; blue arrowheads indicate double SCGB1A1+-Ki67+ club cells), and SCGB1A1 (blue) and SOX2 (brown; orange arrowheads indicate double SCGB1A1+-SOX2+ club cells), as well as representative images of telomeric induced foci (TIF) in SCGB1A1+ cells (SCGB1A1 (purple), Cy3Tel probe (red), 53BP1+ cells (green; white arrowheads indicate TIF) and nuclei stained with DAPI (blue)) in lung sections from Trf1+/+ and Trf1Δ/Δ mice. Quantification of SCGB1A1+ (b), p63+ (c), and double SCGB1A1+-γH2AX+ (d), SCGB1A1+-p21+ (f), SCGB1A1+-Ki67+ (g) and SCGB1A1+-SOX2+ (h) club cells per epithelium length (mm), as well as the proportion (%) of SCGB1A1+ cells with more than 1 TIF (e) in Trf1+/+ and Trf1Δ/Δ mice. Quantification of lung resistance (LR) (i) and dynamic compliance (Cdyn) (j) evaluated by plethysmography in Trf1+/+ and Trf1Δ/Δ mice. Data are expressed as mean ± SEM (the number of mice is indicated in each case). *p < 0.05, **p < 0.01 (Mann–Whitney or unpaired t tests). Source data are provided as a Source Data file.
Fig. 7
Fig. 7. Trf1 deletion in club cells increases lung inflammation and airway remodeling.
a Representative BALF cytospin preparations (May-Grünwald Giemsa (MGG)) and immunostainings for MPO (neutrophils), CD4 and CD8 (T lymphocytes) and F4/80 (macrophages) in lung sections from Trf1+/+ and Trf1Δ/Δ mice. Quantification of total (b) and differential BALF cell counts for neutrophils (c), lymphocytes (d) and macrophages (e), and total protein concentration in BALF (f) of Trf1+/+ and Trf1Δ/Δ mice. Quantification of lung MPO (g), CD4 (h), CD8 (i) and F4/80 (j) positive cells per 40X high-power field (HPF), and lung tissue mRNA expression levels of Tnf (k), Il1b (l), Il6 (m) and Ifn-γ (n) (Th1 inflammation) in Trf1+/+ and Trf1Δ/Δ mice. o Representative stainings for Sirius Red (alveolar parenchyma and airways) and immunostainings for Collagen I, Vimentin and SMA (airways) in lung sections from Trf1+/+ and Trf1Δ/Δ mice. Quantification of airway collagen (Sirius Red) (p), airway Collagen I (q) and Vimentin (r) positive areas (%), and airway smooth muscle (SM) thickness (SMA) (µm) (s) in Trf1+/+ and Trf1Δ/Δ mice. Data are expressed as mean ± SEM (the number of mice is indicated in each case). *p < 0.05, **p < 0.01, ***p < 0.001 (Mann–Whitney or unpaired t tests). Source data are provided as a Source Data file.
Fig. 8
Fig. 8. Efficient Trf1 deletion in lung basal cells upon tamoxifen administration.
a Generation of the conditional knockout mouse model in which Trf1 was deleted in basal cells using the Cre recombinase driven by the p63 promoter. Trf1lox, KFPLox-LSL-Lox, and Scgb1a1-CreERT2 alleles are depicted before and after Cre-mediated excision. b Tamoxifen (TMX) treatment, survival rate assessment and sample collection. Eight-to 10-week-old male Trf1+/+ KFP+/t Cre+/t (p63-Cre; Trf1+/+) and Trf1lox/lox KFP+/t Cre+/t (p63-Cre; Trf1lox/lox) mice were i.p. injected with TMX for five consecutive days during the first week and once a week until the sacrifice and sample collection on week (W) 10. c Kaplan–Meier survival curves of p63-Cre; Trf1+/+ (Trf1+/+, controls) and p63-Cre; Trf1Δ/Δ (Trf1Δ/Δ) mice upon TMX treatment. d Abnormal pathologies observed in Trf1Δ/Δ mice in the skin (hyperkeratosis (H), dysplastic epithelial hyperplasia (DEH) and dermal invasion (DI)), tongue (hyperkeratosis (H), dysplastic epithelial hyperplasia (DEH), nuclear atypias (NA) and epithelial lamina propria invasion with inflammation (LPI + I)), esophagus (hyperkeratosis (H) and nuclear atypias (NA)) and stomach (hyperkeratosis (H), dysplastic epithelial hyperplasia (DEH) and epithelial lamina propria invasion with inflammation (LPI + I)). e Representative immunostainings for p63 (blue) and TRF1 (brown) (red arrowheads indicate p63+ basal cells with deletion of TRF1), and immune-telomere-Q-FISH in p63+ club cells (Cy3Tel probe (red), p63+ cells (green), and nuclei stained with DAPI (blue)) in lung sections from Trf1+/+ and Trf1Δ/Δ mice. Quantification of p63+-TRF1+ cells (%) (f), mean telomere spot intensity (g) and average number of telomeres (h) in SCGB1A1+ cells in Trf1+/+ and Trf1Δ/Δ mice. i–m Quantification of total white blood cells (i), neutrophils (j), eosinophils (k), lymphocytes (l) and macrophages (m) in peripheral blood from Trf1+/+ and Trf1Δ/Δ mice. Data are expressed as mean ± SEM (the number of mice is indicated in each case). *p < 0.05, **p < 0.01, ***p < 0.001 (Mann–Whitney or unpaired t tests). Animal survival was assessed by the Kaplan–Meier analysis, using the log Rank (Mantel–Cox) test). Source data are provided as a Source Data file.
Fig. 9
Fig. 9. Trf1 deletion in basal cells increases telomeric damage and cell cycle arrest, and reduces proliferation of lung basal cells.
a Representative immunostainings for p63 (blue) and SCGB1A1 (brown; green arrowheads indicate p63+ basal cells), p63 (blue) and γH2AX (brown; black arrowheads indicate double p63+-γH2AX+ basal cells), p63 (blue) and p21 (brown; red arrowheads indicate double p63+-p21+ basal cells), and p63 (blue) and Ki67 (purple; orange arrowheads indicate double p63+-Ki67+ basal cells), as well as representative images of telomeric induced foci (TIF) in p63+ cells (p63 (purple), Cy3Tel probe (red), 53BP1+ cells (green; white arrowheads indicate TIF) and nuclei stained with DAPI (blue)) in lung sections from Trf1+/+ and Trf1Δ/Δ mice. Quantification of p63+ (b), SCGB1A1+ (c) and double p63+-γH2AX+ (d), p63+-p21+ (f) and p63+-Ki67+ (g) basal cells per epithelium length (mm), as well as the proportion (%) of p63+ cells with more than 1 TIF (e) in Trf1+/+ and Trf1Δ/Δ mice. Quantification of lung resistance (LR) (h) and dynamic compliance (Cdyn) (i) evaluated by plethysmography in Trf1+/+ and Trf1Δ/Δ mice. Data are expressed as mean ± SEM (the number of mice is indicated in each case). **p < 0.01 (Mann–Whitney or unpaired t tests). Source data are provided as a Source Data file.
Fig. 10
Fig. 10. Trf1 deletion in lung basal cells increases lung inflammation and airway remodeling.
a Representative BALF cytospin preparations (May-Grünwald Giemsa (MGG)) and immunostainings for MPO (neutrophils), CD4 and CD8 (T lymphocytes) and F4/80 (macrophages) in lung sections from Trf1+/+ and Trf1Δ/Δ mice. Quantification of total (b) and differential BALF cell counts for neutrophils (c), lymphocytes (d) and macrophages (e), and total protein concentration in BALF (f) of Trf1+/+ and Trf1Δ/Δ mice. Quantification of lung MPO (g), CD4 (h), CD8 (i) and F4/80 (j) positive cells per 40X high-power field (HPF), and lung tissue mRNA expression levels of Tnf (k), Il1b (l), Il6 (m) and Ifn-γ (n) (Th1 inflammation) in Trf1+/+ and Trf1Δ/Δ mice. o Representative stainings for Sirius Red (alveolar parenchyma and airways) and immunostainings for Collagen I, Vimentin and SMA (airways) in lung sections from Trf1+/+ and Trf1Δ/Δ mice. ps Quantification of airway collagen (Sirius Red), airway Collagen I and Vimentin positive areas (%), and airway smooth muscle (SM) thickness (SMA) (µm) in Trf1+/+ and Trf1Δ/Δ mice. Data are expressed as mean ± SEM (the number of mice is indicated in each case). **p < 0.01 (Mann–Whitney or unpaired t tests). t Pathological consequences of telomere dysfunction in fibroblasts, club and basal cells in the lung. Dysfunctional telomeres in alveolar type II (ATII) cells led to alveolar DNA damage, senescence and apoptosis, as well as to interstitial lung fibrosis. TRF1 deficiency in Club and basal cells induced telomeric damage and cell cycle arrest, and reduced proliferation of these cell types. TRF1 deletion in fibroblasts increased telomeric damage, cell cycle arrest, apoptosis and proliferation in this cell type. Noteworthy, depletion of TRF1 in fibroblasts, Club and basal cells did not lead to interstitial lung fibrosis. Source data are provided as a Source Data file.

Similar articles

Cited by

References

    1. Blackburn EH. Switching and signaling at the telomere. Cell. 2001;106:661–673. doi: 10.1016/S0092-8674(01)00492-5. - DOI - PubMed
    1. De Lange T. Shelterin: the protein complex that shapes and safeguards human telomeres. Genes Dev. 2005;19:2100–2110. doi: 10.1101/gad.1346005. - DOI - PubMed
    1. Palm W, De Lange T. How shelterin protects mammalian telomeres. Annu. Rev. Genet. 2008;42:301–334. doi: 10.1146/annurev.genet.41.110306.130350. - DOI - PubMed
    1. Olovnikov AM. A theory of marginotomy. The incomplete copying of template margin in enzymic synthesis of polynucleotides and biological significance of the phenomenon. J. Theor. Biol. 1973;41:181–190. doi: 10.1016/0022-5193(73)90198-7. - DOI - PubMed
    1. Harley CB, Futcher AB, Greider CW. Telomeres shorten during ageing of human fibroblasts. Nature. 1990;345:458–460. doi: 10.1038/345458a0. - DOI - PubMed

Publication types

Substances