. 2022 Oct 6;13(1):5886.
doi: 10.1038/s41467-022-33309-6.

DNA-delivered antibody cocktail exhibits improved pharmacokinetics and confers prophylactic protection against SARS-CoV-2

Affiliations

DNA-delivered antibody cocktail exhibits improved pharmacokinetics and confers prophylactic protection against SARS-CoV-2

Elizabeth M Parzych et al. Nat Commun. .

Abstract

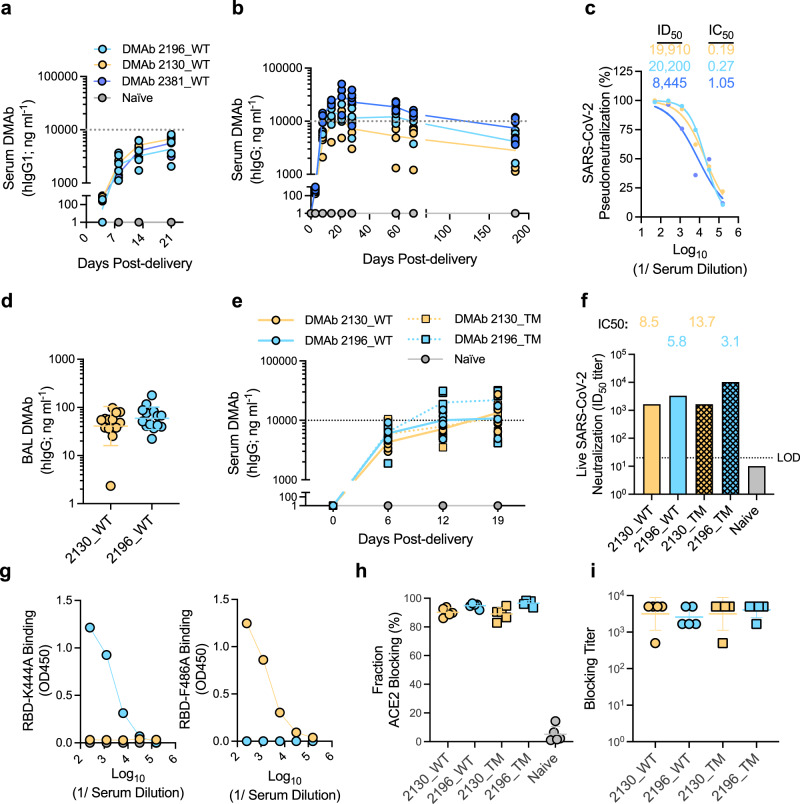
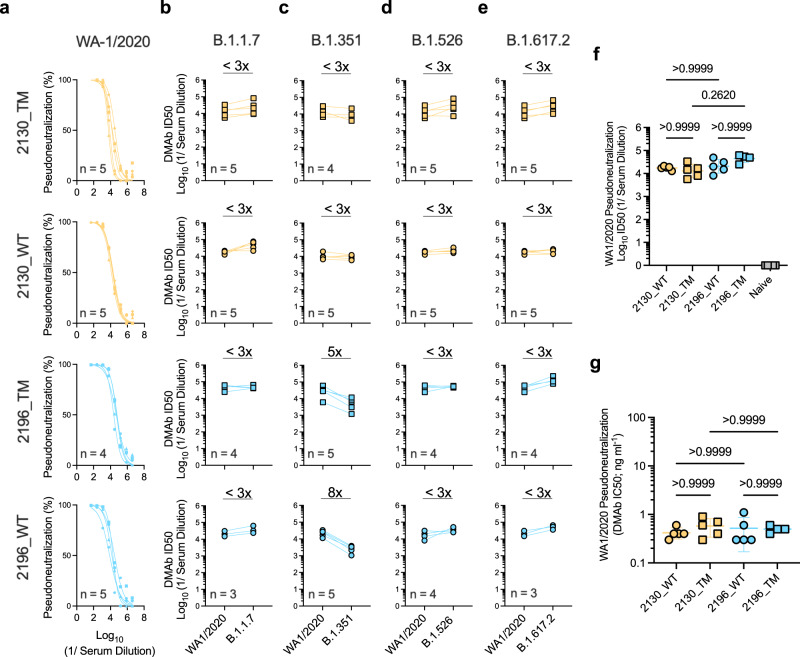
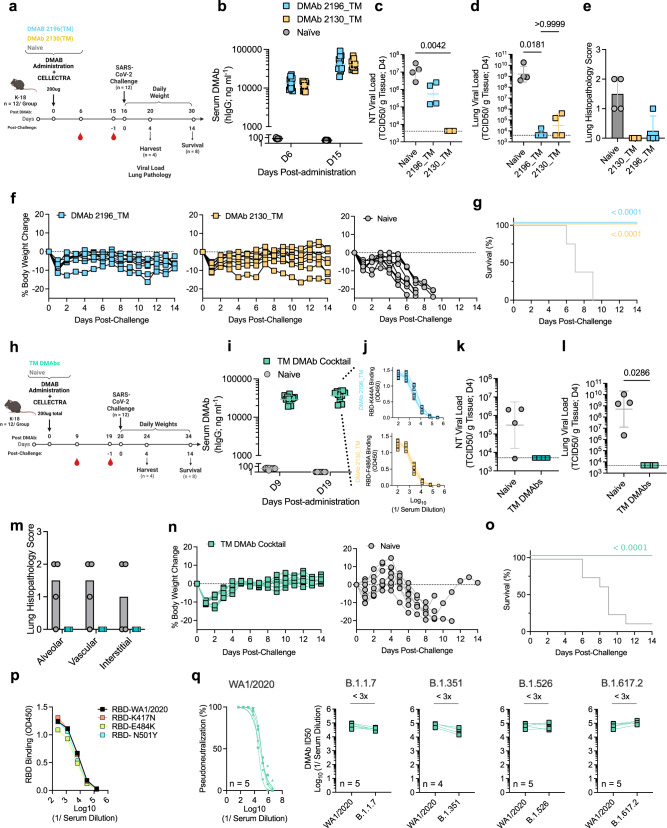
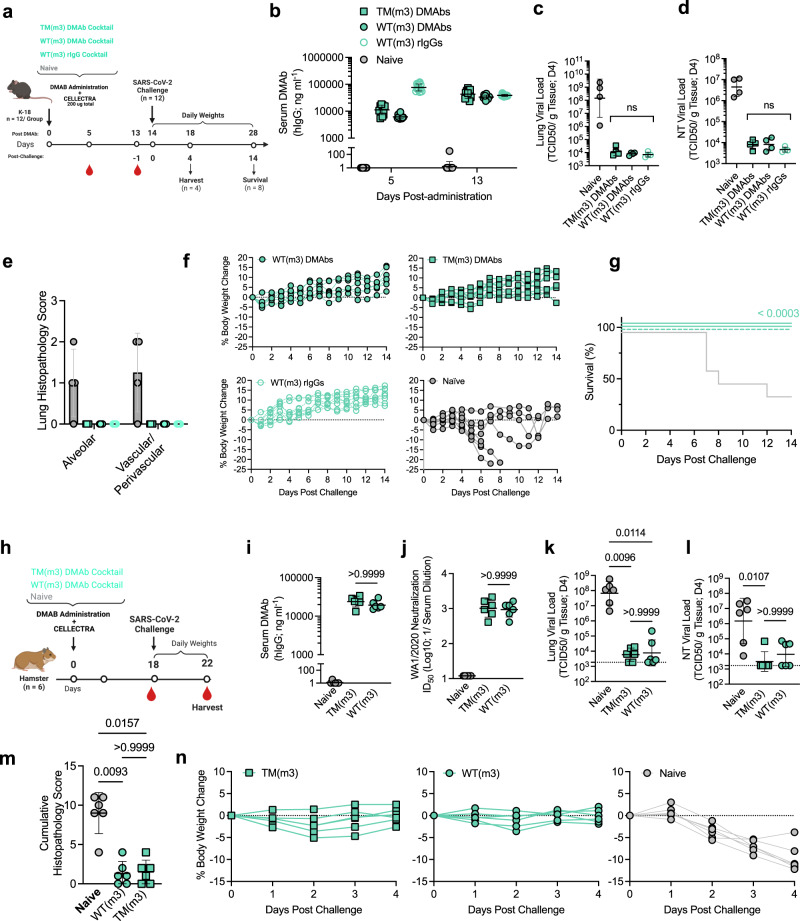
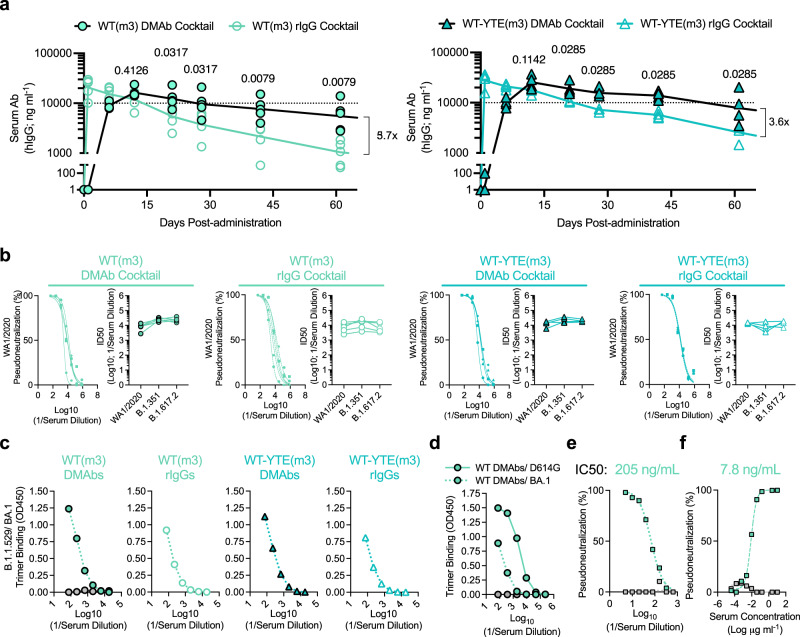
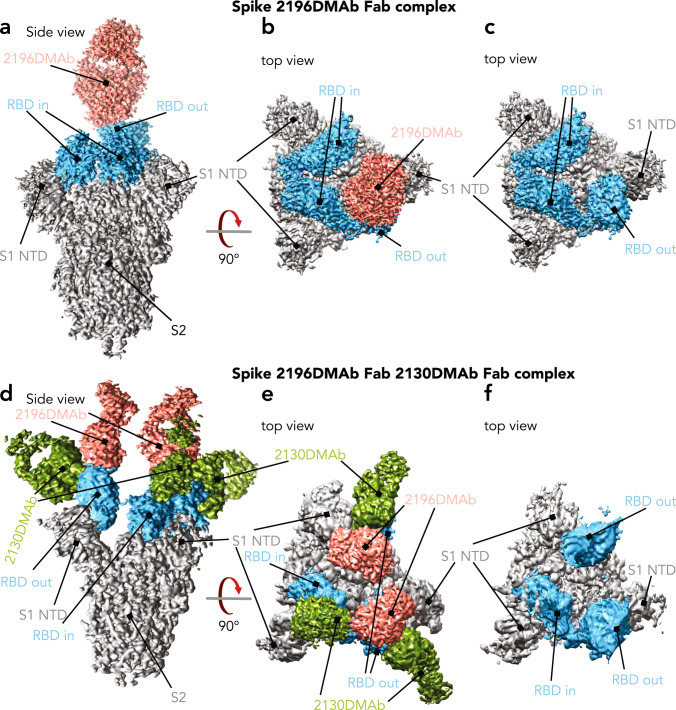
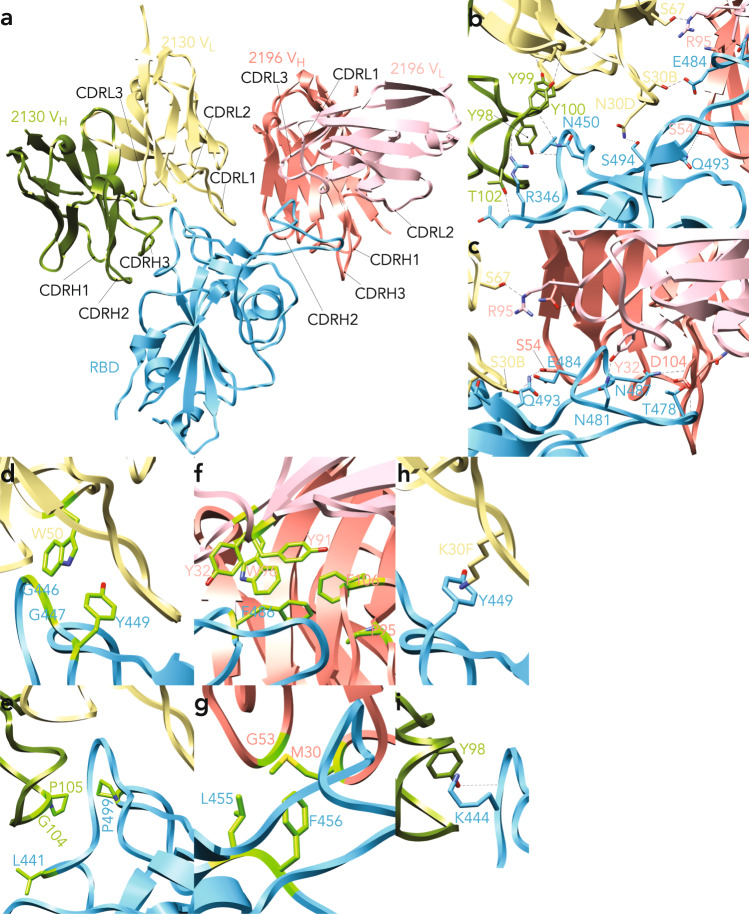
Monoclonal antibody therapy has played an important role against SARS-CoV-2. Strategies to deliver functional, antibody-based therapeutics with improved in vivo durability are needed to supplement current efforts and reach underserved populations. Here, we compare recombinant mAbs COV2-2196 and COV2-2130, which compromise clinical cocktail Tixagevimab/Cilgavimab, with optimized nucleic acid-launched forms. Functional profiling of in vivo-expressed, DNA-encoded monoclonal antibodies (DMAbs) demonstrated similar specificity, broad antiviral potency and equivalent protective efficacy in multiple animal challenge models of SARS-CoV-2 prophylaxis compared to protein delivery. In PK studies, DNA-delivery drove significant serum antibody titers that were better maintained compared to protein administration. Furthermore, cryo-EM studies performed on serum-derived DMAbs provide the first high-resolution visualization of in vivo-launched antibodies, revealing new interactions that may promote cooperative binding to trimeric antigen and broad activity against VoC including Omicron lineages. These data support the further study of DMAb technology in the development and delivery of valuable biologics.


Conflict of interest statement

K.S., T.R.F.S., V.M.A., I.M., K.E.B. and J.D.B. are employees of Inovio Pharmaceuticals and as such receives salary and benefits, including ownership of stock and stock options, from the company. J.F, K.R, K.R and M.T.E are employees of and hold or may hold stock in AstraZeneca. S.K.W. is an inventor on US patent (US20190216949) for the AAV6.2FF capsid. D.B.W. has received grant funding, participates in industry collaborations, has received speaking honoraria, and has received fees for consulting, including serving on scientific review committees and board series. Remuneration received by D.B.W. includes direct payments and stock or stock options. D.B.W. also discloses the following paid associations with commercial partners: GeneOne (consultant), Geneos (advisory board), AstraZeneca (advisory board, speaker), Inovio (BOD, SRA, Stock), Sanofi (advisory board) and BBI (advisory board). All other authors declare no completing interests.

Figures

Fig. 1
Fig. 1. Expression and characterization of in vivo-launched SARS-CoV-2 DMAb constructs.
WT DMAb expression (100 μg dose) following a single plasmid (n = 5 (2196_WT and 2130_WT) or 4 (2381_WT) independent biological replicates) or b dual plasmid constructs (n = 5) was measured in the sera of 6–8-week-old female BALB/c mice. Serum DMAb titers for individual mice over time are shown. Lines indicate the group geometric means (GM). c Neutralization of pseudotyped SARS-CoV-2 (USA-WA1/2020) by serum pools (from panel b). Neutralization curves for each pool are shown (best fit lines and individual data points derived from technical replicates); ID50 and calculated IC50 values are displayed. d DMAb levels in the lung bronchoalveolar lavage (BAL) of 6–8-week-old female BALB/c mice at D14 post-plasmid delivery (100 μg dose; n = 13 (2130_WT) or 14 (2196_WT) independent biological replicates). Titers for individual mice are shown with group GM (±geometric standard deviation (GSD)) indicated. e-i Expression and characterization of WT and TM DMAb constructs in 6–8-week-old female K−18 mice (100 μg dose; n = 5). e Titers for individual animals (independent biological replicates) over time are shown. Lines indicate the group geometric means (GM)). f Neutralizing activity of pooled sera against authentic SARS-CoV-2 virus (USA-WA1/2020). Graph depicts ID50 and calculated IC50 for each pool. LOD = limit of detection. g Reactivity of pooled sera against indicated epitope-specific mutant RBDs. Binding curves (OD450) of each pool (average of technical replicates) are shown. h-i ACE2 receptor-blocking activity of individual sera samples from e (n = 5 biological replicates) was determined; h proportion (%) of ACE-2 blocking relative to control wells (group mean ± SD) and i calculated blocking DMAb titer (GM (±GSD). Data representative of >2 independent experiments with similar results. Source data are provided as a Source Data file.
Fig. 2
Fig. 2. In vivo-launched 2196- and 2130-based DMAbs retain activity against major SARS-CoV-2 viral variants.
Neutralizing activity of sera samples (independent biological replicates) from DMAb-administered mice (n = 3–5/group, as indicated) against a USA-WA1/2020 SARS-CoV-2 pseudovirus. Graphs depict neutralization curves for each sera sample (best-fit lines and individual data points derived from technical replicates). b–e Corresponding activity of these sera against the indicated variant pseudoviruses. Graphs depict matched ID50s values of each sample against the indicated VoCs compared to USA-WA1/2020. Average fold change (x) in ID50 for each group is indicated for the following SARS-CoV-2 variants: b B.1.1.7; c B.1.351; d B.1.526; e B.1.617.2. f Comparison of serum ID50 values for individual samples against USA-WA1/2020 (group GM± GSD indicated). Differences between groups were measured using Kruskal–Wallis test followed by Dunn’s post hoc analysis. P values indicated. g Comparison of calculated IC50 values for individual samples against USA-WA1/2020 (group mean ± SD indicated). Differences between groups were measured using Kruskal–Wallis test followed by Dunn’s post hoc analysis. P values indicated. Data reproduced in >2 independent experiments with similar results. Source data are provided as a Source Data file.
Fig. 3
Fig. 3. Prophylactic delivery of 2196_TM and 2130_TM DMAbs protect mice against lethal SARS-CoV-2 challenge.
a-g DMAb prophylaxis against lethal SARS-CoV-2 (USA-WA1/2020) (monotherapy). a Schematic of challenge in 6–8-week-old female K-18 mice (n = 12 independent biological replicates). b Serum DMAb levels in individual animals (n = 12) following plasmid delivery (with group GM ± GSD indicated). c–e Measurements of viral control (TCID50/g tissue) at D4 (n = 4 independent biological replicates). Viral loads (with group GM ± GSD indicated) in the c, nasal turbinate (NT) and d lung were compared using a Kruskal–Wallis test followed by Dunn’s post hoc analysis. P values indicated. Horizontal lines indicate LOD. e Histopathology scores for H&E-stained lung sections. Group averages (±SD) and shown. f, g Challenge outcome in individual animals (n = 8 independent biological replicates). f Body weight change (%) for each animal and g Survival (%) were monitored. Survival curves were compared using a Mantel–Cox Log-rank test. P values indicated. h–o DMAb prophylaxis against lethal SARS-CoV-2 (USA-WA1/2020) following co-administration (cocktail). h Schematic of lethal challenge in 6–8-week-old male K−18 mice (n = 12 independent biological replicates). i Serum DMAb levels in individual animals (n = 12) are shown. Group GM (±GSD) indicated. j Sera reactivity against epitope-specific mutant RBDs; binding curves (derived from technical replicates) for each animal sample (n = 8 biological replicates) are shown. k–m Measurements of viral control (TCID50/g tissue) at D4 (n = 4 independent biological replicates). Viral load (GM (±GSD) indicated) in the k NT and l lung were compared using a two-tailed Mann–Whitney U test. P values indicated. Horizontal lines indicate LOD. m Histopathology scores for H&E-stained lung sections. Group averages (±SD) are shown. n, o Challenge outcome in individual animals (n = 8 independent biological replicates). n Body weight change (%) and o Survival (%) were monitored. Survival curves were compared using a Mantel–Cox Log-rank test. P values indicated. p Relative binding of pooled sera from cocktail-expressing challenge mice to the indicated mutant RBDs relative to parental D614G RBD; average binding curves for each pool (derived from technical replicates) are shown. q Neutralizing activity of individual sera (n = 5) against variant pseudoviruses. Neutralization curves against USA-WA1/2020 (best-fit lines and individual data points derived from technical replicates) are shown. Matched ID50s against the other variants relative to USA-WA1/2020 are shown for each sample. The fold change (x) in ID50 is indicated. Source data are provided as a Source Data file.
Fig. 4
Fig. 4. Fc-engineered DMAb cocktail(s) confer equivalent protection in both murine and hamster models of SARS-CoV-2 infection, comparable to bioprocessed rIgG.
a–g Efficacy of DMAb cocktails (TM or WT) compared to the rIgG cocktail (WT) benchmark in mice. a Schematic of lethal challenge in 6–8-week-old female K-18 mice (n = 12 independent biological replicates). b Individual serum antibody levels (group GM (±GSD) indicated) following plasmid or rIgG administration (n = 12). c–e Measurements of viral control in individual animals (TCID50/g tissue) at D4. Viral loads (group GM (±GSD) indicated) in the c NT and d lung were compared using a Kruskal–Wallis test followed by Dunn’s post hoc analysis. P values indicated. Horizontal lines indicate LOD. e Histopathology scores for individual H&E-stained lung sections (group averages (±SD) shown). e, f Challenge outcome in individual animal (n = 8 or 7 (WT(m3) DMAb group) independent biological replicates). f Body weight change (%) and g Survival (%) were monitored. Survival curves were compared using a Mantel–Cox Log-rank test. P value indicated. h–n Efficacy of DMAb cocktails (TM or WT) in a SARS-CoV-2 hamster challenge model. h Schematic of non-lethal challenge conducted in 7–8-week-old female Syrian golden hamsters (n = 6 biological replicates). i Pre-challenge serum DMAb levels in individual hamsters (group GM (±GSD) shown). j Antiviral activity of individual hamster sera (pre-challenge) against live SARS-CoV-2 (USA-WA1/2020). ID50 values (group GM (±GSD)) are displayed. k–m Measurements of viral control (TCID50/g tissue) at D4 post-challenge in the k lung and l NT of individual animals (group GM (±GSD) indicated). Groups were compared using a Kruskal–Wallis test followed by Dunn’s post hoc analysis. P values indicated. Horizontal lines indicate LOD. m Cumulative lung histopathology score for each animal (group means (±SD) indicated). Lung sections were scored for microscopic indications of edema, hemorrhage, hyperplasia, hypertrophy, metaplasia, mineralization and syncytial cells. Group scores were compared using a Kruskal–Wallis test followed by Dunn’s post hoc analysis. P values. n Body weight change (%) for each animal following challenge. Source data are provided as a Source Data file.
Fig. 5
Fig. 5. In vivo delivery and half-life engineering (YTE) contribute to improved durability of functional DMAbs compared to bioprocessed rIgG in hFcRn mice.
6–8-week-old female hFcRn mice (n = 4 (WT) or 5 (WT-YTE) independent biological replicates) were administered plasmids encoding the indicated DMAb cocktails (100 µg/animal) or rIgG cocktails (100 µg protein/animal; IP). a Individual serum levels (and group GM ± GSD) of the indicated DMAbs or rIgG mAbs are shown (n = 12). Group titers at each time point were compared using a two-tailed Mann–Whitney U test. P values indicated. Fold (x) difference in average titers between the indicated groups at D60 post-administration is depicted. b Neutralizing activity of all individual hFcRn serum samples (n = 4–5/group) against wildtype (USA-WA1/2020) or B.1.351 and B.1.617.2 variant pseudoviruses; neutralization curves against WA1−2020 (best-fit lines and individual data points derived from technical replicates) are shown, along with matched ID50s against other indicated variants. c Relative reactivity of pooled sera from hFcRn mice against recombinant B.1.1.529/BA.1 spike trimer. Average absorbance curves (OD450) displayed (derived from technical replicates). d–f Sera harvested from BALB/c mice expressing the DMAb WT(m3) cocktail was pooled for evaluation: d Relative reactivity against recombinant spike trimers from B.1.1.529/BA.1 or the parental D614G strains. Average absorbance curves (OD450) of each pool displayed (derived from technical replicates). Naïve serum was used as a control (gray). e-f Neutralizing activity of pooled sera (best-fit lines and individual data points derived from technical replicates) against e B.1.1.529/BA.1 or f B.1.1.529/BA.2 pseudotyped viruses. Calculated IC50 values displayed. Binding and neutralization data has been repeated in >2 independent assays. Source data are provided as a Source Data file.
Fig. 6
Fig. 6. Cryo-EM in vivo-produced dFabs complexed with stabilized SARS-CoV-2 (WA1/2020) spike trimer.
a–c Cryo-EM density map of 2196 dFab (salmon) complexed to SARS-CoV-2 spike trimer (gray) with RBD indicated (blue). a Side view. b Top view. c Top view with dFab density removed. d–f Cryo-EM density map of 2196 (salmon) and 2130 (green) dFabs complexed to SARS-CoV-2 spike (gray); spike RBD indicated (blue). d Side view. e Top view. f Top view with dFab densities removed.
Fig. 7
Fig. 7. Structural details of the diverse interactions between in vivo-produced dFabs and the SARS-CoV-2 (USA-WA1/2020) spike trimer.
a Structural overview of RBD (blue) in complex with both 2196 (VL in pink; VH in salmon) and 2130 dFabs (VL in gold; VH in green). b 2130 interactions with RBD main chain partners (CDRH3 T102 to RBD R346 peptide bond; RBD 346 to CDRH3 Y100 peptide bond; CDRH3 Y98 top to RBD V445 peptide bond; RBD N450 to CDRH3 Y100 peptide bond) and side chain partners (CHRL1 N30 to RBD S494 and CDRL1 to S30B to RBD 484E). c 2196 interactions with RBD (Q493 engages CDRH2 S54, RBD N481 engages CDRL1 Y32, RBD N487 engages CHRL3 D104 and RBD T478 engages CHRL3 D104). d, e 2130 interactions with RBD via hydrophobic interactions. d CDRL2 W50 packs against RBD G446, G447 and Y449. e CDRH3 G104-P105 packs against RBD L441 and P499. f, g 2196 interacts with RBD via hydrophobic interactions: f hydrophobic cage with RBD F486 formed by CDRL1 Y32, CDRL3 Y91 and W96, CDRH3 P95 and F106. g additional hydrophobic contacts include CDRH1 M30, CDRH2 G53 and RBD L455 and L456. h-i Cation-pi interactions between 2130 and RBD: h CDRL1 30F to RBD Y449. i CDRH3 Y98 to RBD K444.

References

    1. Johns Hopkins Coronavirus Resource Center. COVID-19 Map. https://coronavirus.jhu.edu/map.html. (2022).
    1. Dong Y, et al. The way of SARS-CoV-2 vaccine development: success and challenges. Signal Transduct. Target. Ther. 2021;6:1–14. doi: 10.1038/s41392-021-00796-w. - DOI - PMC - PubMed
    1. Zhou YW, et al. Therapeutic targets and interventional strategies in COVID-19: mechanisms and clinical studies. Signal Transduct. Target. Ther. 2021;6:1–25. doi: 10.1038/s41392-021-00733-x. - DOI - PMC - PubMed
    1. Hwang YC, et al. Monoclonal antibodies for COVID-19 therapy and SARS-CoV-2 detection. J. Biomed. Sci. 2022;29:1–50. doi: 10.1186/s12929-021-00784-w. - DOI - PMC - PubMed
    1. Westendorf, K. et al. LY-CoV1404 (bebtelovimab) potently neutralizes SARS-CoV-2 variants. Cell Rep.39, 110812 (2022). - PMC - PubMed

Publication types