. 2022 Oct 6;13(1):5881.
doi: 10.1038/s41467-022-33572-7.

RNA export through the nuclear pore complex is directional

Affiliations

RNA export through the nuclear pore complex is directional

Asaf Ashkenazy-Titelman et al. Nat Commun. .

Abstract

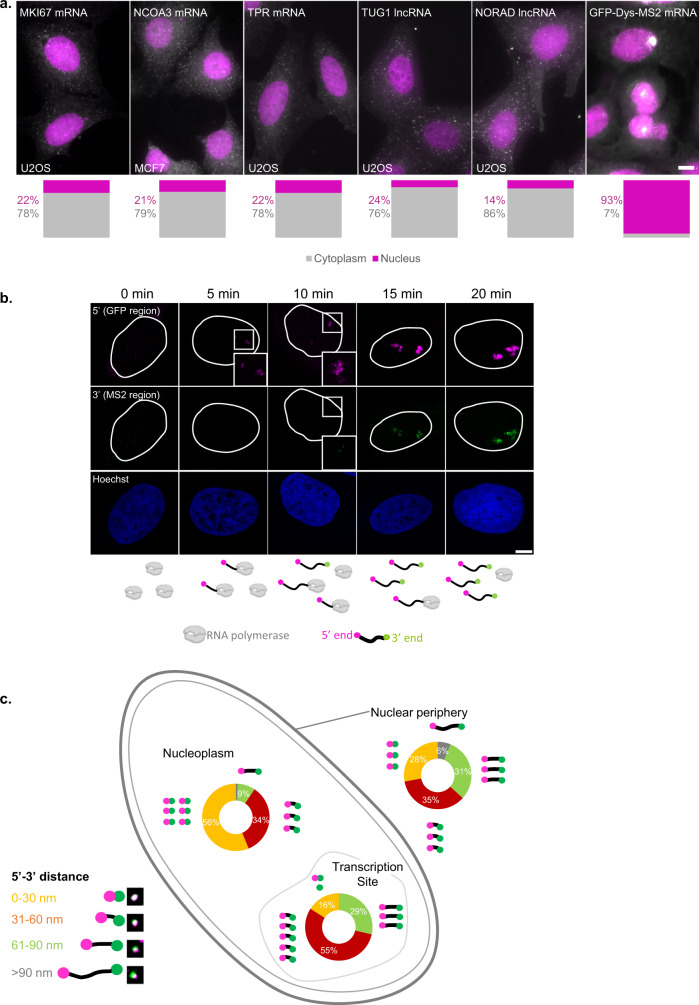
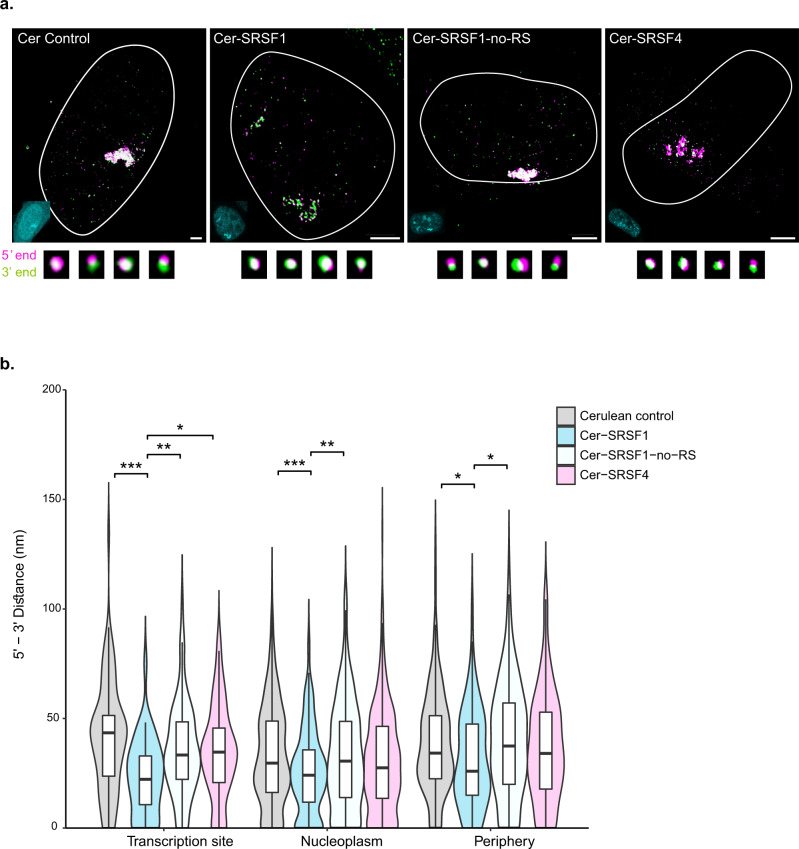
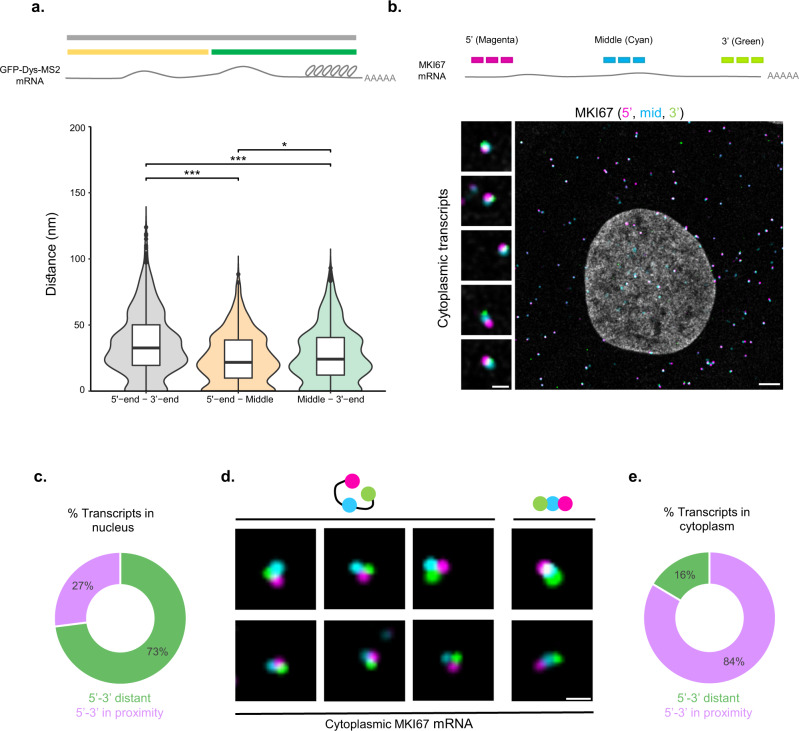
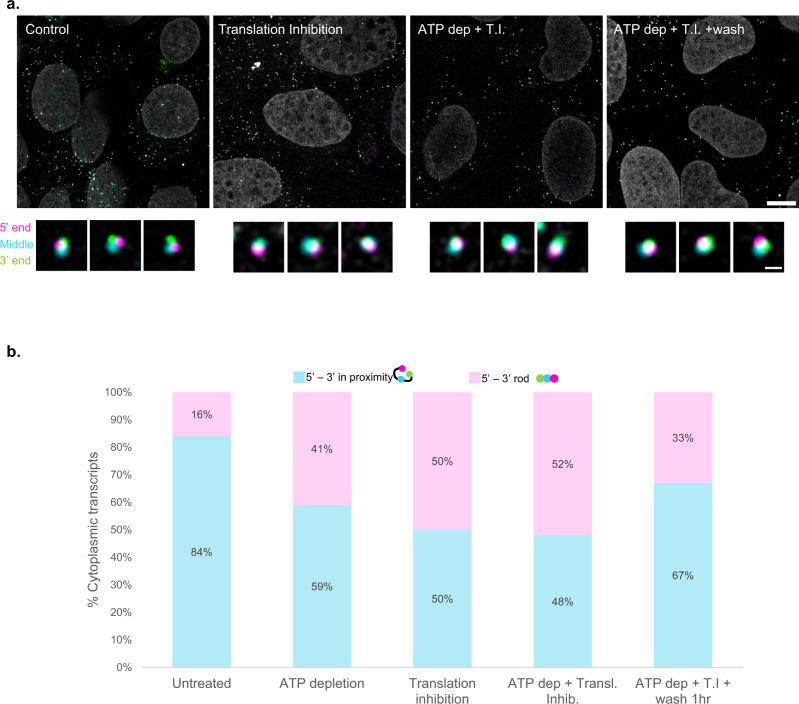
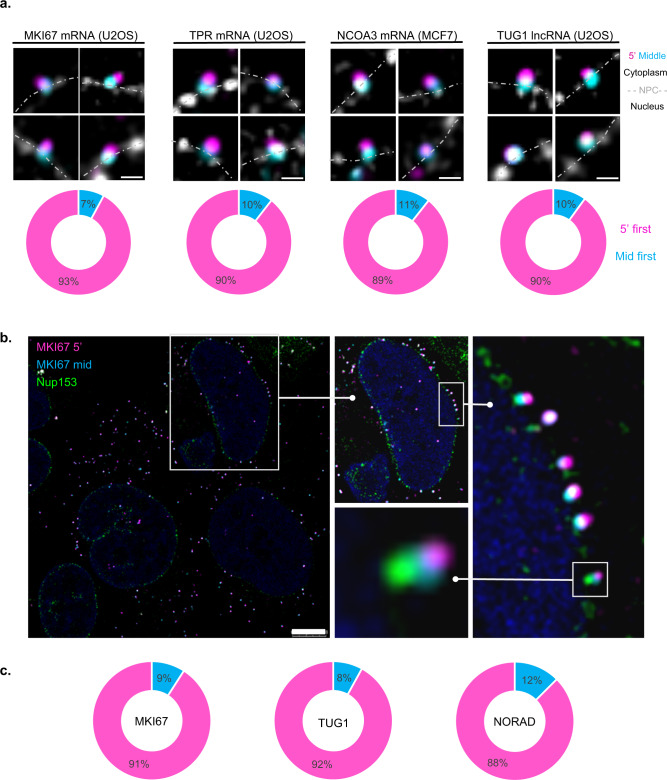
The changes occurring in mRNA organization during nucleo-cytoplasmic transport and export, are not well understood. Moreover, directionality of mRNA passage through the nuclear pore complex (NPC) has not been examined within individual NPCs. Here we find that an mRNP is compact during nucleoplasmic travels compared to a more open structure after transcription and at the nuclear periphery. Compaction levels of nuclear transcripts can be modulated by varying levels of SR proteins and by changing genome organization. Nuclear mRNPs are mostly rod-shaped with distant 5'/3'-ends, although for some, the ends are in proximity. The latter is more abundant in the cytoplasm and can be modified by translation inhibition. mRNAs and lncRNAs exiting the NPC exhibit predominant 5'-first export. In some cases, several adjacent NPCs are engaged in export of the same mRNA suggesting 'gene gating'. Altogether, we show that the mRNP is a flexible structure during travels, with 5'-directionality during export.


Conflict of interest statement

The authors declare no competing interests.

Figures

Fig. 1
Fig. 1. mRNAs change their compaction state during travels through the nucleus.
a Wide-field images showing RNA smFISH on five different mRNA and lncRNA transcripts (white) along with nuclei (magenta) in U2OS and MCF7 cells. Cytoplasm/nucleus (C/N) ratios for each transcript (gray—cytoplasm, magenta—nucleus) are presented below (n = 30 cells for each transcript). Scale bar, 10 µm. b Confocal images showing activated sites of transcription where the 5’-end (magenta) of GFP-Dys is the first to be transcribed, followed by 3’-end (green). The outlines of the nuclei were traced from the Hoechst images. Boxed areas are enlarged. The scheme at the bottom shows the formation of the transcripts at each time point. The scheme was created with BioRender.com. Scale bar, 8 µm. c Summary of the frequency of various 5’–3’ distances measured in the transcripts located in three different regions of the nucleus and the levels of compaction (transcription site, n = 147 transcripts; nucleoplasm, n = 617 transcripts; nuclear periphery, n = 276 transcripts). Each transcript cartoon represents 10% of the total transcripts measured. Examples of images of the various transcripts are shown in the legend. Source data are provided as a Source Data file.
Fig. 2
Fig. 2. The effects of SR overexpression on mRNA compaction.
a Representative cells expressing GFP-Dys-MS2 transcripts transfected with Cerulean-N1, Cer-SRSF1, Cer-SRSF1-no-RS, or Cer-SRSF4. Large foci are the active transcription sites and the small dots are the mRNAs. The outlines of the nuclei were traced from the Hoechst images. Fluorescent images of the nuclei appear at the bottom left (cyan). Examples of various transcripts are shown below. Scale bar, 5 µm. Adjustments to individual color channels were made. b Violin plots depicting changes in mRNA compaction (5’ to 3’ distance measurements) under overexpression of different SR proteins. Cerulean control n = 720 transcripts, Cer-SRSF1 n = 393 transcripts, Cer-SRSF4 n = 508 transcripts, Cer-SRSF1-no-RS n = 508 transcripts. (Transcription site: Kruskal–Wallis, χ2(3) = 17.531, p = 0.0005. Pairwise comparisons- two-sided Mann–Whitney tests with Benjamini–Hochberg FDR correction, Cerulean control vs. Cer-SRSF1 p = 0.0003, Cerulean control vs. Cer-SRSF1-no-RS p = 0.1491, Cerulean control vs. Cer-SRSF4 p = 0.1491, Cer-SRSF1 vs. Cer-SRSF1-no-RS p = 0.0094, Cer-SRSF1 vs. Cer-SRSF4 p = 0.0168, Cer-SRSF1-no-RS vs. Cer-SRSF4 p = 0.9103. Nucleoplasm: Kruskal–Wallis, χ2 (3) = 16.374, p = 0.0009. Pairwise comparisons- two-sided Mann–Whitney tests with Benjamini–Hochberg FDR correction, Cerulean control vs. Cer-SRSF1 p = 0.0005, Cerulean control vs. Cer-SRSF1-no-RS p = 0.6236, Cerulean control vs. Cer-SRSF4 p = 0.1289, Cer-SRSF1 vs. Cer-SRSF1-no-RS p = 0.007, Cer-SRSF1 vs. Cer-SRSF4 p = 0.0594, Cer-SRSF1-no-RS vs. Cer-SRSF4 p = 0.3742. Periphery: Kruskal–Wallis, χ2(3) = 8.2911, p = 0.0403. Pairwise comparisons- two-sided Mann–Whitney tests with Benjamini–Hochberg FDR correction, Cerulean control vs. Cer-SRSF1 p = 0.032, Cerulean control vs. Cer-SRSF1-no-RS p = 0.5516, Cerulean control vs. Cer-SRSF4 p = 0.5516, Cer-SRSF1 vs. Cer-SRSF1-no-RS p = 0.032, Cer-SRSF1 vs. Cer-SRSF4 p = 0.2201, Cer-SRSF1-no-RS vs. Cer-SRSF4 p = 0.4191). *p < 0.05, **p < 0.005, ***p < 0.001. Boxplots show the distance (nm) (center line, median; box limits, upper and lower quartiles; whiskers, 1.5× interquartile range). Source data are provided as a Source Data file.
Fig. 3
Fig. 3. Nucleoplasmic mRNAs are mostly rod-shaped.
a Scheme of the GFP-Dys-MS2 mRNA and the distances measured. Violin plot depicting start-to-end, start-to-middle and middle-to-end distances at three different nuclear regions. 5’–3’ n = 1040; 5’-mid n = 746; mid-3’ n = 917 transcripts. (Kruskal–Wallis, χ2(2) = 12.825, p < 0.0001. Pairwise comparisons—two-sided Mann–Whitney tests with Benjamini–Hochberg FDR correction, 5'-end–3'-end vs. 5'-end-Middle p < 0.0001, 5'-end – 3-end vs. Middle-3'-end p < 0.0001, 5'-end-Middle vs. Middle-3'e-nd p = 0.013). *p < 0.05, ***p < 0.001. Boxplots show the distance (nm) (center line, median; box limits, upper and lower quartiles; whiskers, 1.5× interquartile range; dots, outliers). b Scheme showing the sites of recognition between probe sets and the different mRNAs. MKI67 mRNA in U2OS cells, tagged with three sets of probes (5’—magenta, middle—cyan, 3’— green). Left- enlargements of example mRNAs demonstrating several orientations of the mRNA. Scale bar, 5 µm. c Plot showing the shape of nuclear MKI67 transcripts in U2OS cells (5' and 3'-ends are separate), n = 100 transcripts. d Triple-tagged single mRNA transcripts in the U2OS cytoplasm (5’— magenta, middle—cyan, 3’—green). e A plot showing the shape of cytoplasmic MKI67 transcripts in U2OS cells (5' and 3'-ends are adjacent), n = 158 transcripts. Adjustments to individual color channels were made. Source data are provided as a Source Data file.
Fig. 4
Fig. 4. ATP levels and translation state affect mRNA compaction in a reversible manner.
a MKI67 transcripts in U2OS cells, tagged in the 5’ (magenta), middle (cyan) and 3’-end (green) of the transcript, along with images of single transcripts (enhanced). Scale bars, 10, 0.5 µm. Adjustments to individual color channels were made. b Histograms depicting the percentages of the orientation between the 5’ and 3’-ends of triple-tagged MKI67 transcripts in the U2OS cytoplasm, under various treatments. Untreated n = 158, ATP depletion n = 124, translation inhibition n = 100, translation inhibition + ATP depletion n = 131, translation inhibition + ATP depletion + wash n = 143 transcripts. Source data are provided as a Source Data file.
Fig. 5
Fig. 5. Export directionality of endogenous mRNAs and lncRNAs.
a MKI67, TPR, NCOA3 mRNAs and TUG1 lncRNA double-tagged transcripts in their 5' and middle regions (5’—magenta, middle—cyan) together with POM121-Cer labeling (gray). Charts describing the percentage of transcripts exiting the pore in a 5’-manner (magenta) or middle-first (cyan). MKI67 n = 105, TPR n = 50, NCOA3 n = 53, TUG1 n = 30 transcripts. Dotted line—nuclear borders; cytoplasm above and nucleus below the line. Scale bar, 0.5 µm. b Double-tagged MKI67 transcripts (5’—magenta, middle—cyan) with endogenous Nup153-mNeonGreen labeling (green). Enlargements are shown in boxes. Scale bar, 8 µm. c Charts describing the percentage of transcripts exiting the pore in a 5’-manner (magenta) or middle-first (cyan) in cells expressing Nup153-mNeonGreen. MKI67 n = 121, TUG1 n = 50, NORAD n = 40 transcripts. Adjustments to individual color channels were made. Source data are provided as a Source Data file.

References

    1. Bentley DL. Rules of engagement: co-transcriptional recruitment of pre-mRNA processing factors. Curr. Opin. Cell Biol. 2005;17:251–256. doi: 10.1016/j.ceb.2005.04.006. - DOI - PubMed
    1. Bjork P, Wieslander L. Integration of mRNP formation and export. Cell. Mol. Life Sci. 2017;74:2875–2897. doi: 10.1007/s00018-017-2503-3. - DOI - PMC - PubMed
    1. Kohler A, Hurt E. Exporting RNA from the nucleus to the cytoplasm. Nat. Rev. Mol. Cell Biol. 2007;8:761–773. doi: 10.1038/nrm2255. - DOI - PubMed
    1. Singh G, et al. The cellular EJC interactome reveals higher-order mRNP structure and an EJC–SR protein nexus. Cell. 2012;151:915–916. doi: 10.1016/j.cell.2012.10.032. - DOI - PubMed
    1. Sapra AK, et al. SR protein family members display diverse activities in the formation of nascent and mature mRNPs in vivo. Mol. Cell. 2009;34:179–190. doi: 10.1016/j.molcel.2009.02.031. - DOI - PubMed

Publication types

MeSH terms