. 2022 Oct 6;12(1):16793.
doi: 10.1038/s41598-022-19994-9.

Structure-function clustering in weighted brain networks

Affiliations

Structure-function clustering in weighted brain networks

Jonathan J Crofts et al. Sci Rep. .

Abstract

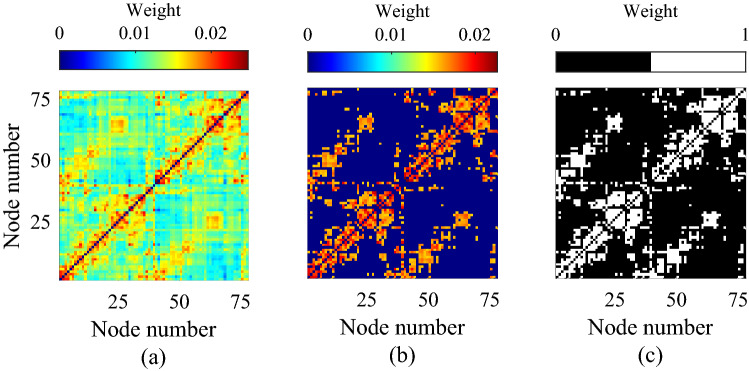
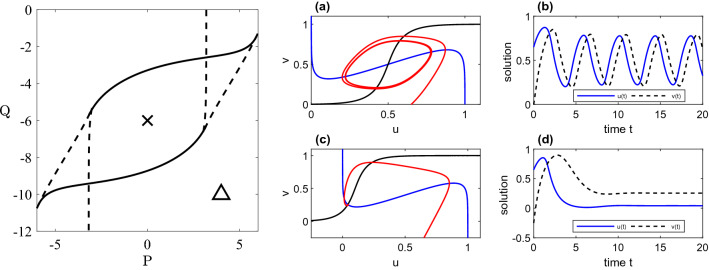
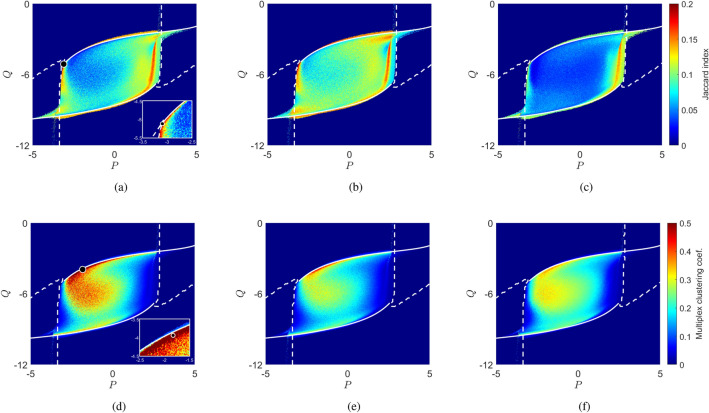
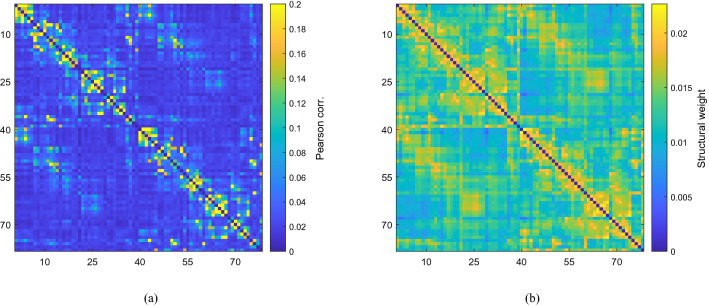
Functional networks, which typically describe patterns of activity taking place across the cerebral cortex, are widely studied in neuroscience. The dynamical features of these networks, and in particular their deviation from the relatively static structural network, are thought to be key to higher brain function. The interactions between such structural networks and emergent function, and the multimodal neuroimaging approaches and common analysis according to frequency band motivate a multilayer network approach. However, many such investigations rely on arbitrary threshold choices that convert dense, weighted networks to sparse, binary structures. Here, we generalise a measure of multiplex clustering to describe weighted multiplexes with arbitrarily-many layers. Moreover, we extend a recently-developed measure of structure-function clustering (that describes the disparity between anatomical connectivity and functional networks) to the weighted case. To demonstrate its utility we combine human connectome data with simulated neural activity and bifurcation analysis. Our results indicate that this new measure can extract neurologically relevant features not readily apparent in analogous single-layer analyses. In particular, we are able to deduce dynamical regimes under which multistable patterns of neural activity emerge. Importantly, these findings suggest a role for brain operation just beyond criticality to promote cognitive flexibility.


Conflict of interest statement

The authors declare no competing interests.

Figures

Figure 1
Figure 1
The structural matrix (a) is derived from DTI data taken from the Human Connectome Project and parcellated on to a 78–region brain atlas. This is thresholded to keep the top 23% strongest connections (b) and binarised by setting all retained edge strengths to unity in (c).
Figure 2
Figure 2
Bifurcation sets and numerical simulations for a single Wilson–Cowan node (12), (13) with c1=c2=c3=10 and c4=-2. LHS: The dashed curve denotes the saddle-node bifurcation set and the solid curve the Hopf bifurcation set. RHS: (a, b) and (c, d) display phase plane and time courses for oscillatory and steady state solutions (for parameter values indicated by the cross and triangle in the left-hand panel) of Eqs. (12), (13) with ϵ=0.
Figure 3
Figure 3
Comparison of the Jaccard index (top row) and structure-function clustering (bottom row) as a function of the basal input parameters (PQ) for the three different cortical representations considered in our investigations: (a,d) weighted network; (b,e) weighted topological network; and (c,f) binary network. Bifurcation sets for each network, obtained as described in “Large-scale neural dynamics” section are superimposed in white; the dashed curve denotes the saddle-node bifurcation set and the solid curve the Hopf bifurcation. Specific parameter choices (P,Q)=(-3.1,-5.12) and (-1.83,-3.94) explored in further detail in Figs. 4, 5 are highlighted by the markers in panels (a) and (d). Insets show their positions relative to the boundaries of the region of interest and regions of high and low structure-function similarity and clustering.
Figure 4
Figure 4
For (PQ) values close to criticality the simulated functional connectivity (a) is found to resemble the empirical structural connectivity (b). The displayed functional connectivity network was obtained by averaging 100 simulations for specific parameter values (P,Q)=(-3.10,-5.12), which are highlighted by a circle in Fig. 3a; the corresponding Jaccard index is 0.195, and across realisations we observe maximal deviation in this value of 13%.
Figure 5
Figure 5
Simulated functional connectivity matrices deploying the weighted structural network with specific parameter values (P,Q)=(-1.83,-3.94), which are highlighted by a circle in Fig. 3d. For these parameter values the network is capable of attaining a range of functional configurations, (af), under variation of the initial conditions. For these parameter values the network is capable of attaining a range of functional configurations under variation of the initial conditions. Across 100 realisations, we observe deviations in the Jaccard index of 50% around a mean value 0.02.

References

    1. Lo Y-P, O’Dea R, Crofts JJ, Han CE, Kaiser M. A geometric network model of intrinsic grey-matter connectivity of the human brain. Sci. Rep. 2015;5:1–14. doi: 10.1038/srep15397. - DOI - PMC - PubMed
    1. Pinotsis DA, et al. Linking canonical microcircuits and neuronal activity: Dynamic causal modelling of laminar recordings. NeuroImage. 2017;146:355–366. doi: 10.1016/j.neuroimage.2016.11.041. - DOI - PMC - PubMed
    1. Shamir I, Assaf Y. An MRI-based, data-driven model of cortical laminar connectivity. Neuroinformatics. 2020;19:1–14. - PubMed
    1. Betzel RF, et al. The modular organization of human anatomical brain networks: Accounting for the cost of wiring. Netw. Neurosci. 2017;1:42–68. doi: 10.1162/NETN_a_00002. - DOI - PMC - PubMed
    1. van den Heuvel MP, Sporns O. Network hubs in the human brain. Trends Cogn. Sci. 2013;17:683–696. doi: 10.1016/j.tics.2013.09.012. - DOI - PubMed

Publication types