. 2022 Oct 6;8(1):126.
doi: 10.1038/s41531-022-00397-6.

Lysosomal lipid alterations caused by glucocerebrosidase deficiency promote lysosomal dysfunction, chaperone-mediated-autophagy deficiency, and alpha-synuclein pathology

Affiliations

Lysosomal lipid alterations caused by glucocerebrosidase deficiency promote lysosomal dysfunction, chaperone-mediated-autophagy deficiency, and alpha-synuclein pathology

Alba Navarro-Romero et al. NPJ Parkinsons Dis. .

Abstract

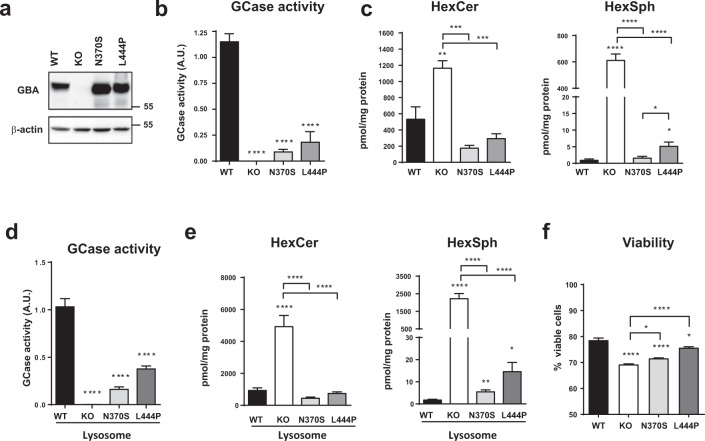
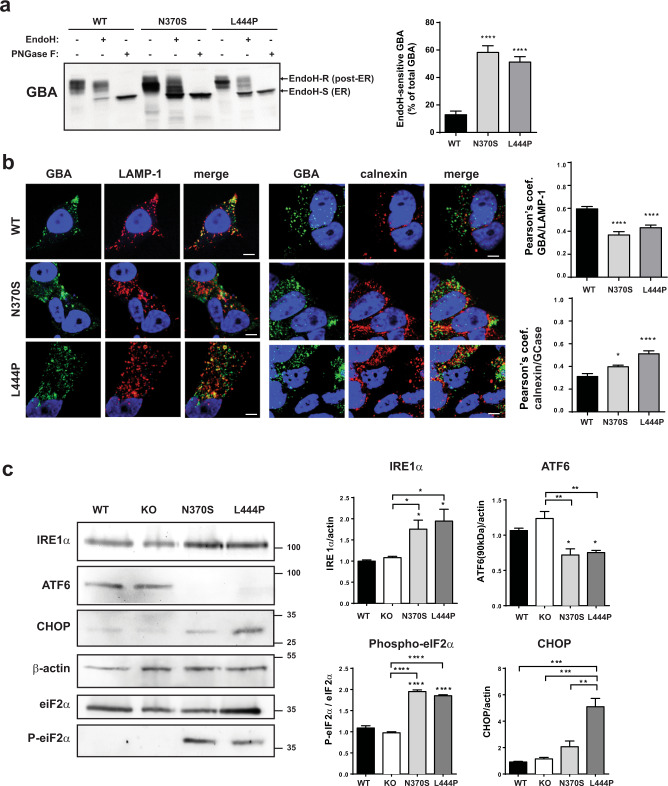
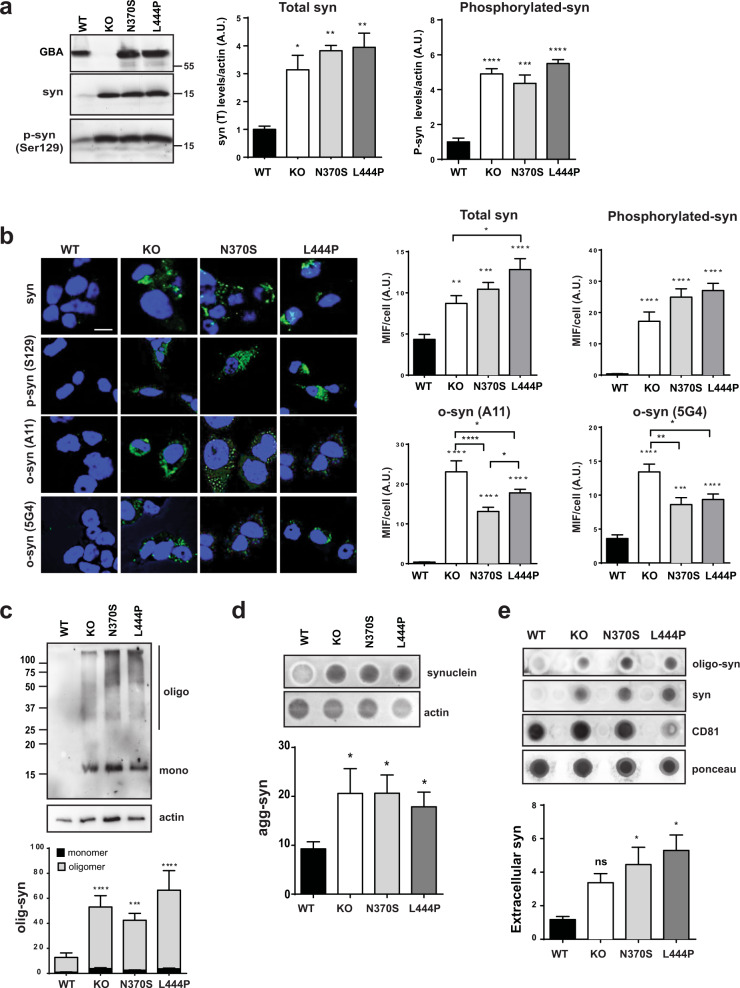
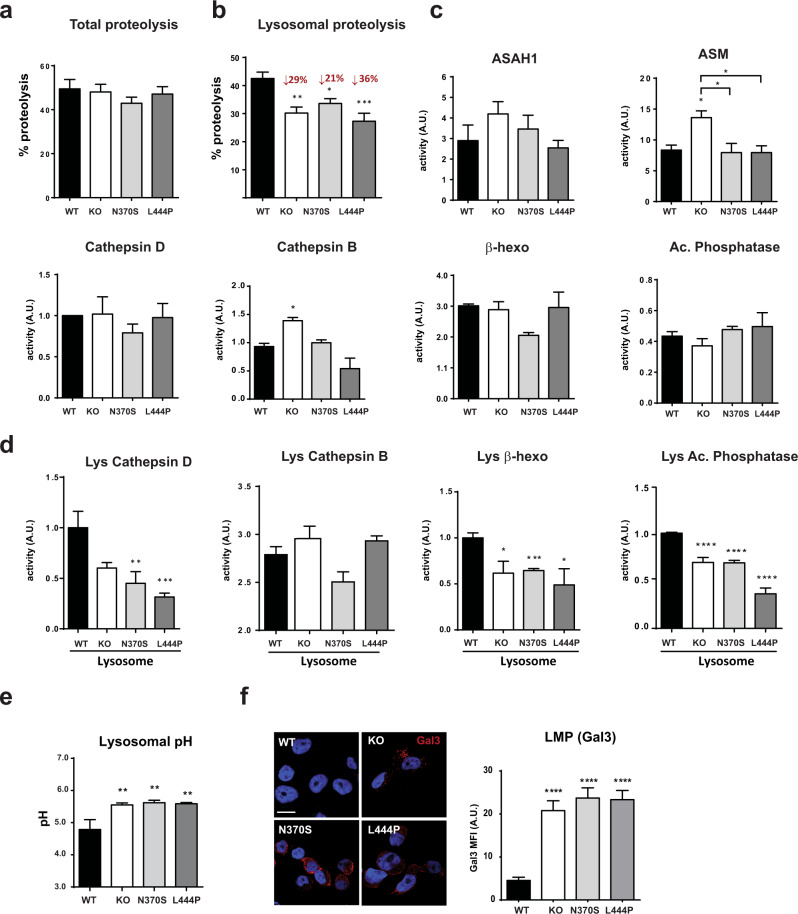
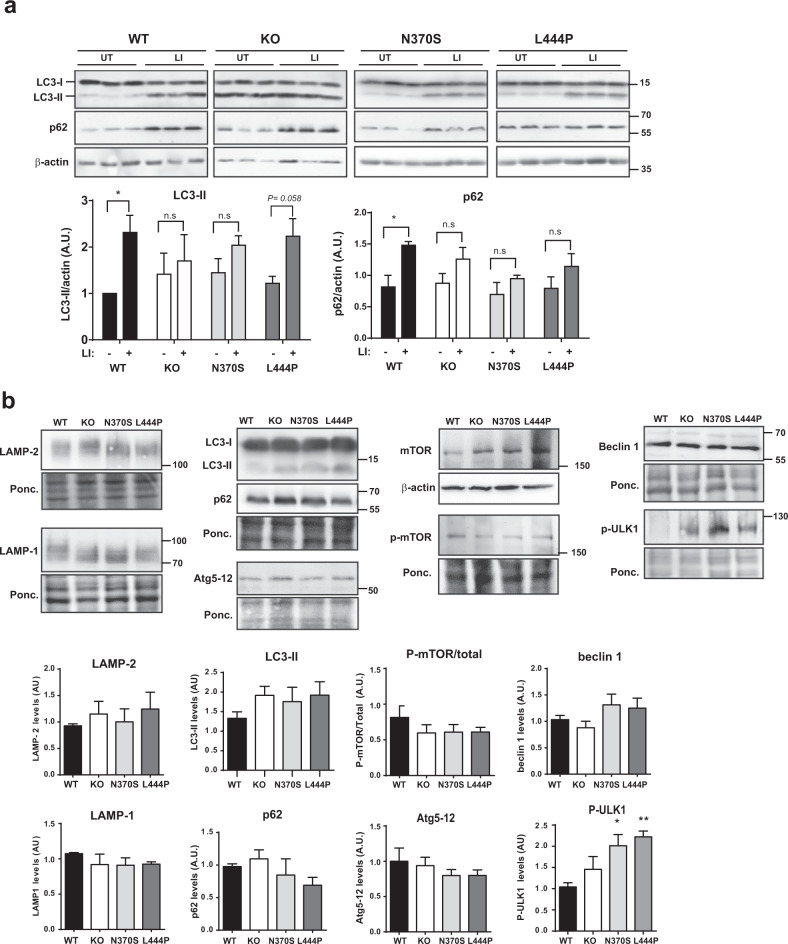
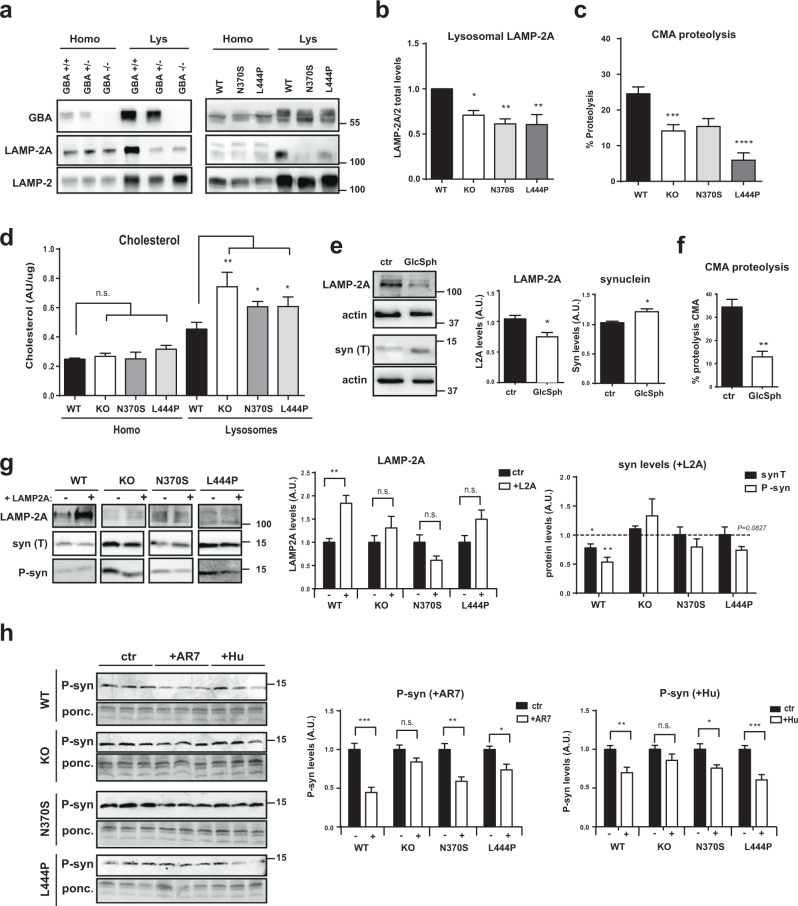
Mutations in the GBA gene that encodes the lysosomal enzyme β-glucocerebrosidase (GCase) are a major genetic risk factor for Parkinson's disease (PD). In this study, we generated a set of differentiated and stable human dopaminergic cell lines that express the two most prevalent GBA mutations as well as GBA knockout cell lines as a in vitro disease modeling system to study the relationship between mutant GBA and the abnormal accumulation of α-synuclein. We performed a deep analysis of the consequences triggered by the presence of mutant GBA protein and the loss of GCase activity in different cellular compartments, focusing primarily on the lysosomal compartment, and analyzed in detail the lysosomal activity, composition, and integrity. The loss of GCase activity generates extensive lysosomal dysfunction, promoting the loss of activity of other lysosomal enzymes, affecting lysosomal membrane stability, promoting intralysosomal pH changes, and favoring the intralysosomal accumulation of sphingolipids and cholesterol. These local events, occurring only at a subcellular level, lead to an impairment of autophagy pathways, particularly chaperone-mediated autophagy, the main α-synuclein degradative pathway. The findings of this study highlighted the role of lysosomal function and lipid metabolism in PD and allowed us to describe a molecular mechanism to understand how mutations in GBA can contribute to an abnormal accumulation of different α-synuclein neurotoxic species in PD pathology.


Conflict of interest statement

The authors declare no competing interests.

Figures

Fig. 1
Fig. 1. Loss of lysosomal GCase activity leads to substrate accumulation in GBA mutant cells.
a Immunodetection of GBA protein; b GCase activity in total homogenate corrected by levels GBA protein, n = 3 in each group. c Quantification of total HexCer (left) and total HexSph (right) by LC/MS-MS, n = 3 in each group. d Lysosomal GCase activity in isolated lysosomal fractions, n = 4 independent isolations in each group. e Quantification of HexCer (left) and HexSph (right) by LC/MS-MS, n = 3–4 in each group. f Cellular viability, n = 6 independent samples. In all panels, data is presented as mean ± s.e.m. Statistical significance was established at *p < 0.05, **p < 0.01, ***p < 0.001, ****p < 0.0001 compared to WT samples or between mutant lines when indicated after one-way ANOVA followed by Tukey’s multiple comparisons test.
Fig. 2
Fig. 2. Mutant GBA proteins are retained in the ER.
a Left: representative immunoblots of GBA before and after treatment with EndoH and PNGase F (as a positive control). b Right: quantification of GBA EndoH-sensitive (EndoH-S) percentage of total GBA protein, n = 8 independent experiments. Representative images and quantification of the colocalization of GBA with LAMP-1 (lysosomes) and calnexin (ER) determined by immunofluorescence. Colocalization was represented as Pearson’s coefficient (fraction of LAMP-1 or calnexin overlapping GBA), scale bar = 5 µM, n > 20 cells/condition. c Representative immunoblots and quantification of ER stress markers (IRE1α, ATF6, phosphorylated eIF2a, and CHOP), n = 3 independent experiments. In all panels data are presented as mean ± s.e.m, statistical significance was established at *p < 0.05, **p < 0.01, ***p < 0.001, ****p < 0.0001 compared to WT samples or between mutant lines when indicated after one-way ANOVA followed by Tukey’s multiple comparisons test.
Fig. 3
Fig. 3. Mutant GBA accumulates different α-syn species.
a Representative immunoblots and quantification of total synuclein and phosphorylated synuclein (Ser129). b Representative confocal images and quantification of the mean fluorescence intensity (MFI) of total α-syn, phosphorylated (Ser129) α-syn, and oligomeric α-syn (A11 and 5G4 antibodies) determined by immunofluorescence, scale bar = 10 µM, n > 20 cells/condition. c Immunodetection and quantification of oligomeric α-syn by in vivo cross-linking with DSG. d Insoluble α-syn detection and quantification using the filter retardation assay in acetate cellulose membrane after in vivo cross-linking treatment. e Extracellular α-syn detected by dot blotting from an extracellular culture medium with anti-synuclein and anti-oligomeric synuclein (A11); CD81 (extracellular vesicle surface protein) was used as a marker of extracellular vesicle present in the extracellular fraction. C–E: results of at least three independent experiments. In all panels, data is presented as mean ± s.e.m, statistical significance was established at *p < 0.05, **p < 0.01, ***p < 0.001, ****p < 0.0001 compared to WT samples or between mutant lines when indicated after one-way ANOVA followed by Tukey’s multiple comparisons test.
Fig. 4
Fig. 4. Mutant GBA exhibit lysosomal dysfunction.
a Total proteolysis measured by an intracellular protein assay, n = 12. b Lysosomal proteolysis measured by an intracellular protein assay, n = 12. c Enzymatic activity of lysosomal enzymes in total homogenates, n = 3–6 independent samples. d Enzymatic activity of lysosomal enzymes in lysosomal-enriched fractions, n > 3 independent isolations in each group. e Lysosomal pH quantification, n = 6 in each group. f Representative images and quantification of galectin-3 (red) determined by immunofluorescence. Nuclei are labeled with Hoechst 33342, scale bar = 10 µm, n = 30 cells/conditions. In all panels, data are presented as mean ± s.e.m. Statistical significance was established at *p < 0.05, ** p < 0.01, ***p < 0.001, ****p < 0.0001 compared to WT samples or between mutant lines when indicated after one-way ANOVA followed by Tukey’s multiple comparisons test.
Fig. 5
Fig. 5. Mutant GBA causes alterations in macroautophagy.
a Autophagic flux: immunodetection and quantification of LC3-II and p62 in the presence and absence of the lysosomal inhibitor (LI) 60 µM chloroquine. Results are presented as mean ± s.e.m. values of three independent experiments. Statistical significance was established at *p < 0.05 compared to untreated conditions by two-tailed unpaired Student’s t-test. b Representative immunoblots and quantification of autophagic and lysosomal markers. In all panels, results are presented as mean ± s.e.m. values of at least six independent experiments. Statistical significance was established at *p < 0.05, **p < 0.01, compared to WT samples after one-way ANOVA followed by Tukey’s multiple comparisons test.
Fig. 6
Fig. 6. Mutant GBA is associated with CMA impairment.
a Immunodetection of LAMP-2A, total LAMP-2, and GBA in total homogenate (homo) and isolated lysosomes (Lys). b Quantification of LAMP-2A levels in the lysosomal fraction corrected using total LAMP-2, n = 4 independent isolations. c Proteolysis dependent on CMA detected as 3-MA-insensitive/leupeptin-NH4Cl-sensitive proteolytic activity, n > 4 in each group. d Total cholesterol quantification in homogenate (homo) and isolated lysosomes (Lysosomes) n = 6. e Quantification of total LAMP-2A and total synuclein levels in GBA WT cell lines after 72 h treatment with 5 mM GlcSph, n = 3. f Proteolysis dependent on CMA detected as 3-MA-insensitive/leupeptin/NH4Cl-sensitive proteolytic activity after 72 h treatment with 5 mM GlcSph, n = 3. g Representative images (left) of immunodetection of LAMP-2A and total/phosphorylated synuclein after 48 h of transient transfection. Quantification (right) of LAMP-2A transfection (LAMP-2A levels in control transfection in each cell line normalized to 1) and total and phosphorylated α-syn after transfection (syn protein levels in control transfection in each cell line normalized to 1), values of three independent experiments. h Immunodetection of phosphorylated synuclein (P-syn) and ponceau (ponc) as a loading control after 24 h treatment with AR7 and humanin (Hu) (left), and quantification of P-syn levels (left) [P-syn levels in cells treated with vehicle (ctr) in each cell line are normalized to 1]; values of six independent samples. In all panels, results are presented as mean ± s.e.m values. Statistical significance was established at * p < 0.05, **p < 0.01 after two-way ANOVA followed by Tukey’s multiple comparisons tests (bd) or two-tailed unpaired Student’s t-test (eh).

References

    1. Tysnes OB, Storstein A. Epidemiology of Parkinson’s disease. J. Neural Transm. 2017;124:901–905. doi: 10.1007/s00702-017-1686-y. - DOI - PubMed
    1. Dehay B, et al. Targeting α-synuclein for treatment of Parkinson’s disease: mechanistic and therapeutic considerations. Lancet Neurol. 2015;14:855–866. doi: 10.1016/S1474-4422(15)00006-X. - DOI - PMC - PubMed
    1. Neumann J, et al. Glucocerebrosidase mutations in clinical and pathologically proven Parkinson’s disease. Brain. 2009;132:1783–1794. doi: 10.1093/brain/awp044. - DOI - PMC - PubMed
    1. Sidransky E, et al. Multicenter analysis of glucocerebrosidase mutations in Parkinson’s disease. N. Engl. J. Med. 2009;361:1651–1661. doi: 10.1056/NEJMoa0901281. - DOI - PMC - PubMed
    1. Lesage S, et al. Large-scale screening of the Gaucher’s disease-related glucocerebrosidase gene in Europeans with Parkinson’s disease. Hum. Mol. Genet. 2011;20:202–210. doi: 10.1093/hmg/ddq454. - DOI - PubMed