. 2023 Jan;17(1):59-69.
doi: 10.1038/s41396-022-01324-6. Epub 2022 Oct 6.

Single-cell view of deep-sea microbial activity and intracommunity heterogeneity

Affiliations

Single-cell view of deep-sea microbial activity and intracommunity heterogeneity

N Arandia-Gorostidi et al. ISME J. 2023 Jan.

Abstract

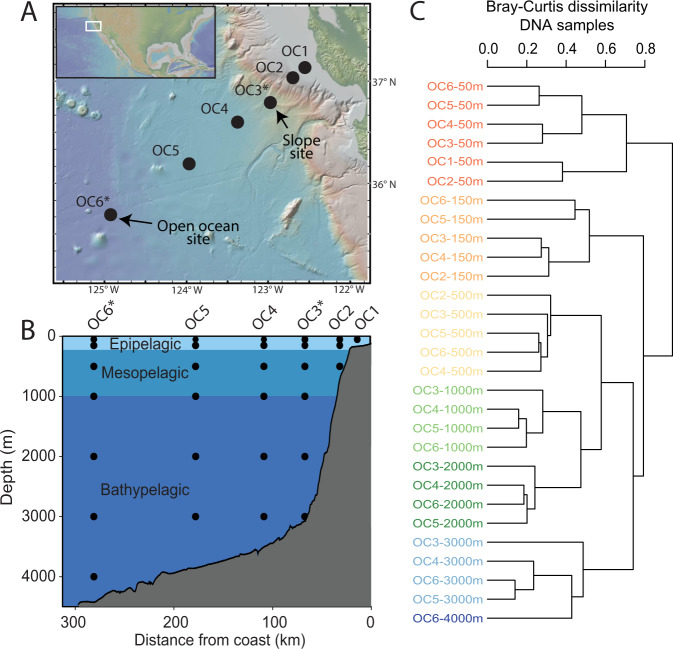
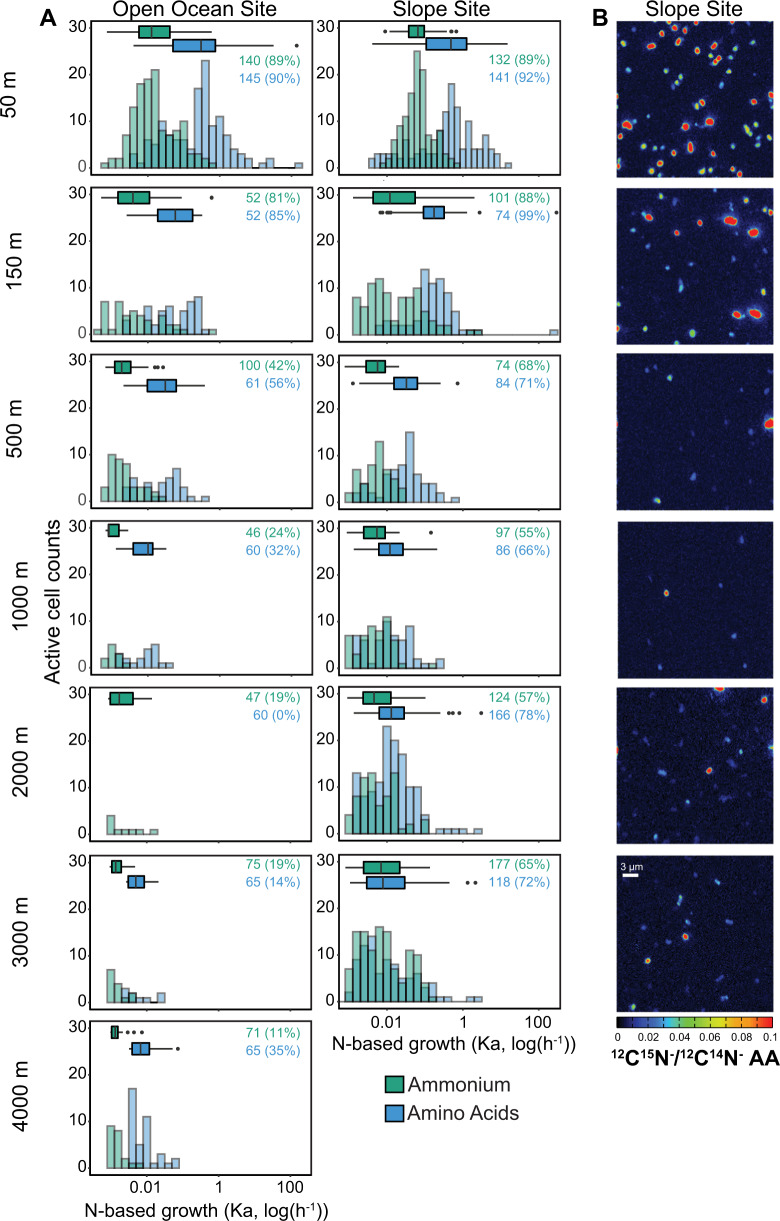
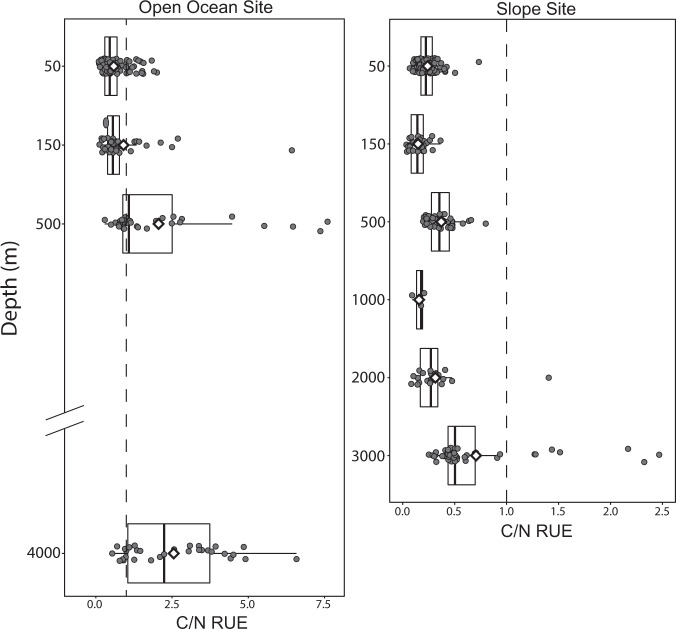
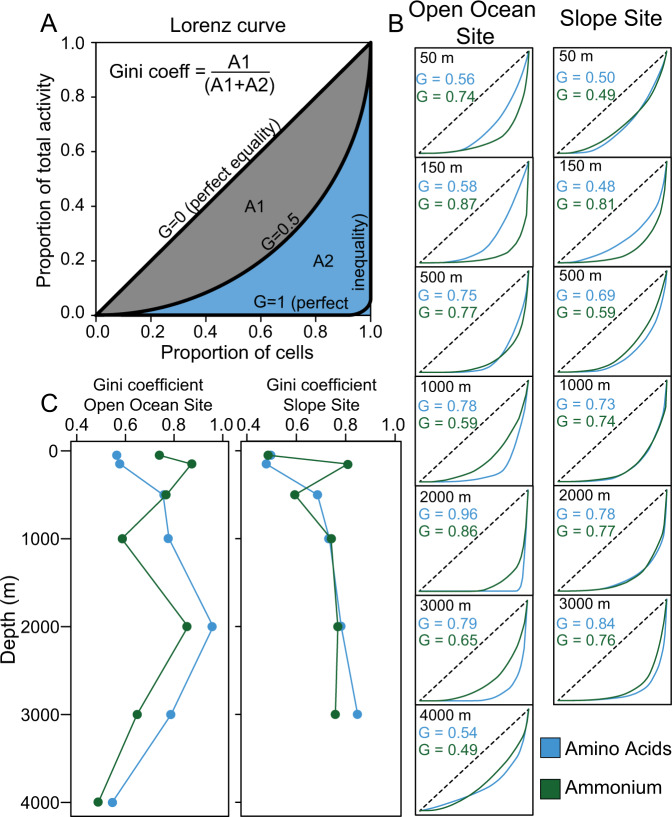
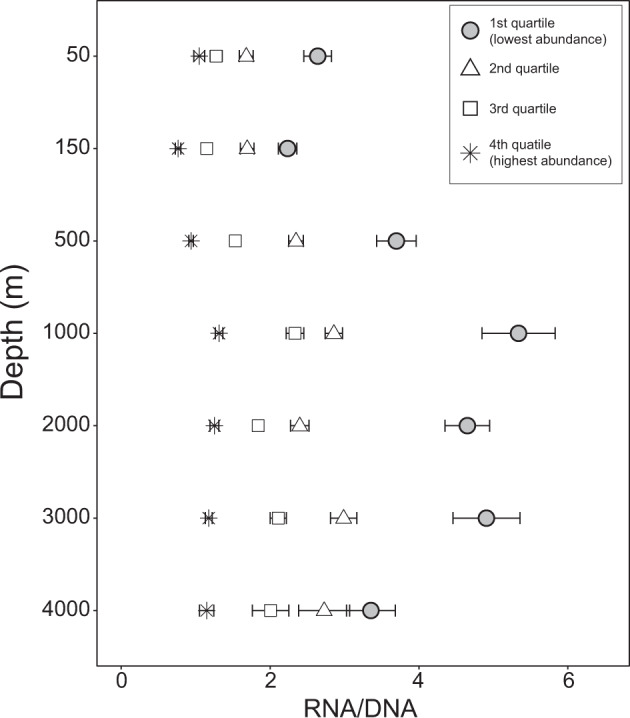
Microbial activity in the deep sea is cumulatively important for global elemental cycling yet is difficult to quantify and characterize due to low cell density and slow growth. Here, we investigated microbial activity off the California coast, 50-4000 m water depth, using sensitive single-cell measurements of stable-isotope uptake and nucleic acid sequencing. We observed the highest yet reported proportion of active cells in the bathypelagic (up to 78%) and calculated that deep-sea cells (200-4000 m) are responsible for up to 34% of total microbial biomass synthesis in the water column. More cells assimilated nitrogen derived from amino acids than ammonium, and at higher rates. Nitrogen was assimilated preferentially to carbon from amino acids in surface waters, while the reverse was true at depth. We introduce and apply the Gini coefficient, an established equality metric in economics, to quantify intracommunity heterogeneity in microbial anabolic activity. We found that heterogeneity increased with water depth, suggesting a minority of cells contribute disproportionately to total activity in the deep sea. This observation was supported by higher RNA/DNA ratios for low abundance taxa at depth. Intracommunity activity heterogeneity is a fundamental and rarely measured ecosystem parameter and may have implications for community function and resilience.


Conflict of interest statement

The authors declare no competing interests.

Figures

Fig. 1
Fig. 1. Sampling location and dissimilarities in the microbial community composition between samples.
Maps of the northeastern Pacific Ocean showing (A) sampling locations and (B) sampling water depths. Asterisks indicate the two sites where stable isotope labeling experiments were conducted. Maps were generated with GeoMapApp version 3.6.12. C Neighbor-joining tree generated from the Bray–Curtis dissimilarity matrix for DNA samples for the different study sites and depths. Water depth at which the sample was collected is indicated by different colors.
Fig. 2
Fig. 2. Proportion of active microbial cells with water depth.
Percentage of active microbial cells determined by 15N-uptake from amino acids or ammonium with depth at the A Open Ocean and B Slope sites.
Fig. 3
Fig. 3. Magnitude and distribution of microbial activity.
A Histograms of N-based cell-specific growth for 15N-amino acids (blue) and 15N-ammonium (green) in log10 scale for each depth of the Open ocean (left) and Slope sites (right). Histogram bar-width represent a range of Ka = 0.15 for 50 m and Ka = 0.3 for the rest of the depths. Only active cells are displayed. Boxplots indicate the median and the upper and lower quartiles. Inset text indicate the total number of analyzed cells and the percentage of active cells in parentheses. B NanoSIMS 12C15N/12C14N isotope ratio images showing enrichment of 15N from 15N-amino acids (AA) at the Slope site. Only active (15N-enriched) cells are visible.
Fig. 4
Fig. 4. Boxplot of C/N relative use efficiency in cells assimilating both C and N from amino acids.
White diamonds indicate the mean value. Dashed lines indicate a value of 1.
Fig. 5
Fig. 5. Intracommunity heterogeneity in microbial anabolic activity.
A Schematic representation of Lorenz curve and the Gini coefficient calculations. B Lorenz curves and Gini coefficients by depth for the Open ocean (left) and Slope sites (right). Dotted line shows perfectly even distribution of cell-specific activity. C Changes of Gini coefficient with depth for amino acid (blue) and ammonium (green) incubations, in the Slope Site (right) and Open Ocean (left) sites.
Fig. 6
Fig. 6. Average RNA/DNA ratio for ASVs divided into DNA relative abundance quartiles by depth, integrated between all study sites.
Error bars indicate standard error.

Similar articles

Cited by

References

    1. Orcutt BN, Sylvan JB, Knab NJ, Edwards KJ. Microbial ecology of the dark ocean above, at, and below the seafloor. Microbiol Mol Biol Rev. 2011;75:361–422. doi: 10.1128/MMBR.00039-10. - DOI - PMC - PubMed
    1. Whitman WB, Coleman DC, Wiebe WJ. Prokaryotes: the unseen majority. Proc Natl Acad Sci USA. 1998;95:6578–83. doi: 10.1073/pnas.95.12.6578. - DOI - PMC - PubMed
    1. Arístegui J, Gasol JM, Duarte CM, Herndl GJ. Microbial oceanography of the dark ocean's pelagic realm. Limnol Oceanogr. 2009;54:1501–29. doi: 10.4319/lo.2009.54.5.1501. - DOI
    1. Ebrahimi A, Schwartzman J, Cordero OX. Cooperation and spatial self-organization determine rate and efficiency of particulate organic matter degradation in marine bacteria. Proc Natl Acad Sci USA. 2019;116:23309–16. doi: 10.1073/pnas.1908512116. - DOI - PMC - PubMed
    1. Fontanez KM, Eppley JM, Samo TJ, Karl DM, DeLong EF. Microbial community structure and function on sinking particles in the North Pacific Subtropical Gyre. Front Microbiol. 2015;6:469. doi: 10.3389/fmicb.2015.00469. - DOI - PMC - PubMed

Publication types