. 2022 Oct 6;12(1):16728.
doi: 10.1038/s41598-022-21144-0.

Estimation of the mutation rate of Mycobacterium tuberculosis in cases with recurrent tuberculosis using whole genome sequencing

Collaborators, Affiliations

Estimation of the mutation rate of Mycobacterium tuberculosis in cases with recurrent tuberculosis using whole genome sequencing

Jessica Comín et al. Sci Rep. .

Erratum in

Abstract

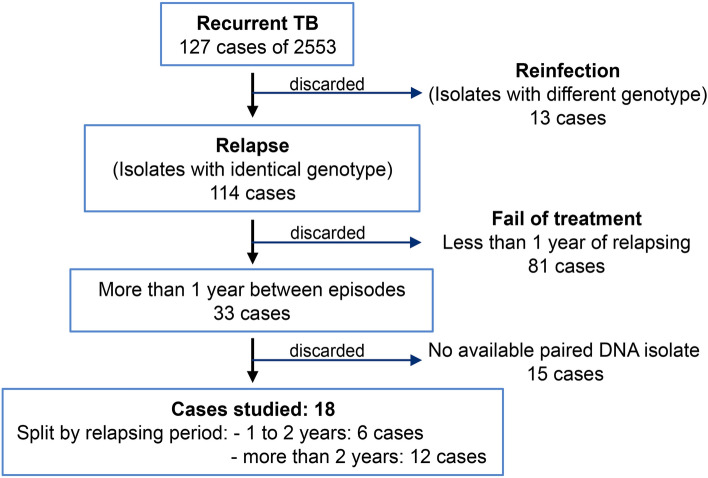
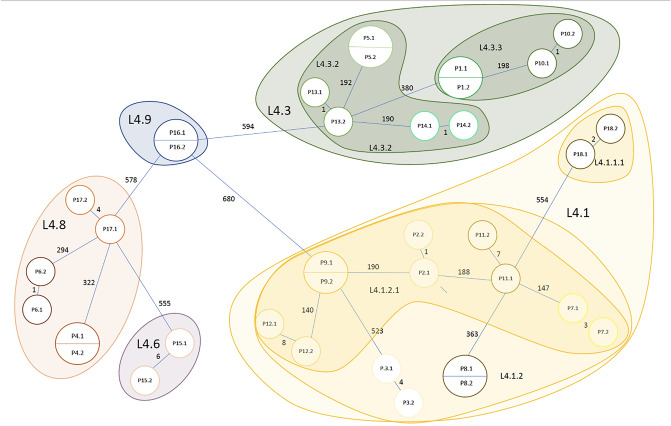
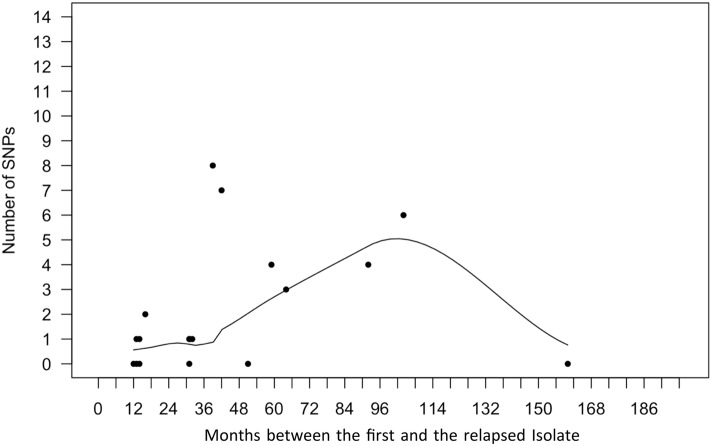
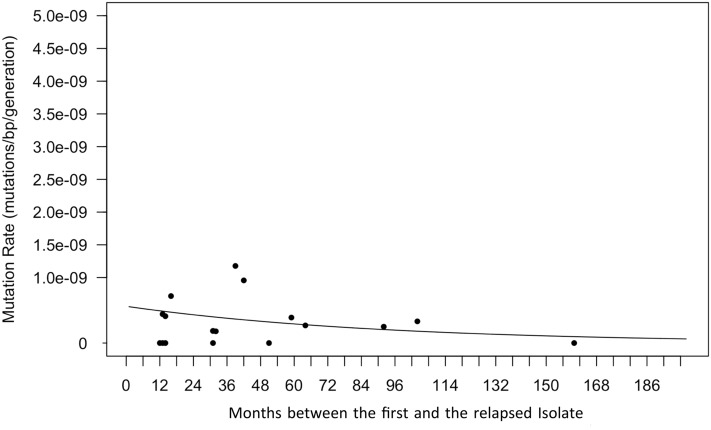
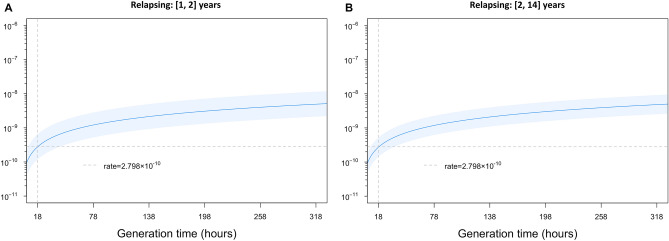
The study of tuberculosis latency is problematic due to the difficulty of isolating the bacteria in the dormancy state. Despite this, several in vivo approaches have been taken to mimic the latency process. Our group has studied the evolution of the bacteria in 18 cases of recurrent tuberculosis. We found that HIV positive patients develop recurrent tuberculosis earlier, generally in the first two years (p value = 0.041). The genome of the 36 Mycobacterium tuberculosis paired isolates (first and relapsed isolates) showed that none of the SNPs found within each pair was observed more than once, indicating that they were not directly related to the recurrence process. Moreover, some IS6110 movements were found in the paired isolates, indicating the presence of different clones within the patient. Finally, our results suggest that the mutation rate remains constant during all the period as no correlation was found between the number of SNPs and the time to relapse.


Conflict of interest statement

The authors declare no competing interests.

Figures

Figure 1
Figure 1
Diagram with the discarded and selected cases for the recurrent cases study.
Figure 2
Figure 2
Drawing of a minimal spanning tree (not scaled) with all the studied isolates. The number of SNPs and the TB lineages are indicated.
Figure 3
Figure 3
Scatter plot showing the number of SNPs developed between the first and the relapsed isolate of the patient versus time between the diagnosis of both isolates (in months). A Poisson regression model was used. A trend of increase in the number of SNPs is observed as the months of relapsing period increase, however, it was not significant (p value = 0.34).
Figure 4
Figure 4
Mutation rate versus time until relapse. Scatter plot showing the number of SNPs that differed between the 18 patients’ paired isolates (y-axis) as a function of the time between episodes (x-axis). The generation time is held constant at 18 h as seen in actively replicating M. tuberculosis in vitro. The relation between the mutation rate and the time between episodes was marginally significantly different from 0.0 (p value = 0.0613), indicating a trend of a higher mutation rate in the first months of relapsing period.
Figure 5
Figure 5
Changes in mutation rate during the relapsing period with varying generation times. Mutation rate (mutations per (bp × generation)) is shown for generation times ranging from 18 to 320 h for each pair grouped by the number of years between the first and relapsed isolates. The dark blue line is obtained from the regressions and shows the estimated mutation rate for a given generation time (x-axis) and light blue regions show 95% confidence intervals. The first panel shows the relationship between mutation rate and generation time during early relapsing (in ≤ 2 years) based on n = 6 pairs. The second panel shows the relation between mutation rate and generation time for relapse in 2–14 years based on n = 12 pairs. In both panels the grey dashed vertical line is fixed at 18 h, and the horizontal line indicates the mutation rate of 2.798 × 10–10 mutations per (bp × generation) as seen in early relapsing with generation times held constant at 18 h, fixed in both graphs for comparison availability.

References

    1. Esmail H, Barry CE, 3rd, Young DB, Wilkinson RJ. The ongoing challenge of latent tuberculosis. Philos. Trans. R. Soc. Lond. Ser. B, Biol. Sci. 2014;369(1645):20130437. doi: 10.1098/rstb.2013.0437. - DOI - PMC - PubMed
    1. Getahun H, Matteelli A, Chaisson RE, Raviglione M. Latent Mycobacterium tuberculosis infection. N Engl J Med. 2015;372(22):2127–2135. doi: 10.1056/NEJMra1405427. - DOI - PubMed
    1. Veatch AV, Kaushal D. Opening Pandora’s Box: Mechanisms of Mycobacterium tuberculosis Resuscitation. Trends Microbiol. 2018;26(2):145–157. doi: 10.1016/j.tim.2017.08.001. - DOI - PMC - PubMed
    1. Gibson SER, Harrison J, Cox JAG. Modelling a silent epidemic: a review of the in vitro models of latent tuberculosis. Pathog (Basel, Switzerland). 2018;7(4):88. - PMC - PubMed
    1. Behr MA, Edelstein PH, Ramakrishnan L. Revisiting the timetable of tuberculosis. BMJ. 2018;362:1–10. doi: 10.1136/bmj.k2738. - DOI - PMC - PubMed

Publication types