. 2022 Oct 6;12(1):16730.
doi: 10.1038/s41598-022-19947-2.

Anti-hyperalgesic effects of photobiomodulation therapy (904 nm) on streptozotocin-induced diabetic neuropathy imply MAPK pathway and calcium dynamics modulation

Affiliations

Anti-hyperalgesic effects of photobiomodulation therapy (904 nm) on streptozotocin-induced diabetic neuropathy imply MAPK pathway and calcium dynamics modulation

Willians Fernando Vieira et al. Sci Rep. .

Abstract

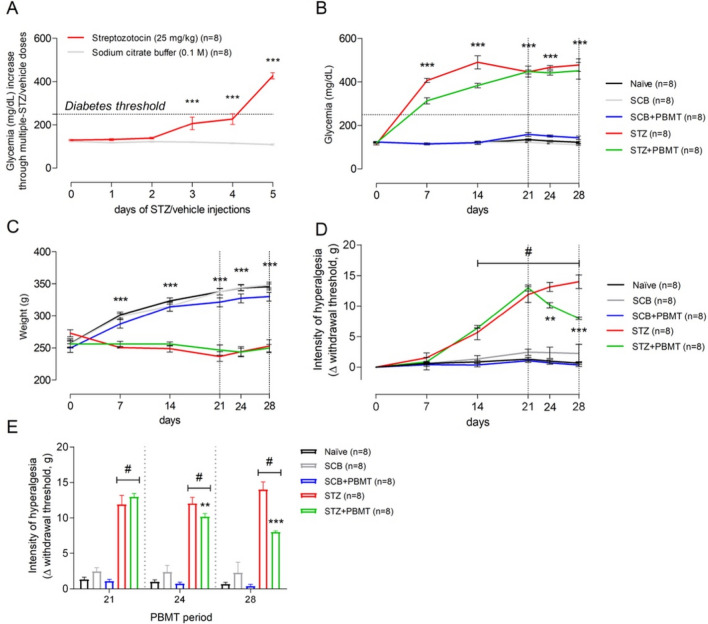
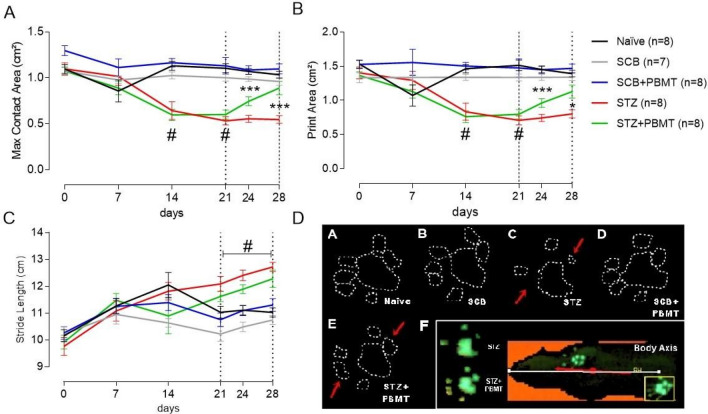
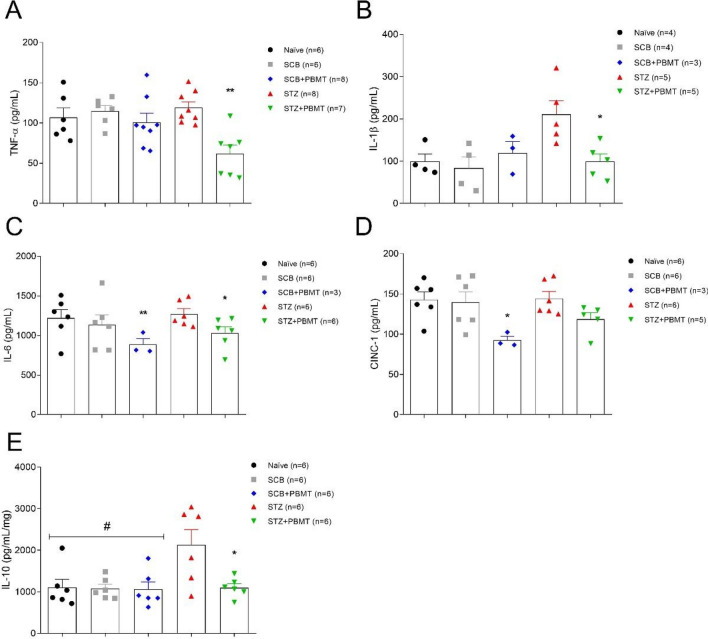
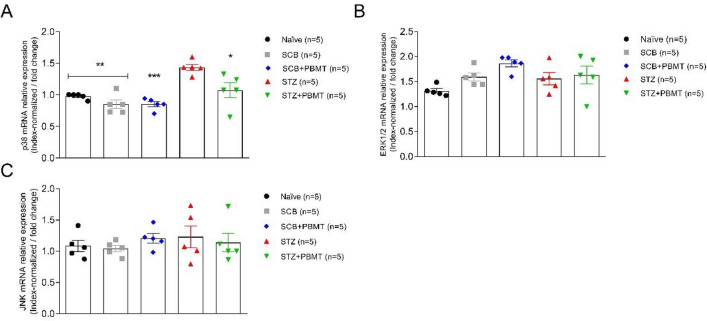
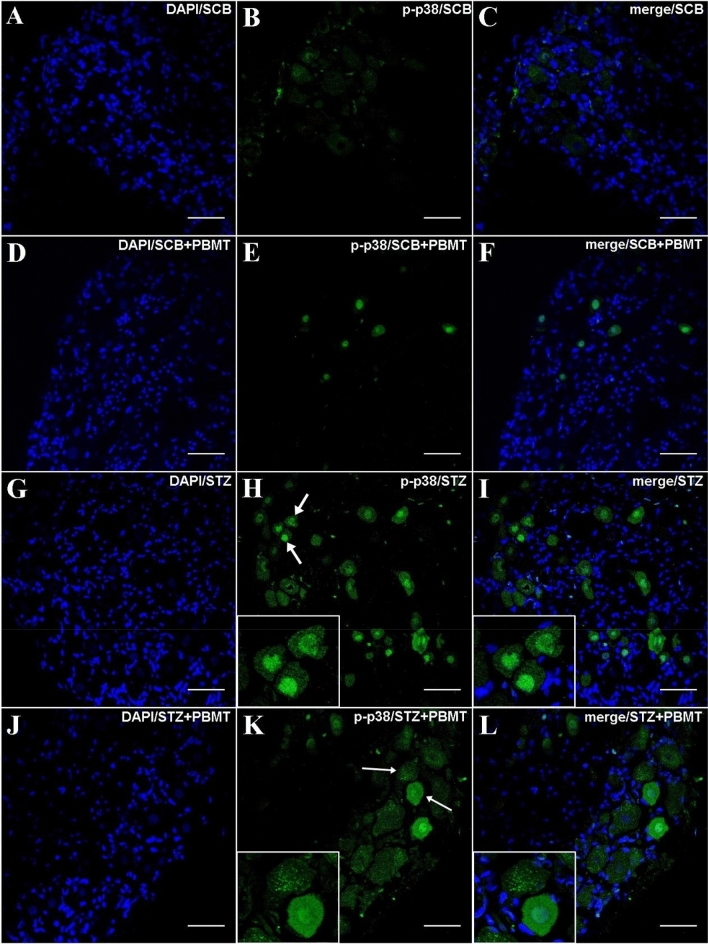
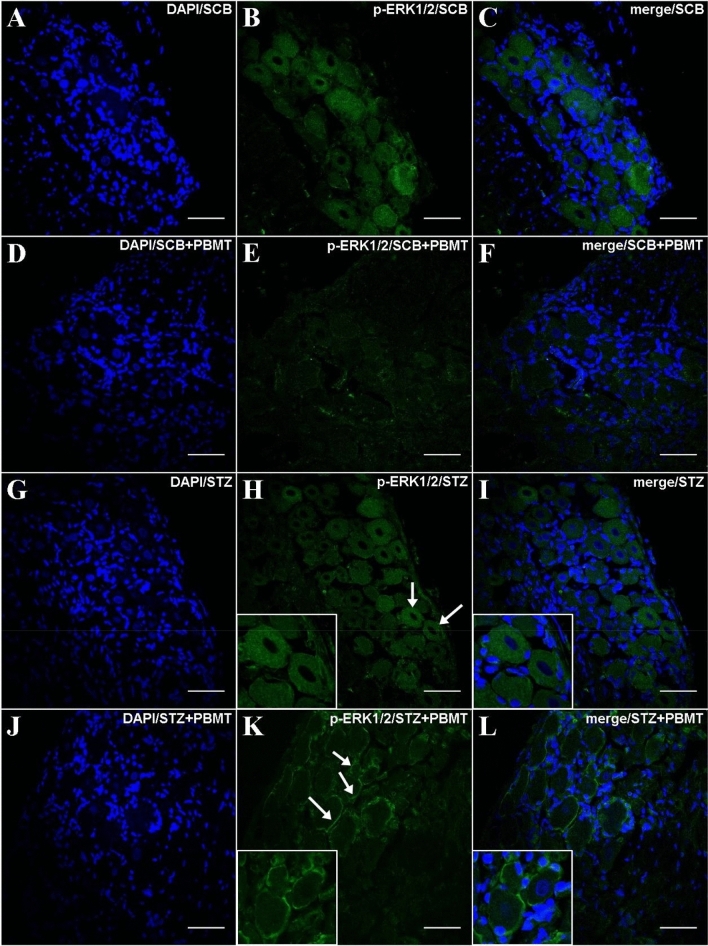
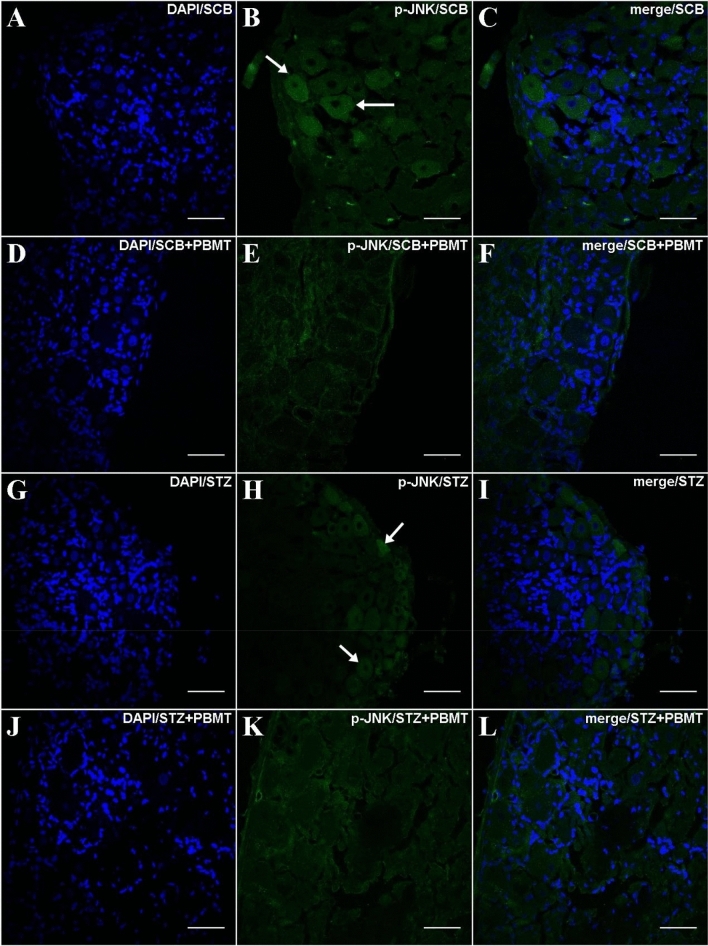
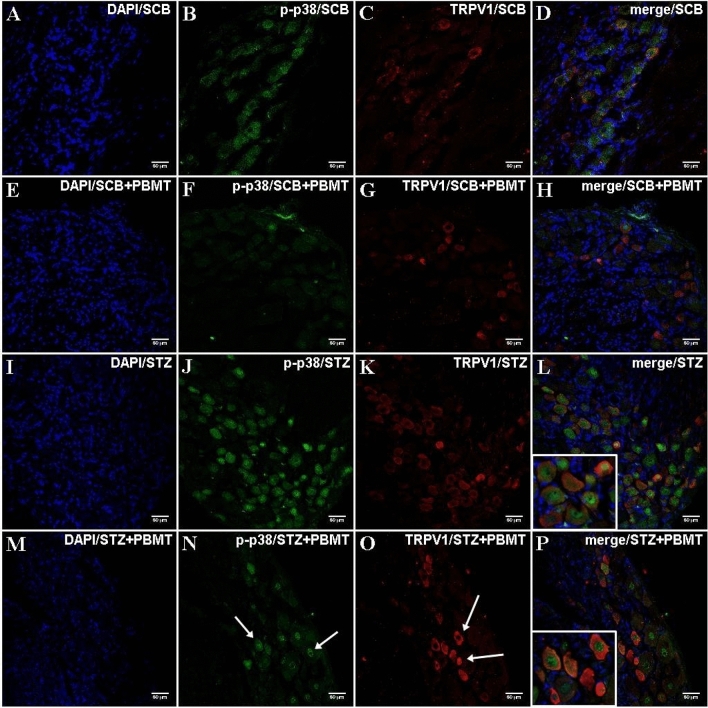
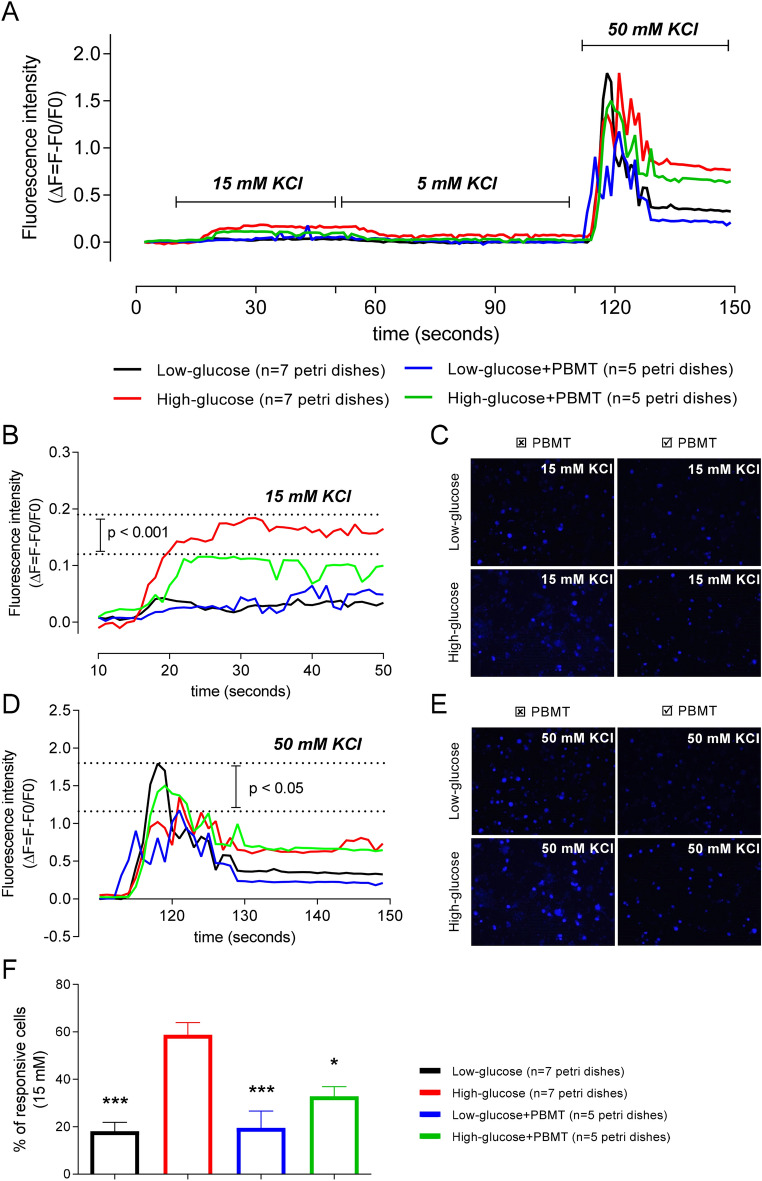
Several recent studies have established the efficacy of photobiomodulation therapy (PBMT) in painful clinical conditions. Diabetic neuropathy (DN) can be related to activating mitogen-activated protein kinases (MAPK), such as p38, in the peripheral nerve. MAPK pathway is activated in response to extracellular stimuli, including interleukins TNF-α and IL-1β. We verified the pain relief potential of PBMT in streptozotocin (STZ)-induced diabetic neuropathic rats and its influence on the MAPK pathway regulation and calcium (Ca2+) dynamics. We then observed that PBMT applied to the L4-L5 dorsal root ganglion (DRG) region reduced the intensity of hyperalgesia, decreased TNF-α and IL-1β levels, and p38-MAPK mRNA expression in DRG of diabetic neuropathic rats. DN induced the activation of phosphorylated p38 (p-38) MAPK co-localized with TRPV1+ neurons; PBMT partially prevented p-38 activation. DN was related to an increase of p38-MAPK expression due to proinflammatory interleukins, and the PBMT (904 nm) treatment counteracted this condition. Also, the sensitization of DRG neurons by the hyperglycemic condition demonstrated during the Ca2+ dynamics was reduced by PBMT, contributing to its anti-hyperalgesic effects.


Conflict of interest statement

The authors declare no competing interests.

Figures

Figure 1
Figure 1
PBMT decreases the hyperalgesia of T1D rats without changing their glycemia or weight. (A) Average morning glycemia (red line) from rats during the protocol of T1D induction by multiple STZ low-doses; dotted horizontal black line: established diabetes threshold (glucose ≥ 250 mg/dL). (B) Rats from STZ (red line) and STZ + PBMT (green line) groups showed high levels of hyperglycemia at 7, 14, 21, 24, and 28 days. (C) Rats from STZ (red line) and STZ + PBMT (green line) groups stopped gaining weight after the installation of diabetes. (D) Data from mechanical withdrawal thresholds (Δ; g; the intensity of hyperalgesia) show that PBMT reduced significantly the intensity of hyperalgesia of the STZ + PBMT group (green line) in comparison with the STZ group (red line), at the 24th and the 28th days. (E) Bar graph emphasizing the PBMT anti-hyperalgesic effect during the period comprised between the 21st and the 28th days. In (AC), symbol (***) means a significant difference (p < 0.001) between diabetic groups and controls (Two-way ANOVA followed by Bonferroni posthoc test). In (D) and (E), symbols (**) and (***) mean significant difference (p < 0.01 and p < 0.001, respectively) between STZ and STZ + PBMT groups (Two-way ANOVA followed by Bonferroni posthoc test); symbol (#) means significant difference (p < 0.001) between STZ-induced groups in comparison to control groups (Two-way ANOVA followed by Bonferroni posthoc test [D]; One-way ANOVA followed by Bonferroni posthoc test [E]). Data are expressed as mean ± S.E.M.; vertical dotted black lines indicate the PBMT period.
Figure 2
Figure 2
Gait spatial parameters were altered in DN and thwarted by PBMT. (A) Maximum Contact Area (cm2). (B) Print Area (cm2). (C) Stride Length (cm). Data are expressed as mean ± S.E.M.; symbols (*) and (***) mean significant difference (p < 0.05 and p < 0.001, respectively) between STZ and STZ + PBMT groups; symbol (#) means significant difference (p < 0.001) between STZ-induced groups (STZ and STZ + PBMT) in comparison to control groups (Naïve; SCB; SCB + PBMT); Two-way ANOVA followed by Bonferroni posthoc test. (D) The general pattern of the hind paw 2D footprints; rats from STZ group (c) showed a reduction in the contact area, delimited by the white dotted line and indicated by the red arrows; rats from STZ + PBMT group (e) presented a footprint area closest to the control groups (red arrows). In the lower right frame (f), Body Axis serves as a reference to observe the positioning of the paw during the analysis.
Figure 3
Figure 3
Effects of PBMT over the DRG levels of TNF-α, IL-1β, IL-6, CINC-1, and IL-10. (A) There was no increase in the levels of TNF-α (pg/mL) in the STZ group (red symbols); the STZ + PBMT group (green symbols) showed a significant reduction in the levels of TNF-α (pg/mL) in comparison to all the other groups. (B) For the levels of IL-1β (pg/mL), there was a significant increase in the STZ group (red symbols) in comparison with all the other groups. (C) Levels of IL-6 (pg/mL) were reduced significantly in SCB + PBMT (blue symbols) and STZ + PBMT (green symbols) groups, in comparison to all the other groups. (D) CINC-1 concentrations (pg/mL) showed a significant reduction in the SCB + PBMT group (blue symbols) only. (E) Levels of IL-10 (pg/mL/mg) showed a significant increase in the STZ group (red symbols) in comparison to all the other groups. Data are expressed as mean ± S.E.M.; symbols (*) and (**) mean p < 0.05 and p < 0.01, respectively; symbol (#) means that all control groups are significantly different from the STZ group (p < 0.05); One-way ANOVA followed by Bonferroni posthoc test.
Figure 4
Figure 4
Quantitative expression of MAPK mRNA. Gene expression values of p38 (A), ERK1/2 (B), and JNK (C) were index-normalized by a pool of endogenous controls (Arfgef1 and Serpinb6) expression. PBMT decreased the p38 mRNA expression in hyperalgesic rats (STZ + PBMT group). Hyperglycemia increased p38 mRNA expression, but not ERK1/2 and JNK in DRG associated with hyperalgesia. Data are expressed as mean ± S.E.M.; symbols (*), (**), and (***) mean p < 0.05, p < 0.01, and p < 0.001 (respectively) in the comparisons between STZ (red symbols) and the other groups (Naïve, black symbols; SCB, gray symbols; SCB + PBMT, blue symbols; STZ + PBMT, green symbols); unpaired Student t-test.
Figure 5
Figure 5
DRG histological micrographs of p-p38 MAPK by confocal microscopy. DRG transversal 14 µm-thick sections were submitted to IF protocol for staining endogenous p38 phosphorylation in Thr180 and Tyr182 (B,E,H,K). DAPI for nuclear staining is shown in (A,D,G,J). Merge (DAPI + p-p38) images are also shown in (C,F,I,L). In (H) and (K), white arrows point to the zoomed-in areas. Details are shown in the left corner of (H,I,K,L). Magnification: ×40; scale bars: 50 µm.
Figure 6
Figure 6
DRG histological micrographs of p-ERK1/2 MAPK by confocal microscopy. DRG transversal 14 µm-thick sections submitted to IF protocol for staining ERK1/2 phosphorylation in Thr202 and Tyr204 (p44/p42) (B,E,H,K). DAPI for nuclear staining is shown in (A,D,G,J). Images of merge (DAPI + p-ERK1/2) are also shown in (C,F,I,L). In (H) and (K), white arrows point to the zoomed-in areas. Details are shown in the left corner of (H,I,K,L). Magnification: ×40; scale bars: 50 µm.
Figure 7
Figure 7
DRG histological micrographs of p-JNK MAPK by confocal microscopy. DRG transversal sections were 14 µm in thickness and submitted to IF protocol for staining of endogenous p-JNK phosphorylation in Thr183 and Tyr185 (p46/p54) (B,E,H,K). DAPI for nuclear staining is shown in (A,D,G,J). Merge (DAPI + p-JNK) images were also shown in (C,F,I,L). In (B) and (H), arrows point to diffused staining in the cytoplasm. Magnification: ×40; scale bars: 50 µm.
Figure 8
Figure 8
DRG histological micrographs of p-p38 MAPK and the co-staining of TRPV1 by confocal microscopy. DRG transversal sections were made in 14 µm thickness and submitted to IF protocol for staining endogenous p38 phosphorylation in Thr180 and Tyr182 (B,F,J,N) and TRPV1 (C,G,K,O). DAPI for nuclear staining is shown in (A,E,I,M). Merge (DAPI + p-p38 + TRPV1) images are also shown in (D,H,L,P). STZ + PBMT group showed moderate staining for p-p38 MAPK (N; white arrows) and increased staining for TRPV1 (O; white arrows). Details are shown in the left corner of (L) and (P). Magnification: ×40; scale bars: 50 µm.
Figure 9
Figure 9
PBMT decreases the calcium dynamics of DRG neurons increased by hyperglycemia. Fluorescence intensity (ΔF = F − F0/F0) was analyzed in DRG neurons cultivated in low- (black line) or high-glucose (red line) media for 24 h and exposed to PBMT (green and blue lines) right before the test. (A) General representation of fluorescence intensities (ΔF = F − F0/F0) after extracellular stimuli with 5 mM (basal), 15 mM (intermediary), and 50 mM (high) of KCl; ↑[K+]e was used to generate Ca2+ influx in DRG neurons incubated with FLUO-4 AM. (B) During the intermediary stimulus (15 mM KCl), there was a significant difference in the ΔF when comparing the High-glucose and High-glucose + PBMT groups (comparison was done considering the ΔF delimited by the horizontal dotted lines); Two-way ANOVA followed by Bonferroni posthoc test. (C) Snap-acquired images of the DRG cell culture during the time-lapse, right after the stimulus with 15 mM KCl. (D) At the high stimulus (50 mM KCl), there was a significant difference between the Low-glucose and Low-glucose + PBMT groups. (E) Snap-acquired images of the DRG cell culture during the time-lapse, right after the stimulus with 50 mM KCl. (F) Percentage (%) of responsive cells during the 15 mM stimulus; in the High-glucose group, about 60% of all responsive cells, i.e., cells with increased fluorescence during the 50 mM KCl stimulus (positive control), also responded to the intermediary stimulus (15 mM KCl), being statistically different from the other groups. Data are expressed as mean ± S.E.M.; symbols (*) and (***) mean p < 0.05 and p < 0.001, respectively, in comparison to the High-glucose group; One-way ANOVA followed by Bonferroni posthoc test.

Similar articles

Cited by

References

    1. Feldman EL, Nave K, Jensen TS, Bennett DLH. New horizons in diabetic neuropathy: Mechanisms, bioenergetics, and pain. Neuron. 2017;93:1296–1313. doi: 10.1016/j.neuron.2017.02.005. - DOI - PMC - PubMed
    1. Callaghan BC, Cheng HT, Stables CL, Smith AL, Feldman EL. Diabetic neuropathy: Clinical manifestations and current treatments. Lancet Neurol. 2012;11:521–534. doi: 10.1016/S1474-4422(12)70065-0. - DOI - PMC - PubMed
    1. Jensen TS, Finnerup NB. Allodynia and hyperalgesia in neuropathic pain: Clinical manifestations and mechanisms. Lancet Neurol. 2014;13:924–935. doi: 10.1016/S1474-4422(14)70102-4. - DOI - PubMed
    1. Truini A, Garcia-Larrea L, Cruccu G. Reappraising neuropathic pain in humans—How symptoms help disclose mechanisms. Nat. Rev. Neurol. 2013;9:572–582. doi: 10.1038/nrneurol.2013.180. - DOI - PubMed
    1. Gandhi RA, Selvarajah D. Understanding and treating painful diabetic neuropathy: Time for a paradigm shift. Diabet. Med. 2015;32:771–777. doi: 10.1111/dme.12755. - DOI - PubMed

Publication types

MeSH terms