. 2022 Oct;24(10):1475-1486.
doi: 10.1038/s41556-022-00999-5. Epub 2022 Oct 6.

Murine foetal liver supports limited detectable expansion of life-long haematopoietic progenitors

Affiliations

Murine foetal liver supports limited detectable expansion of life-long haematopoietic progenitors

Miguel Ganuza et al. Nat Cell Biol. 2022 Oct.

Abstract

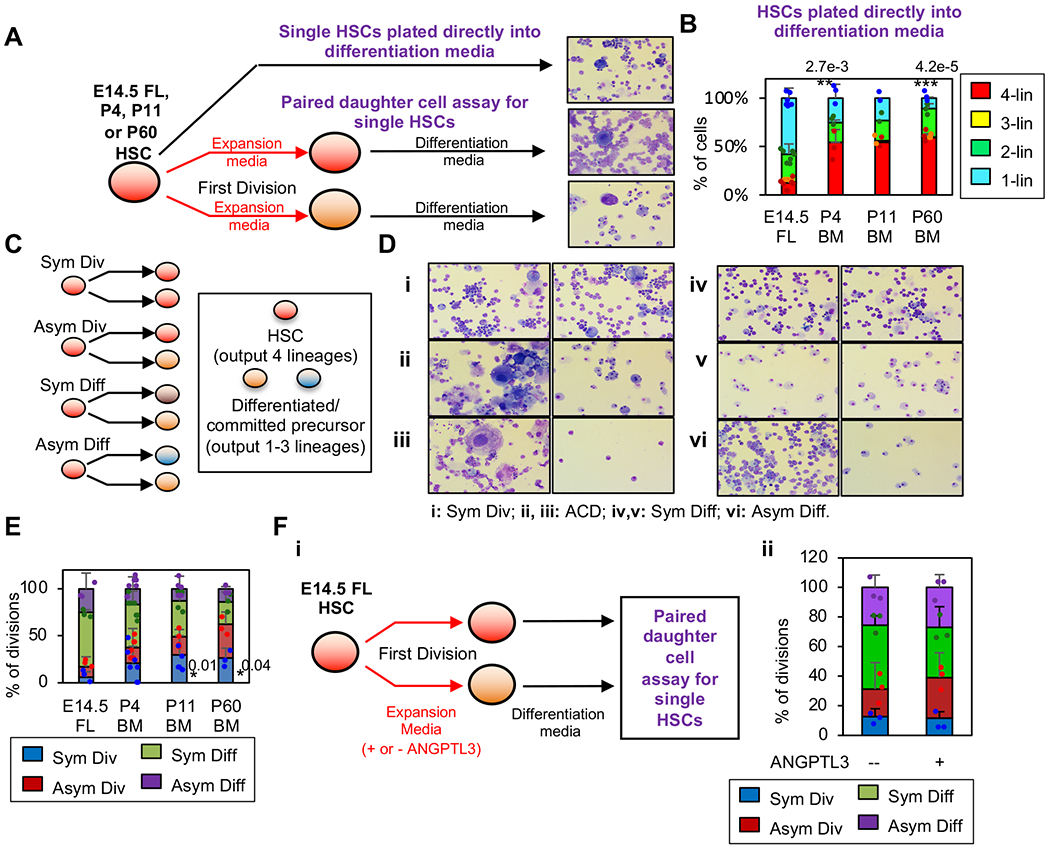
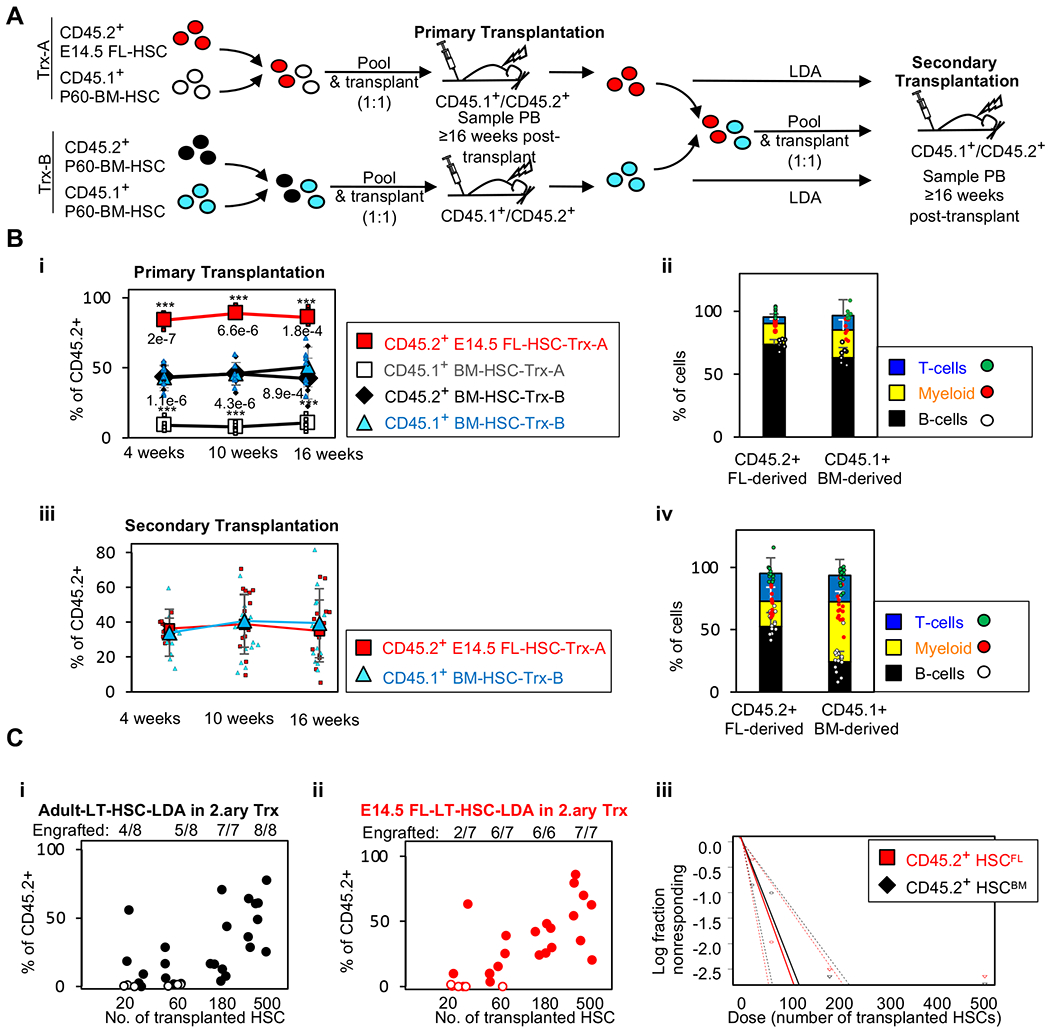
Current dogma asserts that the foetal liver (FL) is an expansion niche for recently specified haematopoietic stem cells (HSCs) during ontogeny. Indeed, between embryonic day of development (E)12.5 and E14.5, the number of transplantable HSCs in the murine FL expands from 50 to about 1,000. Here we used a non-invasive, multi-colour lineage tracing strategy to interrogate the embryonic expansion of murine haematopoietic progenitors destined to contribute to the adult HSC pool. Our data show that this pool of fated progenitors expands only two-fold during FL ontogeny. Although Histone2B-GFP retention in vivo experiments confirmed substantial proliferation of phenotypic FL-HSC between E12.5 and E14.5, paired-daughter cell assays revealed that many mid-gestation phenotypic FL-HSCs are biased to differentiate, rather than self-renew, relative to phenotypic neonatal and adult bone marrow HSCs. In total, these data support a model in which the FL-HSC pool fated to contribute to adult blood expands only modestly during ontogeny.


Conflict of interest statement

Declaration of Interests

The authors declare no competing interests.

Figures

Extended Data Fig. 1
Extended Data Fig. 1. Schematic of Confetti-allele based approach to estimate clonal complexity, flow cytometry gating and summary of Confetti labelling in blood and bone marrow.
A. Confetti-allele approach to estimate cell numbers. Ai. Schematic of Confetti allele. Aii. Mouse-to-Mouse Variance in the distribution of Confetti colors (MtMV) inversely correlates with the number of initiating events. B. Representative Confetti gating. B-cells from a TAM-treated ROSA26+/ConfettiUbiq+/ERT2-Cre mouse and a ROSA26+/ConfettiUbiq+/+ negative control are shown. C. Flow cytometry gating strategy of PB. (Ci) B-cells (B), T-cells (T) and myeloid cells (M), as well as BM compartments (Cii).
Extended Data Fig. 2
Extended Data Fig. 2. Summary of Confetti labelling in blood and bone marrow.
A. Average total PB Confetti label of mice at (Ai) two (n≥8: E8-10, n=16; E12-14, n=18; P1, n=11; P8-9, n=18; P14-15, n=13; P21-22, n=8) and (Aii) six months of age (n≥4: E8-10, n=5; E12-14, n=9; P1, n=11; P8-9, n=18; P14-15, n=13; P21-22, n=4). B. Average total Confetti labeling in the BM at six months of age (n≥4: E8-10, n=5; E12-14, n=9; P1, n=11; P8-9, n=18; P14-15, n=13; P21-22, n=4). A-B. Related to Figure 1C–D and Extended Data Figure 3. A-B. Means are shown. Error bars indicate standard deviation. Individual data points are shown in black.
Extended Data Fig. 3
Extended Data Fig. 3. Numbers of fetal liver hematopoietic progenitors contributing to specific adult blood compartments.
MtMV-based estimates of numbers of progenitors contributing to PB at P60 (n≥8: E8-10, n=16; E12-14, n=18; P1, n=11; P8-9, n=18; P14-15, n=13; P21-22, n=8) (A) and P180 (n≥4: E8-10, n=5; E12-14, n=9; P1, n=11; P8-9, n=18; P14-15, n=13; P21-22, n=4) (B) labeled at distinct windows of ontogeny are shown. Total white blood cells (WBC), B-cells (B), T-cells (T) and myeloid cells (M). Related to Figure 1C. Error bars indicate the 95% confidence intervals.
Extended Data Fig. 4
Extended Data Fig. 4. Window of active labelling of DOX in vivo.
A. Experimental schematic. ROSA26 rtTa/+ Col1a1tetO-H2B-GFP/+ CD45.2+ donor BM was pooled from five donors and transplanted into CD45.1+/CD45.2+ recipient mice previously treated with DOX on day three (−3), two (−2) or one (−1) before transplantation or on the same of transplant (day 0) (n=3 recipients per group). B. %GFP+ BM of recipients 4, 7, or 11 days post-transplant (Trx). C. To corroborate the ability of non-labelled transplanted CD45.2+ cells to respond to DOX, CD45.2+ c-Kit+ sorted cells from each mouse cohort were cultured in vitro in the presence or absence of DOX showing that cells were responsive to DOX in vitro.
Extended Data Fig. 5
Extended Data Fig. 5. Fetal liver factor ANGPTL3 is not able to promote self-renewing expansion of E14.5 FL-HSCs.
A. Gating strategy on E12.5-CD45+c-Kit+ cells and E14.5-c-Kit+ and E14.5-HSC cells. Related to Figures 3B–C & 4. B-D. LSK CD150+CD48 C57Bl/6 HSCs were isolated from E14.5 FL or adult BM and cultured in PVA cultures tailored for self-renewing expansion either with or without addition of ANGPTL3, for 2 weeks. Immunophenotypic HSC expansion was then quantified. Due to known immunophenotypic shifts during PVA culture, HSC were defined as LSK CD150+EPCR+ after culture. B. Experimental schematic. C. Gating strategy of LSK CD150+EPCR+ HSC after culture. D. Proportion of wells expanding, defined as containing at least 100 immunophenotypic LT-HSCs. E. For those wells showing cell expansion, HSC expansion as a ratio of output/input is shown. For each condition, 5 biological replicates and 2 independent experiments with 10 wells/replicate. Each circle/square represents an individual biological replicate. Means and standard deviations are depicted. For (D), the Holm-Sidak method (2-tailed) was used to calculate statistical significance and correct for multiple comparisons. Exact p-values are shown in Figure.
Figure 1.
Figure 1.. Life-long blood progenitor expansion in the fetal liver is modest.
A. Schematic to highlight developmental stages and windows of CRE activity (boxes). Triangles represent accumulation of transplantable HSC in each tissue. B. Experimental schematic. Blood and/or bone marrow was analyzed at P60 and P180 by flow cytometry to assess MtMV in each mouse cohort. C. Graphs show the MtMV-based estimates of numbers of progenitors contributing to PB at P60 (n≥8: E8-10, n=16; E12-14, n=18; P1, n=11; P8-9, n=18; P14-15, n=13; P21-22, n=8) (Ci) and P180 (n≥4: E8-10, n=5; E12-14, n=9; P1, n=11; P8-9, n=18; P14-15, n=13; P21-22, n=4) (Cii). D. Graphs show the MtMV-based estimates of numbers of progenitors contributing to BM HSPCs [long-term (LT)-HSC, MPP, CMP, CLP, MEP, GMP] at P180 (n ≥6: E8-10, n=5; E12-14, n=12; P1, n=11; P8-9, n=7; P14-15, n=13; P21-22, n=14) labelled at distinct windows of ontogeny. Numbers were estimated by MtMV among cohorts of ROSA26+/ConfettiVE+/T (at E8-10) and TAM-treated ROSA26+/ConfettiUbiq+/T mice at the indicated time points. Results reflect the analysis of mice of both sexes. Error bars indicate the 95% confidence intervals. See also Supplementary Table 1.
Figure 2.
Figure 2.. Validation of the utility of the ROSA26rtTa/rtTApTRE-H2BGFP+/GFP model for tracking cell divisions.
A. Schematic of kinetics of H2B-GFP signal dilution. DOX-treated ROSA26rtTa/rtTA; pTRE-H2BGFP+/GFP mice express and accumulate H2B-GFP in their DNA. On DOX removal, H2B-GFP MFI is reduced by half with each cell division: yN/yo=2−N (yo = initial H2B-GFP MFI; N = number of divisions, yN = H2B-GFP MFI after N divisions). B-E. Analysis of the relationship between GFP MFI attrition and number of divisions after DOX removal using ROSA26rtTa/rtTApTRE-H2BGFP+/GFP MEFs. Immortalized ROSA26rtTa/rtTApTRE-H2BGFP+/GFP and ROSA26rtTa/rtTApTRE-H2BGFP+/+control MEFs were cultured in the presence (+DOX) or absence of DOX (Untreated). After three days, DOX was removed (pulsed). B. Experimental schematic. C. Representative flow cytometry analysis of four independent ROSA26rtTa/rtTApTRE-H2BGFP+/GFP cell lines. ROSA26rtTa/rtTApTRE-H2BGFP+/+ control cells are also shown. Gray (untreated), green (+DOX), orange (pulsed, three days post-DOX removal). D. Four independent ROSA26rtTa/rtTApTRE-H2BGFP+/GFP cell lines were assayed in two independent experiments for 14 days. Upper Y-axis in logarithmic scale, bottom in linear scale. The actual number of cell divisions measured by manual counting (black bars) and estimated via GFP MFI loss (red bars) are shown. E. Linear relationship between ln(Na) and N. ln(Na)= −0.757+0.541*N for N<6.5. Adjusted R-squared=0.6773. Gray area indicates standard error bands.
Figure 3.
Figure 3.. Phenotypic FL-HSCs undergo many cell divisions.
A. Experimental schematic. ROSA26rtTa/rtTA; pTRE-H2BGFP+/GFP and ROSA26rtTa/rtTA; pTRE-H2BGFP+/+ murine embryos were DOX-treated from E0.5-E11.5 or E0.5-E14.5. Bi. Representative flow cytometry histograms of GFP labelling in CD45+c-Kit+Lin cells at E12.5 in DOX-treated ROSA26rtTa/rtTA; pTRE-H2BGFP+/+ (gray, n=3) and ROSA26rtTa/rtTA; pTRE-H2BGFP+/GFP (green, n=7) embryos. Untreated (No DOX) and DOX-treated (+DOX) ROSA26rtTa/rtTA; pTRE-H2BGFP+/GFP MEFs are light blue. Bii. % of GFP+ among CD45+LinKit+ cells in E12.5 DOX-treated ROSA26rtTa/rtTA; pTRE-H2BGFP+/GFP embryos. C. ROSA26rtTa/rtTA; pTRE-H2BGFP+/GFP embryos were exposed to DOX until E14.5 (green, n=3) or E11.5 (orange, n=20). GFP labelling of CD45+c-Kit+Lin cells (left panels) and HSCs (CD150+CD48LinSca-1+c-Kit+ cells; where Lin: TER119, Gr1, CD4, CD8, B220) (right panels) at E14.5. ROSA26rtTa/rtTA; pTRE-H2BGFP+/+negative control (gray), as well as untreated and DOX-treated ROSA26rtTa/rtTA; pTRE-H2BGFP+/GFP control MEFs (n=4/each, light blue) are shown. D. Estimates of the number of actual cell divisions (Na) encountered by E12.5 CD45+c-Kit+Lin (n=7) to yield E14.5 CD45+c-Kit+Lin and E14.5 HSCs (n=20) based on Na= e(−0.757+0.541*N), where N= log2(yo/yN) and calculated based on loss of GFP-MFI (Figure 2). Embryos represent six litters in two experiments. Bii & D. Each dot represents an independent embryo. Results reflect the analysis of mouse embryos at the indicated developmental stages. Sex of the embryos was not determined. Averages and standard deviations are shown.
Figure 4.
Figure 4.. E14.5 FL HSC progenitors are biased to differentiate.
A. Experimental schematic. CD150+CD48LinSca-1+c-Kit+ C57Bl/6 HSCs were isolated from E14.5, P4, P11 or P60 mice of both sexes and plated in differentiation or expansion media. For expansion cultures, daughters of first cell division are separated and re-plated into differentiation media. A-F. Lin: TER119, Gr1, CD4, CD8, B220. B. Erythro-myeloid potential of E14.5 FL (n=143 cells from seven independent samples), P4 (n=113 cells, three independent samples), P11 (n=48 cells from two independent samples) and P60 HSC (n=113 cells from three independent samples). Data was collected in five independent experiments. % of HSCs generating 4, 3, 2 or 1 lineages is shown. C-F. Paired daughter cell assay. C. Schematic of potential outputs: asymmetric division, symmetric division, asymmetric differentiation or symmetric differentiation. E. Analysis of the output of first division undergone by E14 (n=41 cells, three independent samples), P4 (n=30 cells, seven independent samples), P11 (n=36 cells, six independent samples) and P60 HSCs (n=22 cells, three independent samples). F. Analysis of the output of first division undergone by E14.5-FL-HSCs cultured in the presence or absence of ANGPTL3 during a first division in expansion media. Fi. Experimental schematic. Fii. Three independent biological replicates (n≥12 cell divisions analyzed/condition, two independent experiments). B-F. Means and individual values are depicted. Multivariate analysis of variance was used to compare percent of cells by different conditions. FDR was used to adjust for multiple testing corrections. Error bars show standard deviations. *** p-value <0.001. ** p-value <0.01. * p-value <0.05. Exact p-values are shown by graphs. A&D. Representative images of May-Grünwald-Giemsa stained cytospins from paired-daughters. Scale bar: 100μm. Cytospins were performed for each and every experiment and replicate detailed in B, E-Fii.
Figure 5.
Figure 5.. E14.5 FL HSC progenitors are biased to differentiate.
A. Transplantation strategy. B. Serial competitive transplantation of CD45.2+E14.5 FL-HSC versus CD45.1+adult-BM-HSC. %CD45.2+ chimerism at 16 weeks post-transplant in (Bi) primary recipients (n=7/group) and (Biii) secondary (n=14/group) recipients. Distribution of T, B, and myeloid PB lineages in primary (Bii) and secondary (Biv) recipients of CD45.2+ FL-HSCs and CD45.1+ BM-HSCs 16 weeks post-transplantation. C. %CD45.2+ chimerism in recipients of P60-BM-HSC (Ci) and of E14.5 FL-HSC (Cii) for LDA secondary transplants (n≥6/group). B-Cii. Individual data points and means are shown. Error bars denote standard deviations Each circle represents an individual recipient mouse. Ci-ii. Non-engrafted mice are depicted as empty circles. Number of mice engrafted/number of recipients at each cell dose is depicted. Ciii. Log of the non-responding fraction is shown for each LDA cell dose from CD45.2+E14.5 FL-HSC (CD45.2+ HSCFL) and CD45.2+adult-BM-HSC (CD45.2+ HSCBM). Multivariate analysis of variance was used to compare percent of cells by different conditions. FDR was used to adjust for multiple testing corrections. ***p-value <0.001. Exact p-values are shown by graphs. Statistical differences related to CD45.2+ BM-HSC-Trx-B in B. 8-10 weeks old mice of both sexes were used as recipients.
Figure 6.
Figure 6.. E16.5 FL-HSC are transcriptionally different from Adult HSCs. Updated model of the role of the FL niche in HSC ontogeny.
Single cell transcriptional profiling of E16.5 fetal and adult HPCs and HSCs (GSE128761) illustrate a unique signature of the adult HSC not observed in the E16.5 FL HSC. A. Venn diagram of E16.5FL HPC and E16.5 FL HSC marker genes that define the observed transcriptional heterogeneity with 83% of HSC marker genes present in the E16.5 FL HPC. B. Venn diagram of Adult HPC and Adult HSC marker genes that define the observed transcriptional heterogeneity with only 11 (18%) of HSC marker genes present in the adult HPC. A-B. Marker genes provided in Source Data Figure 6. C. Distribution of hscScores for E16.5 HPC, E16.5 HSC, Adult HPC, and Adult HSC illustrate that the fetal HSCs are significantly (A two-sided Wilcoxon rank sum test p-value = 5.21e-60) different than adult HSCs. Strikingly, the fetal hscScore distribution resembles both fetal and adult HPC distributions. Boxplots depict the following values: minimum, first quartile, median, third quartile and maximum. D. Updated model of the role of the FL niche in HSC ontogeny. Large numbers of HSC progenitors are present in the murine embryos before the first transplantable HSC is detected at E10.5. Although E12 phenotypic FL-HSC progenitors (ph-HSC) actively divide, they are biased to differentiate. Our data supports a model in which the rapid surge in repopulating units during FL ontogeny results from a combination of the maturation of immature pre-HSCs and some expansion of phenotypic LT-HSCs. As ontogeny progresses, the differentiation/self-renewal balance shifts towards less differentiation, which allows life-long HSCs to further accumulate with time before becoming quiescent.

References

    1. Kumaravelu P et al. Quantitative developmental anatomy of definitive haematopoietic stem cells/long-term repopulating units (HSC/RUs): role of the aorta-gonad-mesonephros (AGM) region and the yolk sac in colonisation of the mouse embryonic liver. Development 129, 4891–4899 (2002). - PubMed
    1. Medvinsky A & Dzierzak E Definitive hematopoiesis is autonomously initiated by the AGM region. Cell 86, 897–906 (1996). - PubMed
    1. Muller AM, Medvinsky A, Strouboulis J, Grosveld F & Dzierzak E Development of hematopoietic stem cell activity in the mouse embryo. Immunity 1, 291–301 (1994). - PubMed
    1. North T et al. Cbfa2 is required for the formation of intra-aortic hematopoietic clusters. Development 126, 2563–2575 (1999). - PubMed
    1. Yokomizo T et al. Requirement of Runx1/AML1/PEBP2alphaB for the generation of haematopoietic cells from endothelial cells. Genes Cells 6, 13–23 (2001). - PubMed

Methods-only References

    1. Todaro GJ & Green H Quantitative studies of the growth of mouse embryo cells in culture and their development into established lines. J Cell Biol 17, 299–313 (1963). - PMC - PubMed
    1. Benjamini Y, and Hochberg Y Controlling the false discovery rate: a practical and powerful approach to multiple testing. Journal of the Royal Statistical Society Series B 57, 289–300 (1995).

Publication types