. 2022 Oct;24(10):1499-1515.
doi: 10.1038/s41556-022-00997-7. Epub 2022 Oct 6.

Spatiotemporal dynamics of membrane surface charge regulates cell polarity and migration

Affiliations

Spatiotemporal dynamics of membrane surface charge regulates cell polarity and migration

Tatsat Banerjee et al. Nat Cell Biol. 2022 Oct.

Abstract

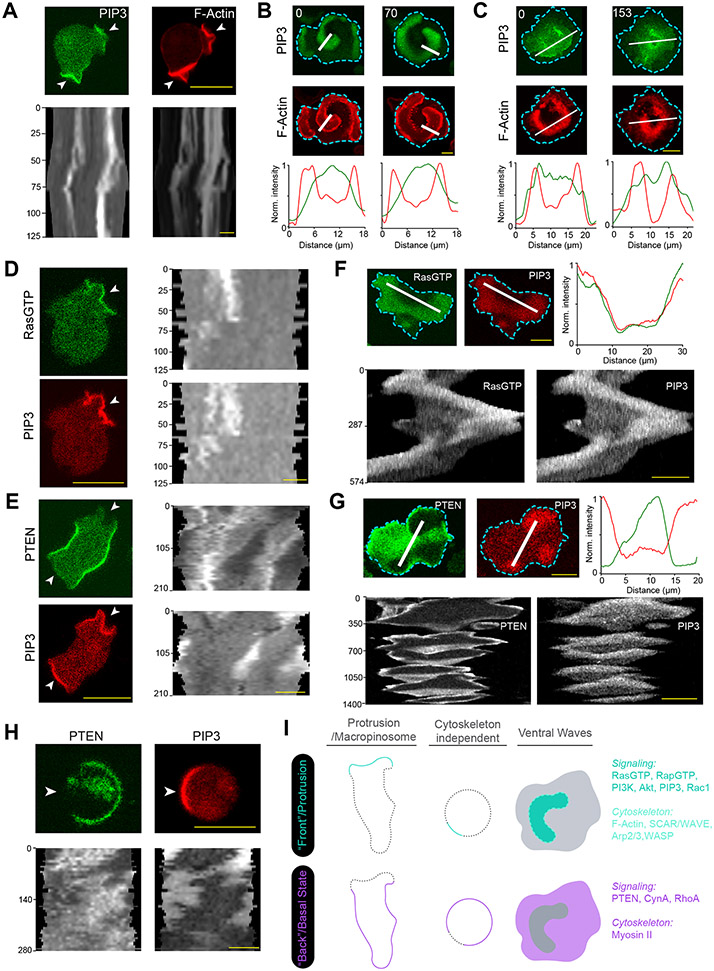
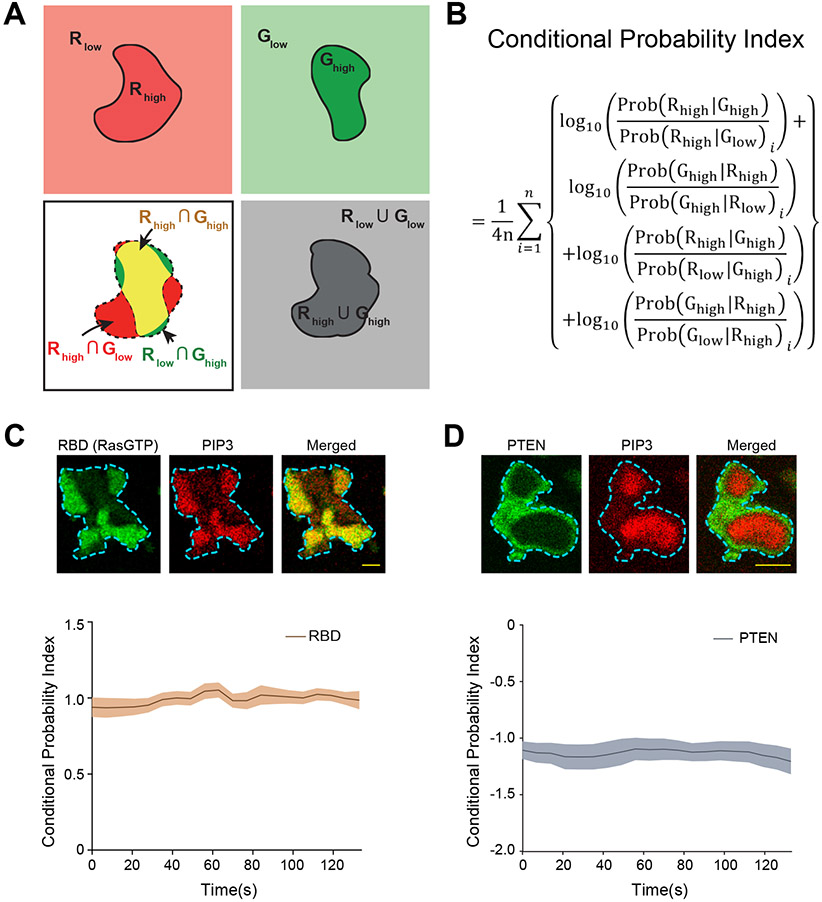
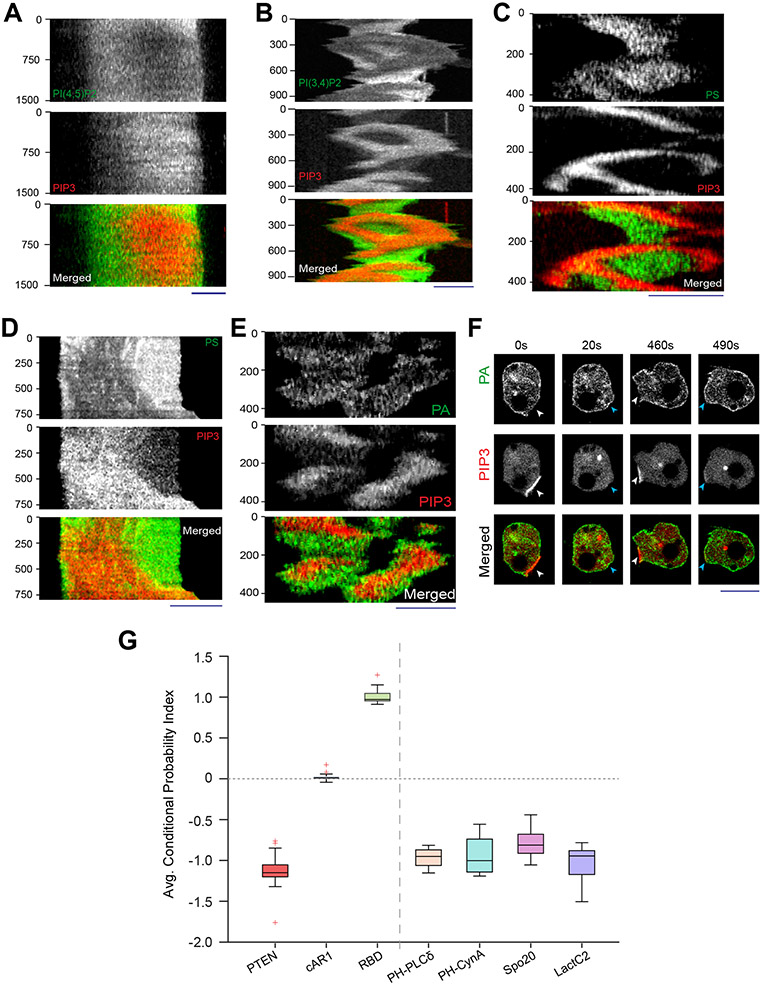
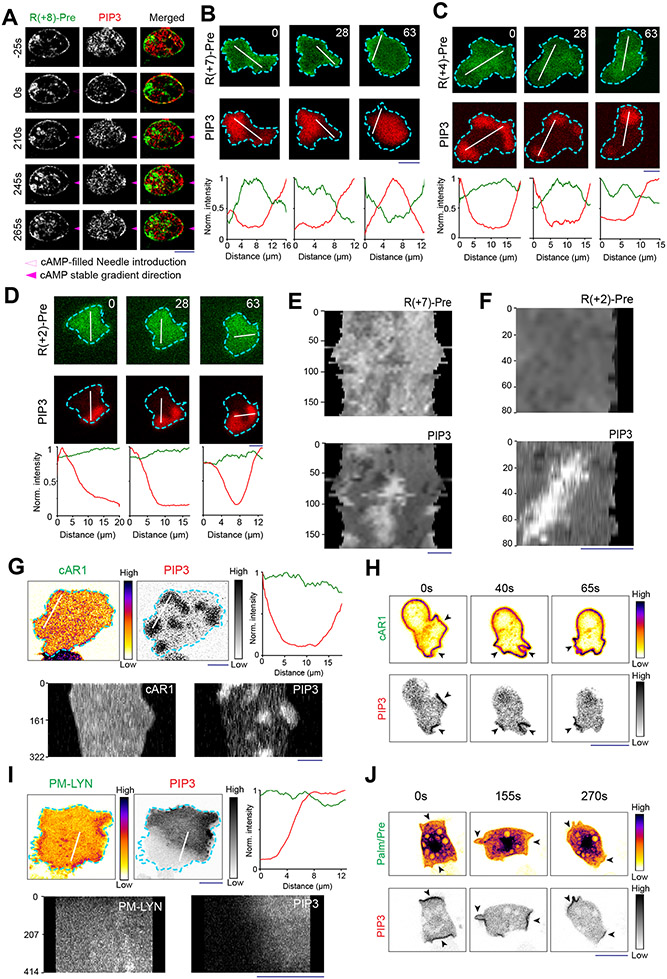
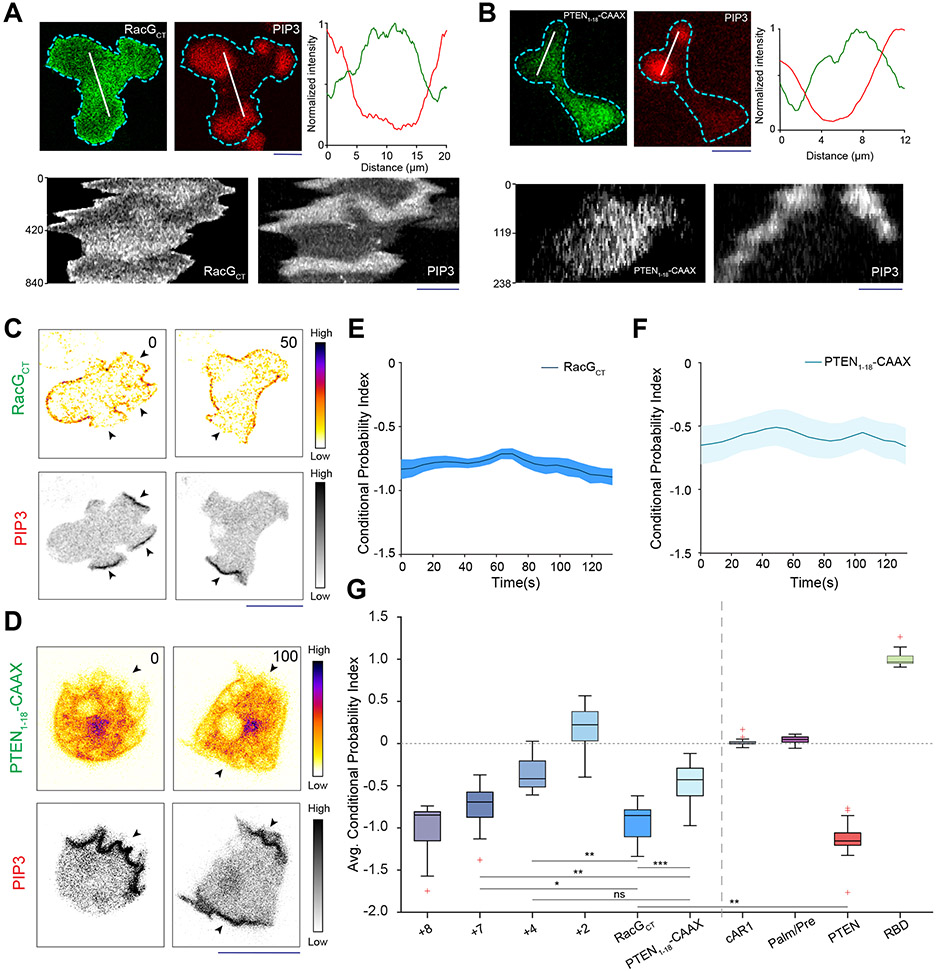
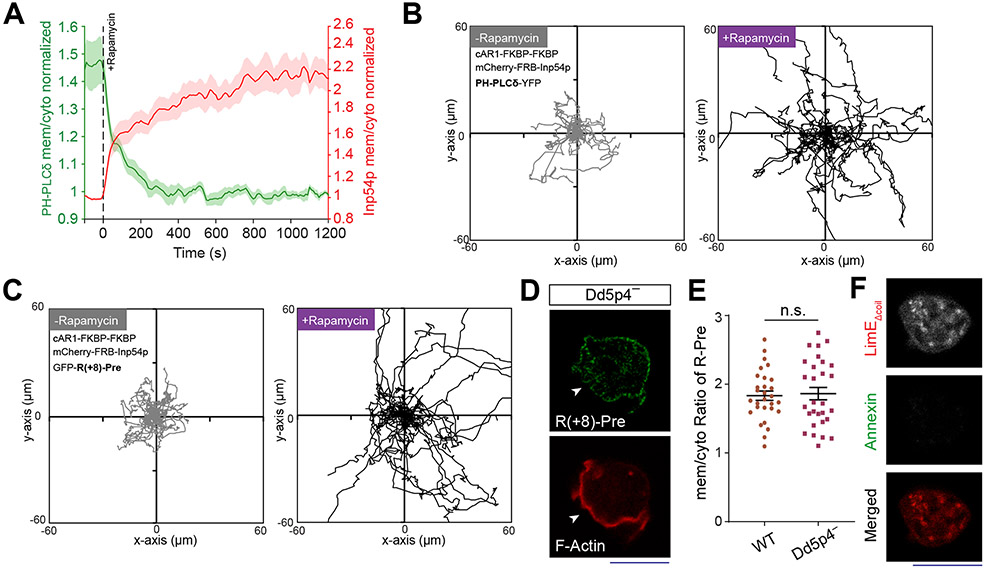
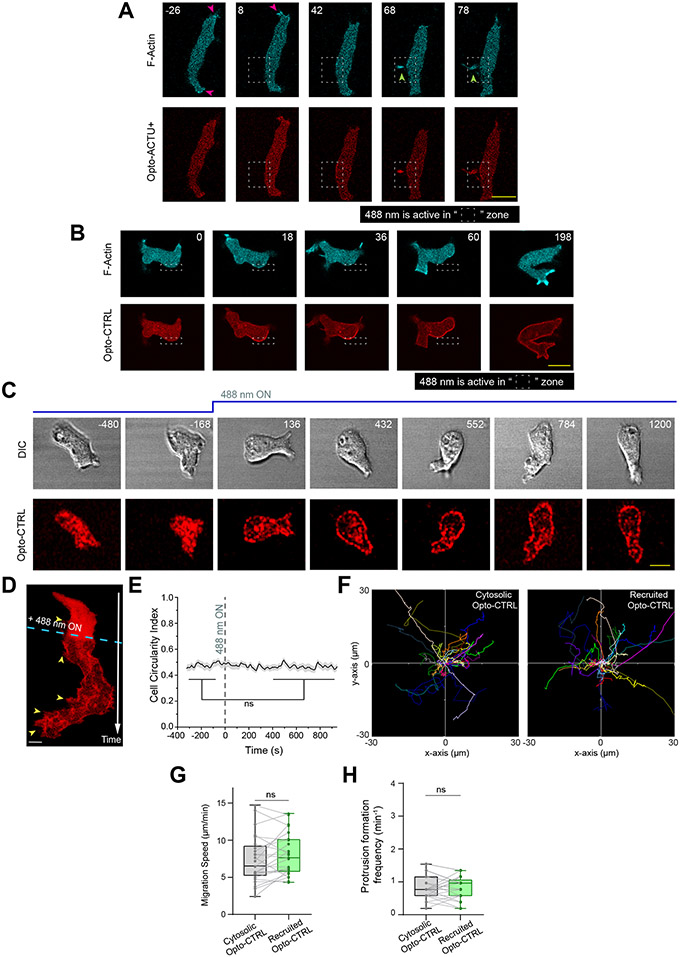
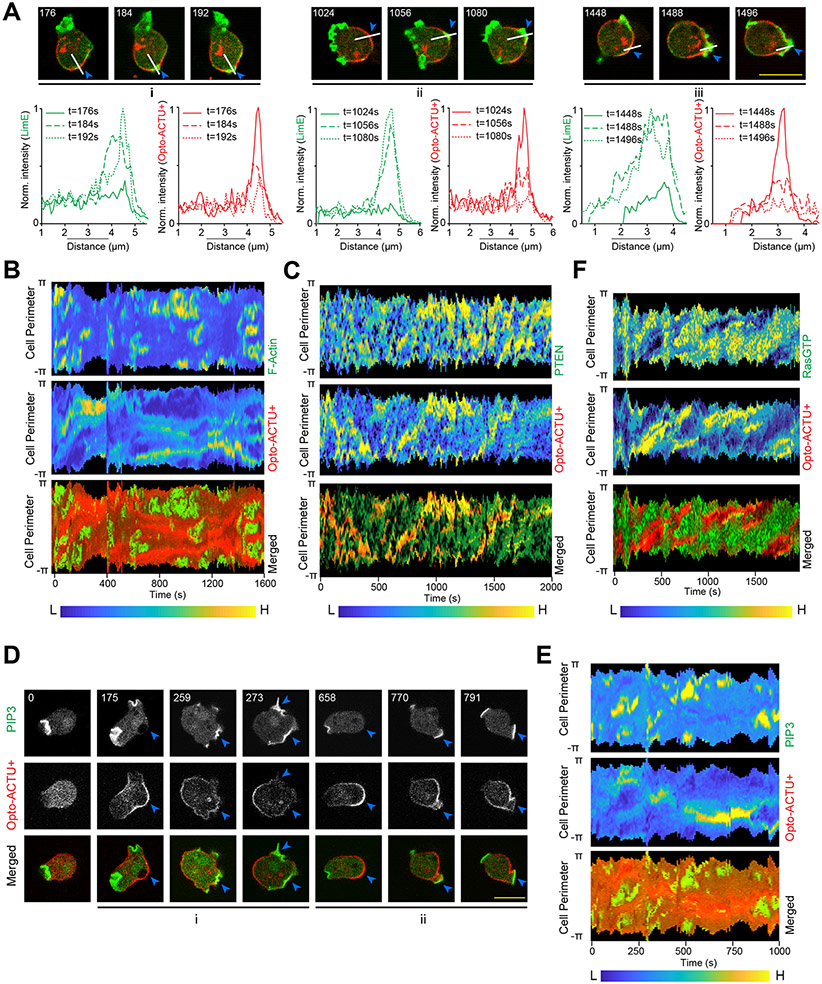
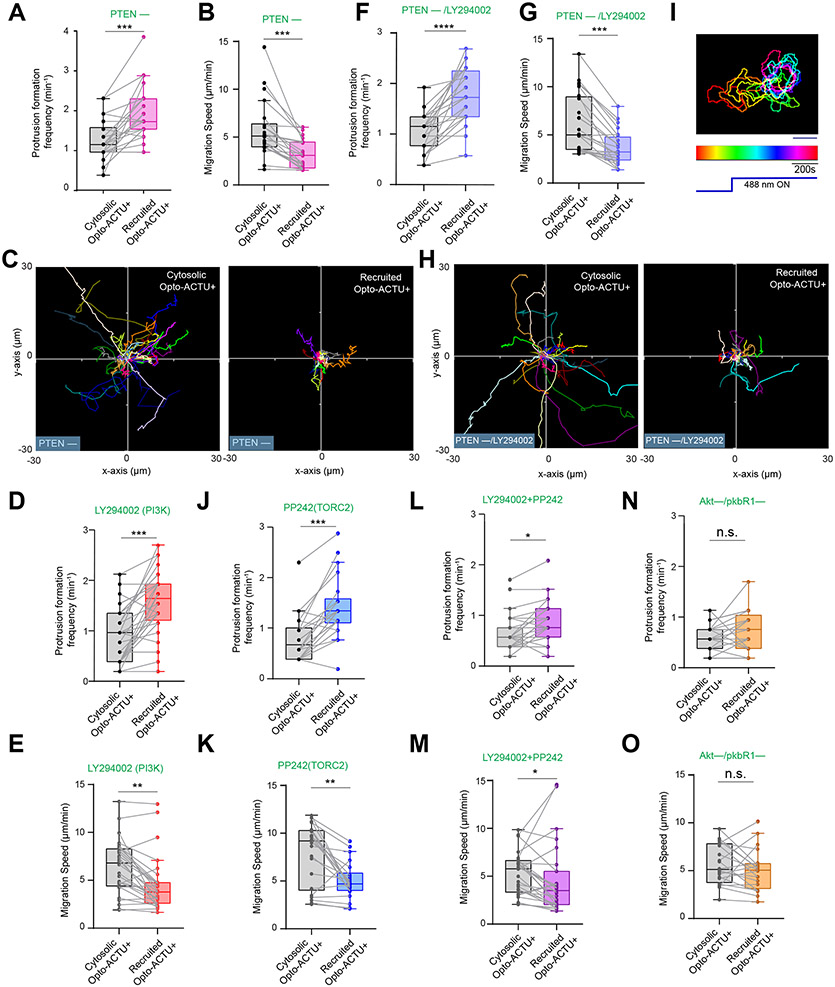
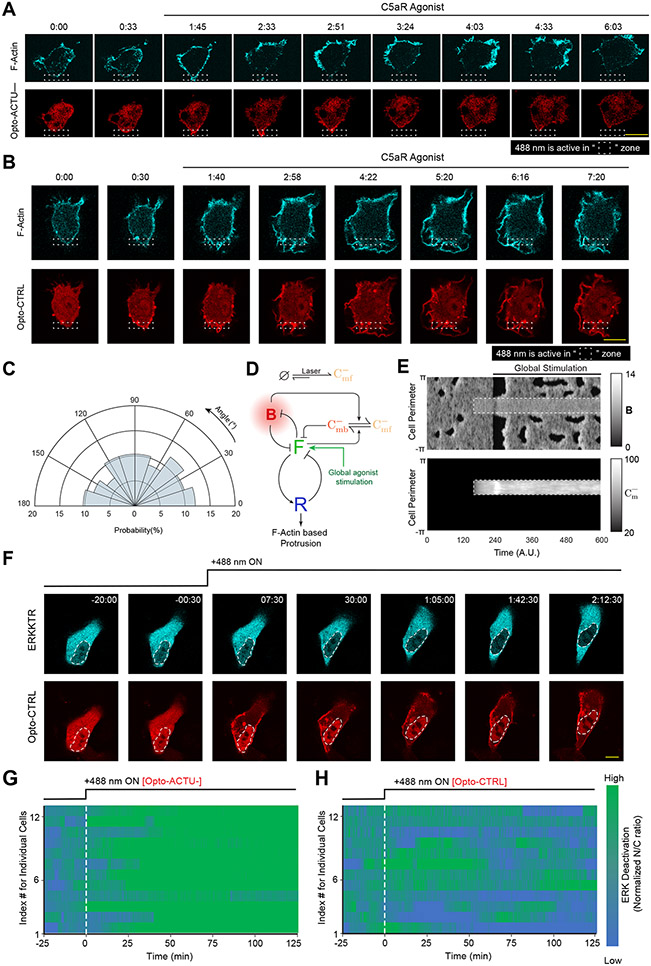
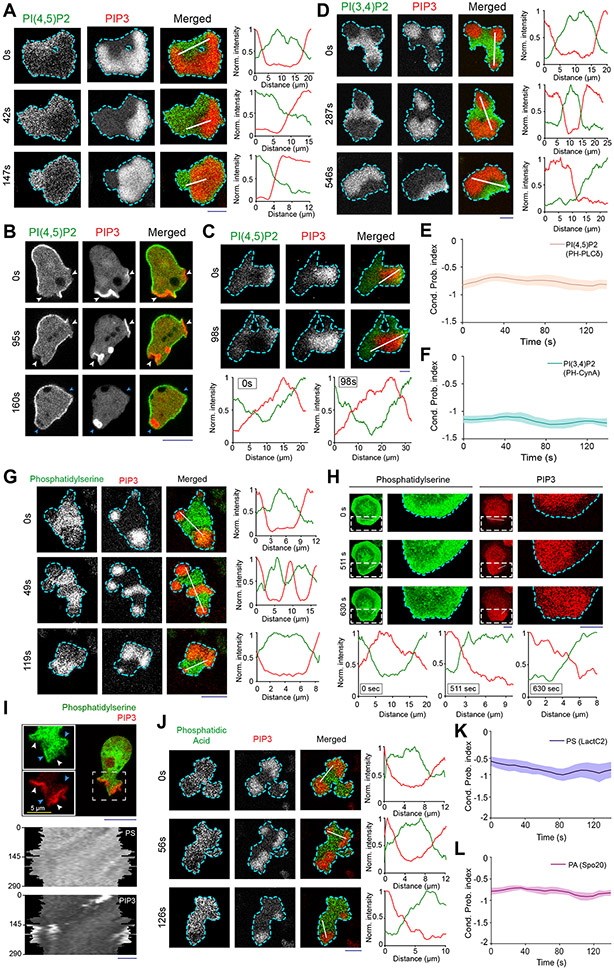
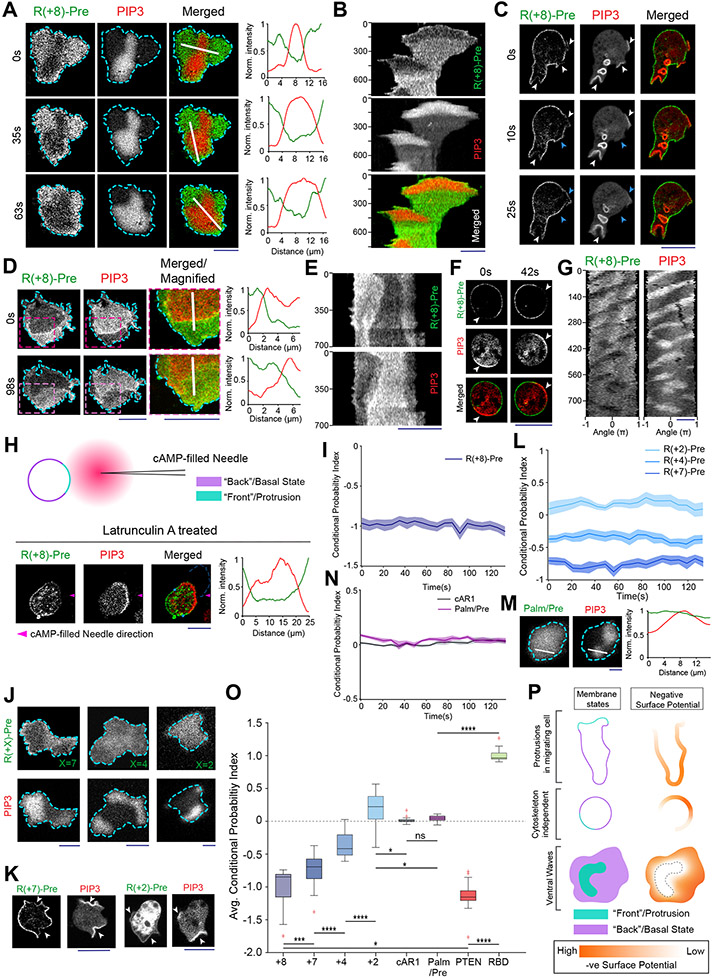
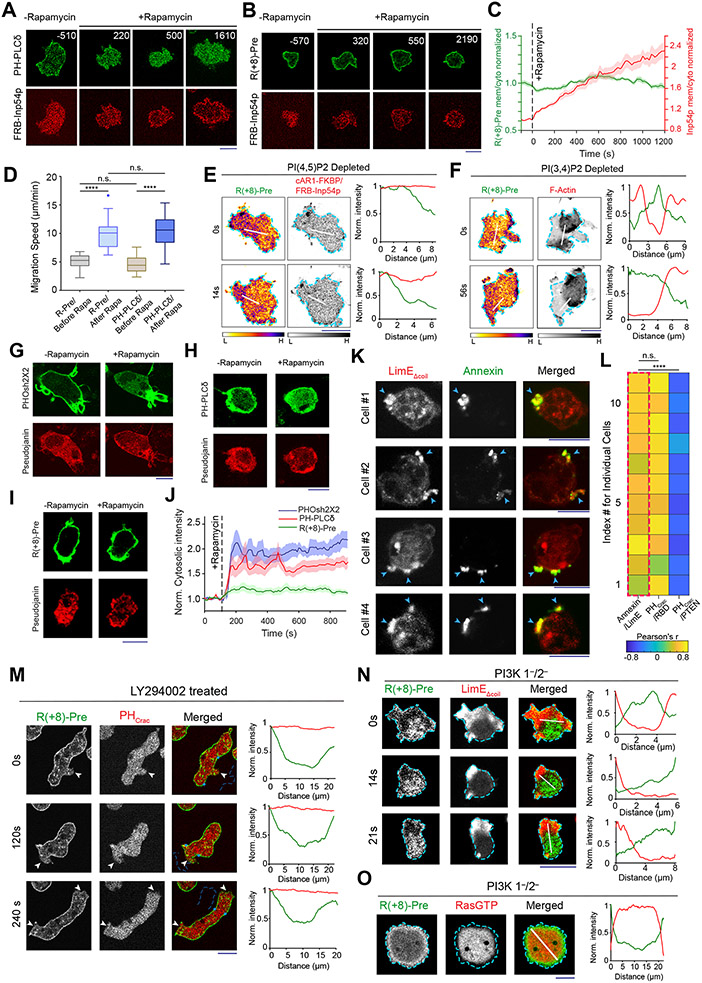
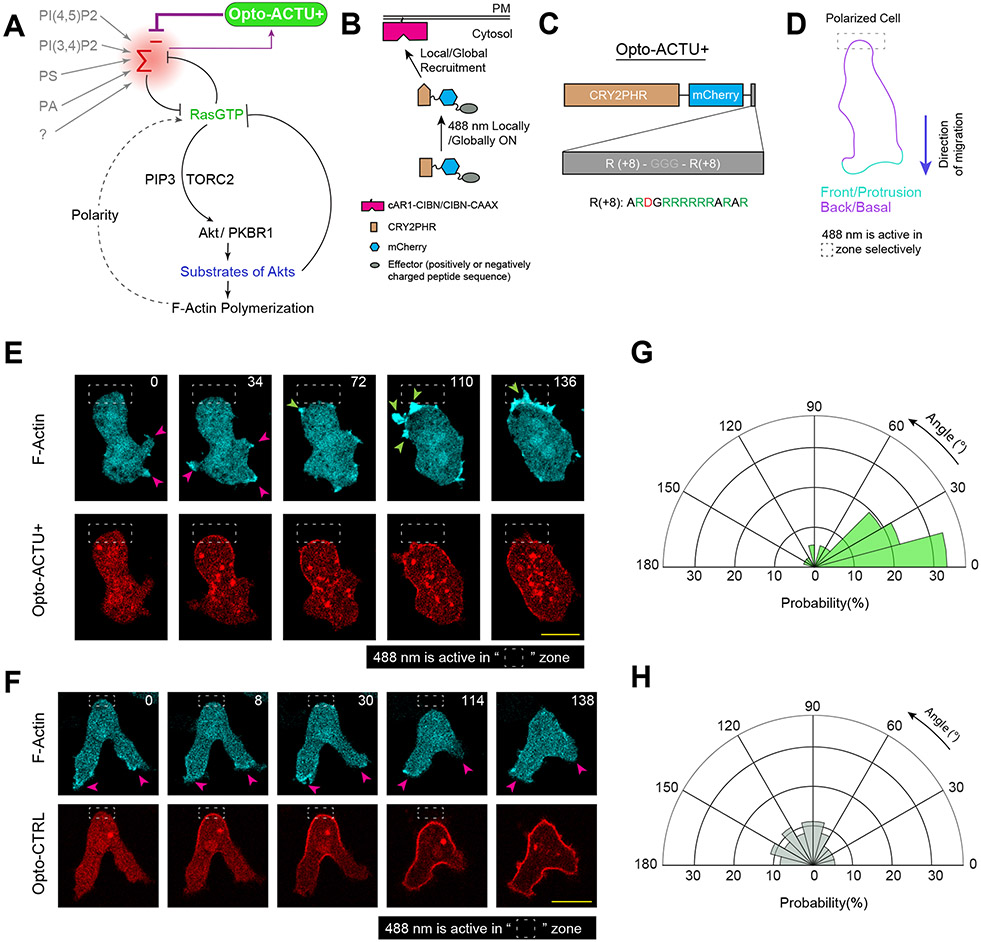
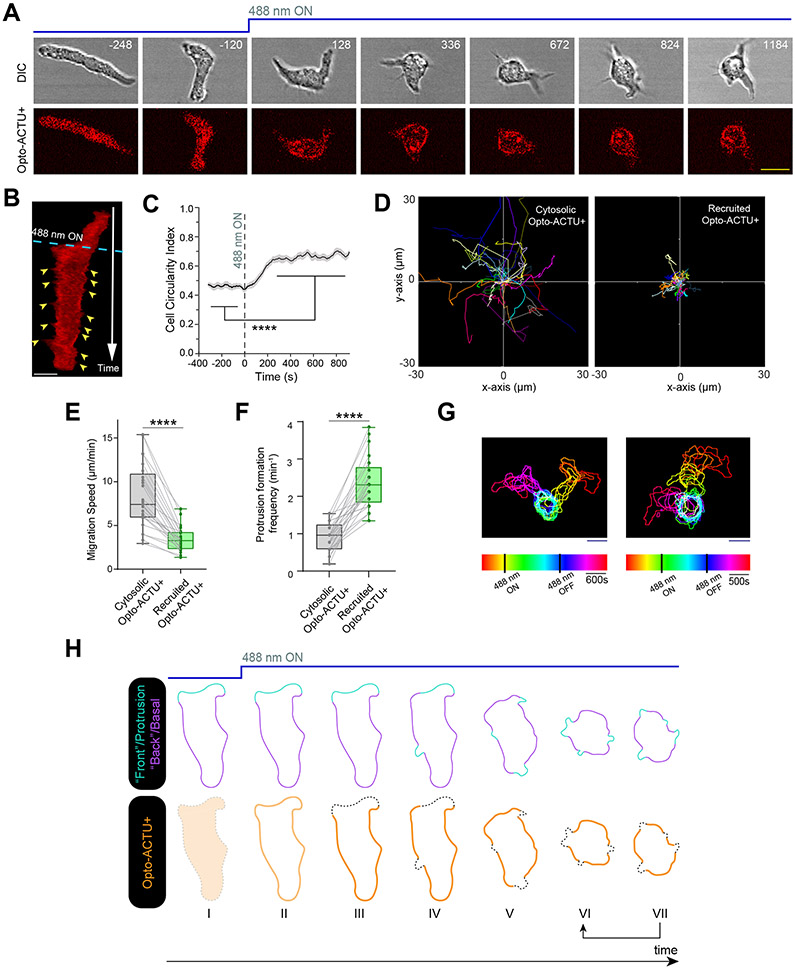
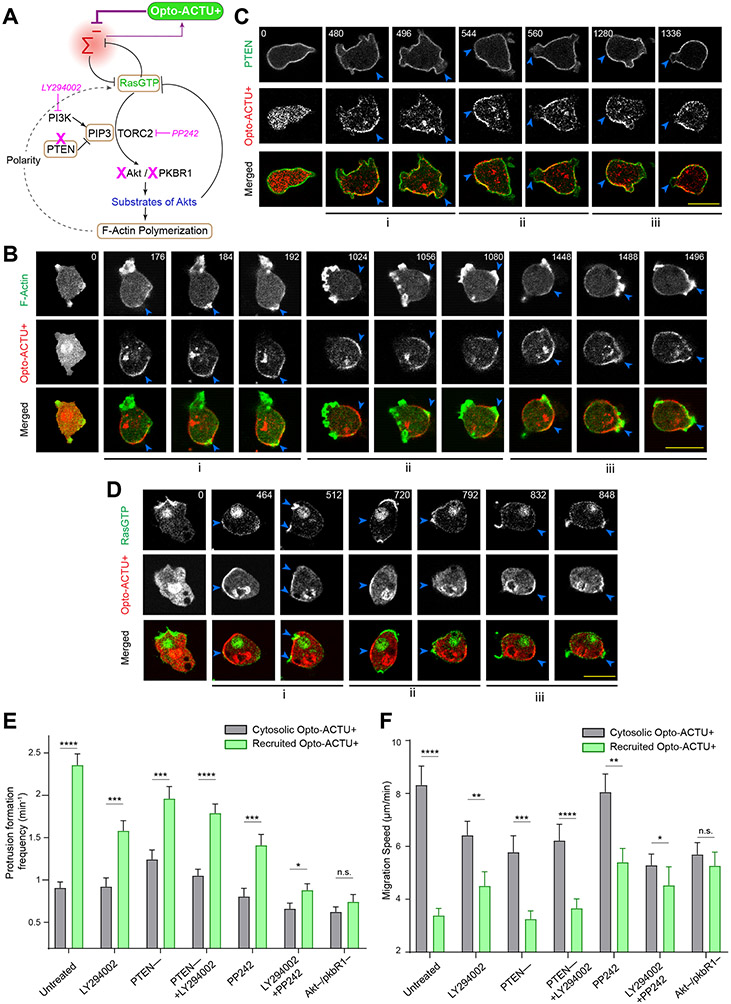
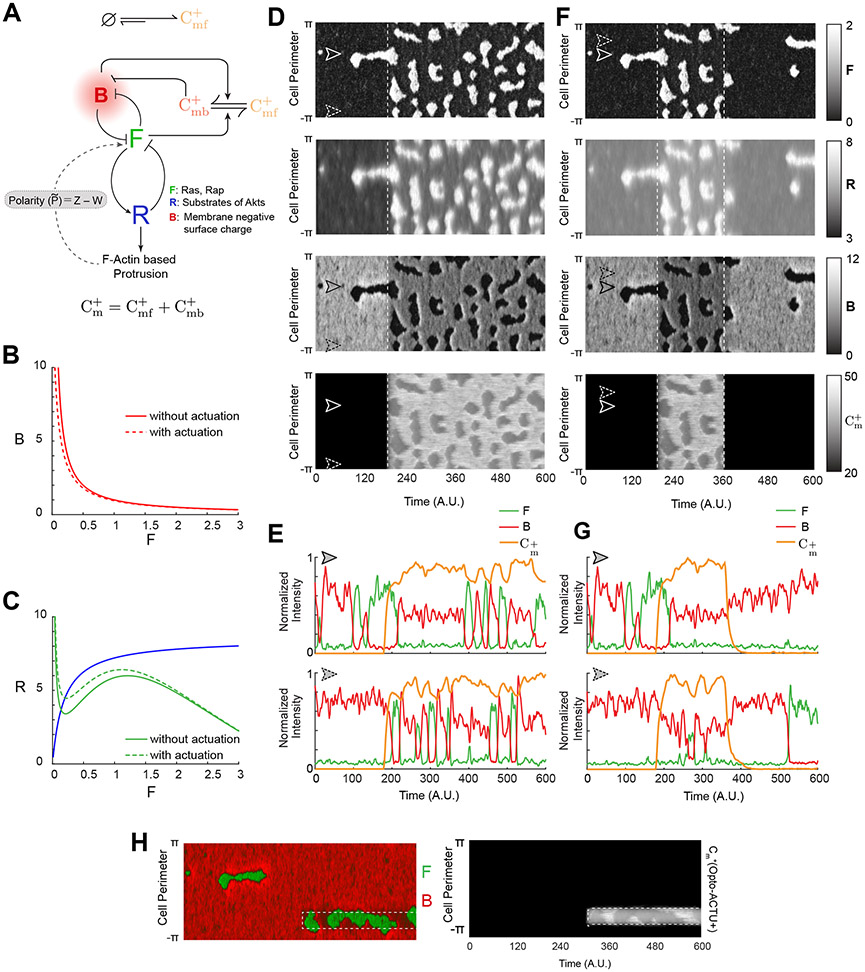
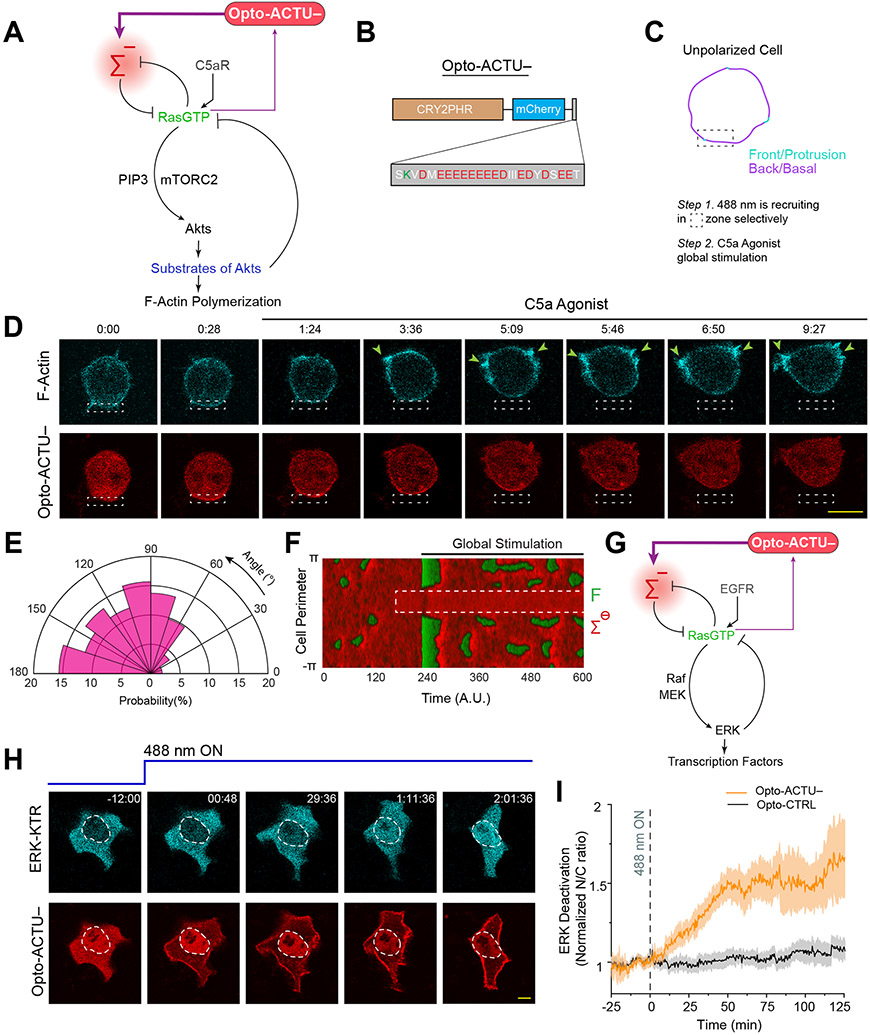
During cell migration and polarization, numerous signal transduction and cytoskeletal components self-organize to generate localized protrusions. Although biochemical and genetic analyses have delineated many specific interactions, how the activation and localization of so many different molecules are spatiotemporally orchestrated at the subcellular level has remained unclear. Here we show that the regulation of negative surface charge on the inner leaflet of the plasma membrane plays an integrative role in the molecular interactions. Surface charge, or zeta potential, is transiently lowered at new protrusions and within cortical waves of Ras/PI3K/TORC2/F-actin network activation. Rapid alterations of inner leaflet anionic phospholipids-such as PI(4,5)P2, PI(3,4)P2, phosphatidylserine and phosphatidic acid-collectively contribute to the surface charge changes. Abruptly reducing the surface charge by recruiting positively charged optogenetic actuators was sufficient to trigger the entire biochemical network, initiate de novo protrusions and abrogate pre-existing polarity. These effects were blocked by genetic or pharmacological inhibition of key signalling components such as AKT and PI3K/TORC2. Conversely, increasing the negative surface charge deactivated the network and locally suppressed chemoattractant-induced protrusions or subverted EGF-induced ERK activation. Computational simulations involving excitable biochemical networks demonstrated that slight changes in feedback loops, induced by recruitment of the charged actuators, could lead to outsized effects on system activation. We propose that key signalling network components act on, and are in turn acted upon, by surface charge, closing feedback loops, which bring about the global-scale molecular self-organization required for spontaneous protrusion formation, cell migration and polarity establishment.


Figures

Extended Data Figure 1:
Extended Data Figure 1:. Cells generate two mutually exclusive dynamic states in the membrane during migration and ventral wave propagation.
(A) Coordinated localization dynamics of signaling (PIP3) and cytoskeletal components (F-actin) in migrating Dictyostelium cell protrusions. Top panel: Live-cell images (Arrowheads: Protrusions enriched in both F-actin and PIP3). Bottom panel: 360° membrane kymographs showing consistency of coordination. Here and in all other kymographs, numbers on the left denote time in seconds, unless otherwise mentioned. Throughout this study, PIP3 level is marked by PHcrac in Dictyostelium and by PHAkt in macrophages, whereas, newly polymerizing F-actin is marked by LimEΔcoil (‘LimE’ hereafter) in Dictyostelium and by Lifeact in macrophages. (B, C) Coordinated propagation of signaling (PIP3) and cytoskeletal (F-Actin) components in ventral-surface cortical waves of Dictyostelium (B) and RAW 264.7 macrophages (C). Top two panels show live-cell images and bottom panels show line-scan intensity profile along the white lines. Similar convention is followed throughout this article. (D, E) Activated Ras and PIP3 colocalizing in the protrusions (D), whereas PTEN selectively dissociating from it (E), in migrating Dictyostelium cells. Left: Live-cell images, Right: 360° membrane kymographs. Arrowheads: Protrusions/front-states. Throughout this study, Ras-Binding Domain of Raf1 (RBD) was used as a detector of Ras activation. (F, G) In propagating waves of Dictyostelium, activated Ras and PIP3 dynamically colocalized and defined the front-state regions (F), whereas PIP3 and PTEN exhibit consistent complementarity (G). Live-cell images, line-scan intensity profiles, and line-kymographs are shown. (H) Complementary distribution of PIP3 and PTEN is independent of cytoskeleton. Here Dictyostelium cells are imaged in presence of Latrunculin-A (F-actin polymerization inhibitor). Arrowheads denoting front-states. (I) Schematic showing the front-back complementary patterning in three different scenarios: migrating cell protrusions, cytoskeleton-independent cortical symmetry breaking, and propagating ventral waves. For first two cases, we could study a 1D profile, whereas for ventral waves, we observed a 2D profile at the substrate-attached surface. Several examples of established signaling and cytoskeletal components are listed and categorized. In all situations, when a front-state was created from the back/basal-state of the membrane, back markers moved away from that particular domain, maintaining complementarity. Scale bars are 10 μm.
Extended Data Figure 2:
Extended Data Figure 2:. Developing conditional probability index as a metric to quantify the extent of co-localization and complementary localization.
(A) Schematics showing the application of the concepts of conditional probability in quantifying the degree of colocalization between two entities, R and G. The regions of the high enrichments of the species R and G are denoted as Rhigh and Ghigh whereas the depleted states are denoted as Rlow and Glow, respectively (top panels). The overlapped region (yellow in the bottom left panel) denotes Rhigh∩Ghigh. The other necessary probabilities are also shown which are required in the computation of the respective Conditional Probability Index (CP index). (B) The mathematical description of the CP index. As usual, P(Rhigh∣Ghigh) denotes Probability of selecting Rhigh, given Ghigh is already selected. Rest of the expression follow the same standard convention (please see methods for details). (C and D) Time series plots of CP indices of established back protein PTEN (C) and established front sensor RBD (D); number of cells nc =15 for RBD (C) and nc =17 for PTEN (D). Throughout this paper, to generate CP index time-plots, each cell was analyzed for nf =20 frames; data are mean ± SEM. Top panels show representative images of ventral waves in Dictyostelium cells co-expressing either PHCrac and RBD (C) or PHCrac and PTEN (D). Note that the sign of CP index of PTEN is negative and RBD is positive which demonstrate their back-state and front-state localization, respectively. The modulus value of CP indices indicates the extent of co- or complementary localization. Throughout this paper, all CP indices are calculated with respect to PIP3.
Extended Data Figure 3:
Extended Data Figure 3:. PI(4,5)P2, PI(3,4)P2, PS, and PA exhibit consistent yet dynamic back-state distribution.
(A) Representative line-kymograph of ventral waves in RAW 264.7 macrophages co-expressing PI(4,5)P2 biosensor (GFP-PHPLCδ), and PIP3 biosensor (PHAkt-mCherry). Time-lapse images and line-scan intensity profiles were shown in Figure 1C. (B) Representative line-kymograph of ventral waves in Dictyostelium cells co-expressing PI(3,4)P2 biosensor (PHCynA-KikGR) and PIP3 biosensor (PHCrac-mCherry). Time-lapse images and line-scan intensity profiles were shown in Fig. 1D. (C) Representative line-kymographs of ventral wave pattern shown in Dictyostelium cells co-expressing PS biosensor (GFP-LactC2) and PIP3 biosensor, (PHCrac-mCherry). Time-lapse images and line-scan intensity profiles were shown in Fig. 1G. (D) Representative line-kymographs of ventral wave pattern in RAW 264.7 macrophage cells co-expressing PS biosensor (GFP-LactC2) and PIP3 biosensor, (PHCrac-mCherry). Time-lapse images and line-scan intensity profiles were shown in Figure 1H. (E) Representative line-kymographs of ventral wave pattern in Dictyostelium cells co-expressing PA biosensor (GFP-Spo20) and PIP3 biosensor (PHCrac-mCherry). Time-lapse images and line-scan intensity profiles were shown in Fig. 1J. (F) Time-lapse images of migrating Dictyostelium cells co-expressing GFP-Spo20 and PHcrac-mCherry. White arrows: Protrusions where PIP3 is enriched and PA is depleted. Blue arrows: Spo20 returned back to the membrane as protrusions were eventually retracted and membrane domain returned to its basal back-state. (G) Box and Whisker plot of time-averaged CP indices of four anionic phospholipids (PI(4,5)P2, PI(3,4)P2, PS, and PA), together with uniform membrane marker control cAR1, back protein PTEN, and front sensor RBD; nc=16 cells for PI(4,5)P2/PHPLCδ, nc=10 cells for PI(3,4)P2/PHCynA, nc=15 cells for PS/LactC2, nc=16 cells for PS/Spo20, nc =20 cells for cAR1, nc = 17 cells for PTEN, nc = 15 cells for RBD. As mentioned earlier, to generate each datapoint, nf =20 frames were averaged for the above-mentioned number of cells.
Extended Data Figure 4:
Extended Data Figure 4:. Spatiotemporal organization of different mutated charge sensors and uniform membrane controls.
(A) Representative live cell images of Dictyostelium cells co-expressing GFP-R(+8)-Pre and PHCrac-mCherry under chemotactic gradient stimulation. Solid magenta arrowhead indicates the direction of micropipette (filled with 1 μM cAMP) for gradient stimulation. Dashed magenta arrowhead indicates the introduction of needle (t=0s) which is manifested by the transient global response in PHCrac channel. Cells were pre-treated with Latrunculin A. (B-D) Live-cell time-lapse images and line scan intensity profiles of Dictyostelium cells expressing PHcrac-mCherry, along with GFP-R(+7)-Pre (B) or GFP-R(+4)-Pre (C) or GFP-R(+2)-Pre (D), during ventral wave propagation, displaying decreasing extent of back-state preference of the surface charge sensors. The first time points were showed in Figure 2J (in grayscale colormap). (E and F) The 360° membrane kymographs of cells shown in Figure 2K, indicating R(+7)-Pre consistently moves away from PIP3-rich protrusions (E), whereas R(+2)-Pre is uniform over the cortex (F). (G) Live-cell images, line scan intensity profiles, and representative line-kymographs of ventral waves in Dictyostelium cells co-expressing PHcrac-mCherry and membrane marker cAR1-GFP, demonstrating that cAR1 does not distribute to front- or back- state regions and it is consistently uniform over the membrane. (H) Live-cell time-lapse images of migrating Dictyostelium cells co-expressing PHcrac-mCherry and cAR1-GFP showing cAR1 is symmetric over the membrane. Black arrows: PIP3- rich protrusions where cAR1 was present as well. (I) Live-cell images, linescan intensity profiles, and representative line-kymographs of ventral waves in RAW 264.7 cells co-expressing PHAKT-mCherry and membrane marker, LYN-GFP, showing consistent uniform profile of LYN over the membrane and no depletion in front-state area. (J) Live-cell time-lapse images of migrating Dictyostelium cells co-expressing PHcrac-mCherry and GFP-Palm/Pre, showing a symmetric profile of Palm/Pre over the membrane. Black arrows: Protrusions/front-states. In (G-J), the “Fire invert” LUT of Fiji/ImageJ was used so that it can clearly show any small inhomogeneity.
Extended Data Figure 5:
Extended Data Figure 5:. Different polybasic sequences localize to back-state regions depending on their charge, irrespective of their exact amino acid sequences.
(A, B) Representative live-cell images, lines can intensity profiles, and representative line-kymographs of Dictyostelium cells co-expressing PHCrac-mCherry and GFP-RacGCT (A) or PTEN1-18-CAAX (B), demonstrating consistent dynamic back distribution for RacGCT and limited back distribution for PTEN1-18-CAAX in ventral waves. For exact sequence details, please see Table S1. (C and D) Representative live-cell time-lapse images showing distribution of RacGCT (C) or PTEN1-18-CAAX (D) in migrating Dictyostelium cells (co-expressing PHCrac-mCherry), demonstrating localization profiles analogous to (A, B). (E, F) Time series plots of CP index of RacGCT (E) and PTEN1-18-CAAX (F) show the extent of back localization; nc=17 for RacGCT (E), nc= 12 for PTEN1-18-CAAX (F); mean ± SEM. (G) Comparison of localization profile by box plot of time-averaged CP indices of all surface charge sensors, together with uniform membrane marker controls, back protein PTEN, and front sensor RBD; R(+8)-Pre: nc =30, R(+7)-Pre: nc =23, R(+4)-Pre: nc =20, R(+2)-Pre: nc =12, RacGCT: nc =17, PTEN1-18-CAAX :nc =12, cAR1: nc =20, Palm/Pre: nc =11, PTEN: nc =17, RBD: nc =15. Box and whiskers are graphed as per Tukey’s method. All p-values by Mann-Whitney-Wilcoxon test.
Extended Data Figure 6:
Extended Data Figure 6:. Dynamics of surface charge sensor in PI(4,5)P2 and PI(3,4)P2 depleted cells.
(A) Time course of membrane/cytosol ratio of PHPLCδ and Inp54p upon rapamycin addition (indicated by black dashed vertical line), in Dictyostelium cells co-expressing cAR1-FKBP-FKBP, mCherry-FBP-Inp54p, and PHPLCδ-GFP, demonstrating PHPLCδ dissociated from membrane upon PI(4,5)P2 depletion; n=17 cells; mean ± SEM. (B and C) Cell tracks show the migration profile of Dictyostelium cells expressing chemically induced dimerization system cAR1-FKBP-FKBP and mCherry-FBP-Inp54p, along with PHPLCδ-GFP (B) or GFP-R(+8)-Pre (C), before and after rapamycin induced recruitment. Tracks demonstrating similar change in migration profile in both cases, as quantified in terms of migration speed in Figure 3D. To generate each track for nc=32 cells (in each case), cells were followed for nf=60 frames (7s/frame). (D) Representative image of Dd5p4 Dictyostelium cell (where PI(3,4)P2 level is low) co-expressing GFP-R(+8)-Pre and LimE-mRFP displaying characteristic membrane association and back localization of R(+8)-Pre; white arrows denote F-actin rich protrusions. (E) Quantification of membrane association of R(+8)-Pre in wild type and Dd5p4- cells, in terms of membrane/cytosol ratio; n=29 cells in each case; p-value by Mann-Whitney-Wilcoxon test. (F) Example of a quiet or non-protrusion forming Dictyostelium cells expressing LimE-mRFP, whose outer leaflet of membrane was allowed to transiently bind with Annexin V, Alexa Fluor 488 conjugate.
Extended Data Figure 7:
Extended Data Figure 7:. Local recruitment of Opto-ACTU+ in polarized cells induce de novo generation of protrusion near recruitment area, whereas neither local nor global recruitment of uncharged control Opto-CTRL elicit any phenotypic changes.
(A) A representative example of de novo formation of protrusion from a position of choice in the back-state region of the membrane by spatially confined recruitment of Opto-ACTU+. Magenta arrows: Old protrusions, Green arrows: New protrusions. (B) A representative example of spatially confined optogenetic recruitment of Opto-CTRL demonstrating no increase in protrusion generation from the site of recruitment. In (A-B), along with the Opto-ACTU+ (A) or Opto-CTRL(B), cells were co-expressing cAR1-CIBN and LimE-Halo; the numbers on the images denote time in seconds. (C-D) Time-lapse snapshots (C) and time-stack (D) of Dictyostelium cells co-expressing Opto-CTRL and cAR1-CIBN, demonstrating the unaltered cell morphology and migration behavior in polarized Dictyostelium cells, upon optogenetic recruitment. Numbers are time in seconds (C). 488 nm switched ON globally at t=0s. Yellow arrows: Opto-CTRL is uniform over cortex and did not move away from protrusions (D). (E-H) Quantification of cell morphology and migration mode in terms of cell circularity index (E), cell tracks (F), migration speed (G), and new protrusion formation frequency (H), upon Opto-CTRL recruitment (n=25 cells). Data shown as mean ± SEM over time in (E). In (F-H), for either before or after recruitment tracks, each cell tracked for nf=40 frames (t=320 s). Tracks were reset to the same origin in (F). For pairwise comparison, tracks are color-coded in (F) and data from same cell are connected by gray line in (G) and (H). The p-values by Mann-Whitney-Wilcoxon test.
Extended Data Figure 8:
Extended Data Figure 8:. Global recruitment of Opto-ACTU+ can cause spatiotemporally confined activation of Ras/PI3K/Akt/TORC2/F-actin network components.
(A) Intensity profiles of LimE-GFP and Opto-ACTU+ along the white lines (the images are same as shown in Figure 6B) demonstrate that F-actin polymerizes in the domains of membrane where Opto-ACTU+ accumulates and when that leads to a protrusion, Opto-ACTU+ moves away with a short time delay. (B) 360° membrane kymograph of cell shown in Figure 6B. (C) 360° membrane kymograph of cell shown in Figure 6C. (D) Time-lapse live cell images of Dictyostelium cells co-expressing Opto-ACTU+, cAR1-CIBN, and PHCrac-YFP where recruitment was started at t=0s. Numbers show time in seconds. The “i” and “ii” are showing two different PIP3 production events which eventually lead protrusion formation. For each event, blue arrowheads are showing the areas where Opto-ACTU+ was first accumulated which in turn became the areas of PIP3 production and eventually, after protrusion formation, Opto-ACTU+ moved away to a newer back-state area. (E) 360° membrane kymograph of cell shown in (D). (F) 360° membrane kymograph of cell shown in Figure 6D.
Extended Data Figure 9:
Extended Data Figure 9:. The effect of specific genetic and pharmacological perturbations upon the phenotypic changes induced by Opto-ACTU+ recruitment.
(A-C) Quantification of migration profile changes in terms of new protrusion formation frequency (A), speed (B), and cell tracks (C), upon Opto-ACTU+ recruitment, in PTEN– Dictyostelium cells; nc= 22 cells. (D, E) Quantification of migration profile changes in terms of new protrusion formation frequency (D) and speed (E), upon Opto-ACTU+ recruitment in Dictyostelium cells, pre-treated with PI3K inhibitor LY294002; nc= 28 cells. (F-H) Quantification of migration profile changes in terms of new protrusion formation frequency (F), speed (F), and cell tracks (H), upon Opto-ACTU+ recruitment in PTEN– Dictyostelium cells, pre-treated with LY294002; nc= 24 cells. (I) Temporally color-coded cell outlines of a representative migrating PTEN– Dictyostelium cells, pre-treated with PI3K inhibitor LY294002, showing cell morphology and migratory profile before and after 488nm was turned on to recruit Opto-ACTU+ (corresponding to Video S11). (J-O) Quantification of migration profile changes in terms of new protrusion formation frequency (J, L, N) and migration speed (K, M, O) upon Opto-ACTU+ recruitment under different genetic and pharmacological inhibitions. In (J-K) cells were pre-treated with PP242 to inhibit TORC2 (nc= 22 cells); in (L-M) cells were pre-treated with both LY294002 and PP242 to simultaneously block PI3K and PP242 (nc= 27 cells); in (N-O), Akt/PKBR1 double knockout cell line was used (nc= 21 cells). For each case, each of the nc cells were tracked for nf=40 frames (8 sec/frame was imaging frequency) and time averages were taken. Tracks were reset to the same origin in (C) and (H). For pairwise comparison, tracks are color-coded in (C) and (H). In all box plots here, for pairwise comparison, data from same cell are connected by gray lines. The p-values by Mann-Whitney-Wilcoxon test.
Extended Data Figure 10:
Extended Data Figure 10:. Selective recruitment of uncharged control Opto-CTRL cannot suppress protrusion in RAW 264.7 macrophages or global recruitment of Opto-CTRL cannot deactivate ERK in MCF10A cells, unlike Opto-ACTU−.
(A) Representative live-cell time-lapse images of RAW 264.7 cells undergoing light-triggered spatially confined recruitment of Opto-ACTU−, followed by global stimulation with C5a receptor agonist, demonstrating selective protrusion suppression in the site where Opto-ACTU− was locally recruited and robust protrusion formation in other areas of cortex. Time in min:sec format. Cells were co-expressing Opto-ACTU−, CIBN-CAAX, and Lifeact-mVenus. (B) Representative live-cell time-lapse images of RAW 264.7 cells undergoing light-triggered spatially confined recruitment of Opto-CTRL, followed by global stimulation by C5a receptor agonist. Time in min:sec format. Cells were co-expressing Opto-CTRL, CIBN-CAAX, and Lifeact-mVenus. (C) Polar histogram indicating probability of protrusion formation is essentially uniform over the cortex upon global stimulation with C5a receptor agonist, in spatially confined Opto-CTRL recruited cells; nc=12 cells, np=59 protrusions. (D) Schematic showing coupled system of excitable network, polarity module, and Opto-ACTU− system input along with global agonist stimulation. (E) The simulated kymographs of B (top) and Cm (bottom) in response to local recruitment of Opto-ACTU−. The location of recruitment is denoted by the white dashed box. The solid black line denotes the span of global agonist stimulation. (F) Representative live-cell time-lapse images of a MCF10A cell displaying ERKKTR maintaining its cytosolic distribution upon Opto-CTRL recruitment, demonstrating no substantial ERK deactivation; cells were pre-treated with and maintained in a saturated dose of EGF throughout the experiment. Time in hr:min:sec format; 488 nm laser was first turned ON at t=0 min. (G, H) Individual cell level changes in the nuclear/cytosolic ratio of ERKKTR over time, upon recruitment of Opto-ACTU− (G) or Opto-CTRL (H). Population average is in Figure 8I. The color scale shown in right is applicable to both panels.
Figure 1.
Figure 1.. Multiple anionic phospholipids dynamically self-organize to the back-state regions of the membrane.
(A, B) Representative live-cell time lapse images of Dictyostelium cells co-expressing PI(4,5)P2 sensor PHPLCδ-GFP and PI(3,4,5)P3 sensor PHcrac-mCherry, during ventral wave propagation (A) or migration (B) showing PHPLCδ dynamically localizes to the back-stare regions in ventral waves (A) and analogously moved away from protrusions in migrating cells (B). White arrows showing protrusions where PIP3 is enriched and PHPLCδ is depleted whereas blue arrows showing PHPLCδ returning to the membrane domains where protrusions were retracted (B). (C) Live-cell images of RAW 264.7 macrophage co-expressing GFP-PHPLCδ and PHAkt-mCherry demonstrating dynamic complementary distribution in its ventral waves. (D) Live-cell images of Dictyostelium cells co-expressing PHcrac-mCherry and PI(3,4)P2 sensor PHCynA-KikGR, demonstrating the spatiotemporal back localization of PI(3,4)P2 in its ventral waves. (E, F) Time series plot of CP index for PI(4,5)P2 (E) and PI(3,4)P2 (F). PI(4,5)P2: nc=16 cells; PI(3,4)P2: nc=11 cells. (G-I) Dynamic back-state distribution of PS biosensor, GFP-LactC2, in ventral waves of Dictyostelium (G) and in RAW 264.7 macrophages (H). Corresponding GFP-LactC2 depletion from protrusions in migrating Dictyostelium cells (I). Protrusions and front-state regions of ventral waves are marked by PIP3 sensors. Bottom two panels of (I) show 360° membrane-kymographs around cell perimeter. In all kymographs, numbers on the left denote time in seconds, unless otherwise mentioned. (J) Complementary localization of PA sensor, GFP-Spo20, and PIP3 in Dictyostelium ventral waves. (K, L) Quantification of extent of back localization of PS and PA by time-series plot of CP index of LactC2 (K; nc=15 cells) and Spo20 (L; nc=16 cells); mean ± SEM. For all ventral wave figures, line scans are shown in right or bottom most panels. For all CP index time-plots in this paper, each of the nc cells was analyzed for nf =20 frames; all CP indices are calculated with respect to PIP3; mean ± SEM are plotted for all CP indices plots. For all figures, scale bars are 10 μm, unless otherwise mentioned. Source numerical data are available in source data.
Figure 2.
Figure 2.. Back-state of the membrane maintains higher negative surface charge on the inner leaflet, compared to the front-state of the membrane.
(A) Representative live-cell images of propagating ventral waves in a Dictyostelium cell co-expressing GFP-R(+8)-Pre (Surface Charge Sensor) and PHCrac-mCherry. (B) Representative line-kymograph of wave pattern shown in cell (A). (C) Live-cell images of migrating Dictyostelium cell showing GFP-R(+8)-Pre is depleted in protrusions. White arrows: PIP3 enriched protrusion; Blue arrows: Retracted protrusions. (D) Ventral waves in RAW 264.7 macrophages co-expressing GFP-R(+8)-Pre and PHAkt-mCherry, displaying analogous complementary kinetics. (E) Representative line-kymograph of wave pattern shown in cell (D). (F, G) Live-cell images (F) and 360° membrane-kymograph (G) of Actin-polymerization inhibitor Latrunculin-A treated Dictyostelium cells co-expressing GFP-R(+8)-Pre and PHCrac-mCherry. White arrows (F): Front-state, showing bright PIP3 patches and depletion of surface charge sensor. (H) R(+8)-Pre showing complementary localization with respect to front-state marker PIP3, during chemotactic gradient stimulation mediated receptor activation. Magenta arrowhead: Direction of micropipette. Cells were pre-treated with Latrunculin-A. (I) Time series plot of CP index of R(+8)-Pre, nc=29 cells. (J) Representative live-cell images of ventral waves in Dictyostelium cell membrane co-expressing PHCrac-mCherry, and GFP-R(+7)-Pre (left), GFP-R(+4)-Pre (middle), GFP-R(+2)-Pre (right). (K) Live-cell images showing R(+7)-Pre and R(+2)-Pre distribution, with respect to PIP3-rich protrusions (White arrows: protrusions), in migrating cells. (L) Time series plot of CP indices of mutated surface charge sensors R(+7)-, R(+4)-, R(+2)-Pre. +7: nc =23, +4: nc =20, +2: nc =12 cells. (M) GFP-Palm/Pre exhibiting uniform distribution in ventral waves, whereas PHCrac-mcherry was enriched in front-state regions. (N) Time series plot of CP indices of uniform membrane-markers cAR1 and Palm/Pre; cAR1: nc =20, Palm/Pre: nc =11. (O) Time averaged CP indices of surface charge sensors, uniform membrane marker controls, standard back protein PTEN (nc =17), and front sensor RBD (nc =15). To generate each datapoint in box plot, CP index values of nf =20 frames were averaged for each cell. Box and whiskers are graphed using Tukey’s method. The p-values by Mann-Whitney-Wilcoxon test. (P) Schematic of negative surface potential distribution in front- and back-state of the cell membrane during migration, cytoskeleton-independent symmetry breaking and ventral wave propagation. Source numerical data are available in source data.
Figure 3.
Figure 3.. Dynamics of inner membrane surface charge sensor R(+8)-Pre in different anionic phospholipid depleted cells.
(A, B) The dynamics of membrane localization of PHPLCδ-GFP (A) or GFP-R(+8)-Pre (B), before and after PI(4,5)P2 depletion in Dictyostelium cells, by recruiting mCherry-FRB-Inp54p to membrane-bound cAR1-FKBP. Numbers indicate time in seconds; rapamycin added at 0s. (C) Time course of membrane-to-cytosol ratio of R(+8)-Pre (green) and Inp54p (red) upon rapamycin addition (indicated by dashed vertical line); nc=20 cells; mean ± SEM. (D) Migration speed of cells, co-expressing chemically inducible dimerization system for PI(4,5)P2 depletion, along with either GFP-R(+8)-Pre or PHPLCδ-GFP, before and after rapamycin addition; nc=32 cells tracked for nf=60 frames for each case. (E) Spatiotemporal back localization of R(+8)-Pre in PI(4,5)P2 depleted cells, shown in “fire invert” colormap of Fiji/ImageJ; Inp54p recruited to uniform membrane-anchor cAR1 is symmetric in ventral waves (middle panel). (F) Complementary localization of GFP-R(+8)-Pre and LimE-mCherry in ventral waves of Dd5p4 Dictyostelium cells. (E, F): L, low; and H, high. (G-I) Live-cell images of RAW 264.7 macrophages showing the membrane localization profile of PI4P biosensor PHOsh2X2-GFP(G), PI(4,5)P2 biosensor PHPLCδ-GFP (H), or GFP-R(+8)-Pre (I), before and after recruiting Pseudojanin to membrane anchor Lyn-FRB-CFP. (J) Time course of normalized cytosolic intensity of PHOsh2X2, PHPLCδ, and R(+8)-Pre, upon rapamycin addition; time of addition is indicated by dashed vertical line; PHOsh2X2: nc=16 cells, PHPLCδ: nc=10 cells, R(+8)-Pre: nc=12 cells; mean ± SEM. (K) Representative examples of protrusion forming Dictyostelium cells expressing LimE-GFP, whose outer leaflet of membrane was allowed to transiently bind with Annexin V-Alexa Fluor 488. (L) Heatmap of Pearson correlation coefficients (PCC) between Annexin V and LimE (leftmost column, highlighted with dashed red rectangle). PCCs between (PHCrac and RBD) and (PHCrac and PTEN) are shown to demonstrate standard Co- and counter- localization profiles. Correlation coefficients were calculated along cell membrane; nc=11 cells in each case. (M) Live-cell images of LY294002-treated migrating Dictyostelium cell co-expressing GFP-R(+8)-Pre and PHCrac-mCherry. White arrows: Protrusions where PIP3 was depleted yet surface charge gradient was maintained. (N, O) Live-cell images of ventral waves in PI3K 1/2 Dictyostelium cells co-expressing GFP-R(+8)-Pre and front-state markers LimE-mCherry (N) or RBD-mCardinal (O). All p-values by Mann-Whitney-Wilcoxon test. Source numerical data are available in source data.
Figure 4.
Figure 4.. Localized lowering of membrane surface charge can trigger de novo protrusion generation from the area of reduced surface charge.
(A) Scheme for lowering negative surface charge by the recruitment of positively charged optogenetic-actuator, Opto-ACTU+, in context of overall biochemical excitable network topology. Σ: back-state defined by overall negative surface charge. Opto-ACTU+ interfere into the topology by getting associated with Σ, but in turn it provides a negative feedback to Σ. (B) Scheme for optogenetic actuator recruitments. Turning on 488 nm laser changes the conformation of cytosolic cryptochrome module and as a result, CRY2PHR along with its associated positively or negatively charged peptide, gets recruited to the plasma membrane bound CIBN. The cAR1-CIBN is used in all Dictyostelium experiments and CIBN-CAAX is used in all mammalian systems as membrane anchor. (C) Design of Opto-ACTU+ with net charge +16. Positively charged amino acids are shown in green and the negatively charged amino acids are shown in red. (D) Experimental setup of selective optical recruitment at the back of polarized Dictyostelium cells. (E) Representative time-lapse images of selective de novo protrusion formation from the area of recruitment in Dictyostelium cells co-expressing Opto-ACTU+, cAR1-CIBN, and LimE-Halo. (F) Representative time-lapse images of Dictyostelium cells co-expressing Opto-CTRL, cAR1-CIBN, and LimE-Halo demonstrating locally restricted recruitment of Opto-CTRL did not generate new protrusions from the site of recruitment. In (E) and (F), dashed rectangle shows the area where 488 nm laser was selectively illuminated for recruitment; magenta and green arrows show existing and newly induced protrusions, respectively; time in seconds. (G, H) Polar histogram of angle of protrusion formation with respect to recruitment area, in case of Opto-ACTU+ (G) and Opto-CTRL (H) recruitment; Probabilities were calculated for nc=23 cells, np=36 protrusions in (G) and for nc=20 cells, np=36 protrusions in (H). Source numerical data are available in source data.
Figure 5.
Figure 5.. Globally lowering negative surface charge of the membrane can abolish the pre-existing polarity by consistently generating new protrusions from the back-state regions.
(A, B) Time-lapse snapshots (A) and time-stack (B) demonstrating cell morphology and migration mode changes in a polarized Dictyostelium cell, upon recruitment of Opto-ACTU+. Cells were co-expressing Opto-ACTU+ and cAR1-CIBN. Time in seconds. 488 nm laser switched ON globally at t=0s. Yellow arrowheads in (B): newly generated protrusions. Note that Opto-ACTU+ is consistently depleted in the protrusions. (C-F) Quantification of cell morphology and migration mode changes in terms of cell circularity index (C), cell tracks (D), migration speed (E), and new protrusion formation frequency (F) upon Opto-ACTU+ recruitment (n=25 cells). Data are mean ± SEM in (C). In (D-F), for either before or after recruitment, each cell was tracked for nf=40 frames (8 sec/frame was the image acquisition frequency). Tracks were reset to the same origin in (D). For pairwise comparison, tracks are color-coded in (D) and data from same cell are connected by gray lines in (E) and (F). All p-values by Mann-Whitney-Wilcoxon test. (G) Two representative examples of temporally color-coded cell outlines showing cell morphology and migratory mode before 488nm was turned on, during 488nm kept on, and after 488nm was switched off. (H) Schematic proposing how Opto-ACTU+ recruitment changes cell morphology and migratory mode. Opto-ACTU+ is recruited globally as expected (I to II); however, presumably due to its positive charge, it quickly accumulates along the back regions of the cell (III). Consequently, new protrusions are elicited from these back regions and the cell begins to lose polarity (IV and V). And at the same time, as some areas of erstwhile back regions are converted to front, Opto-ACTU+ redistributes again to the newly formed back regions (IV to VII). This in turn generates fresh protrusions there and this entire cycle is repeated (shown in arrows between VI and VII). As a result, protrusions are generated randomly, migration becomes impaired, and pre-existing polarity is abrogated. Source numerical data are available in source data.
Figure 6.
Figure 6.. The phenotypic changes induced by Opto-ACTU+ recruitment is mediated by the Ras/PI3K/Akt/TORC2/F-actin network.
(A) Scheme showing nodes of signaling and cytoskeletal network that were monitored and/or perturbed, in conjunction with Opto-ACTU+ recruitment. Tan-colored rectangles: Molecules whose dynamics were recorded; Magenta blocked arrows: Pharmacological inhibitions; Magenta cross-marks: Genetic knockouts. (B) Live-cell images of Dictyostelium cells co-expressing Opto-ACTU+, cAR1-CIBN, and LimE-GFP, where recruitment was started at t=0s (first time point). The “i”, “ii”, “iii” are showing three representative actin polymerization cases. For each case, three events are shown: first, Opto-ACTU+ accumulated inside a domain of the membrane; second, F-actin polymerization was initiated there; and finally, when that domain fully turned into front state, Opto-ACTU+ moved away from that domain. Throughout this figure, Blue arrowheads: Membrane domains where Opto-ACTU+ was first accumulated and where back-states were replaced by front events; time in seconds. (C) Live-cell images of Dictyostelium cells co-expressing Opto-ACTU+ and cAR1-CIBN, along with PTEN-GFP (C) or RBD-GFP (D), where recruitment was started at t=0s (first time point). The “i”, “ii”, “iii” are showing three representative cases of PTEN dissociation from the membrane (C) or Ras activation on the membrane (D). For each case, two events are shown: first, the accumulation of recruited Opto-ACTU+ inside a domain of the membrane, and second, when that accumulation resulted in the dissociation of PTEN (as in C) and Ras activation (as in D) in that particular domain which, in turn, caused Opto-ACTU+ to move away from there. (E, F) Quantification of phenotypic changes upon Opto-ACTU+ recruitment in terms of new protrusion formation frequency (E) and migration speed (F), in presence of different pharmacological inhibitors or genetic knockouts. Untreated: nc= 28 cells; LY294002: nc= 28 cells; PP242: nc= 22 cells; PTEN –: nc= 22 cells; PTEN –+ LY294002: nc= 24 cells; LY294002+PP242: nc= 27 cells; Akt/PKBR1: nc= 21 cells. For each case, each of the nc cells were tracked for nf=40 frames (8 sec/frame) and time averages were taken. For pairwise comparison and more detailed data, please see Figures S9. Mean ± SEM are shown. The p-values by Mann-Whitney-Wilcoxon test. Source numerical data are available in source data.
Figure 7.
Figure 7.. In silico reduction of membrane surface charge recreates the polarity breaking and demonstrates increased activity over the membrane.
(A) Schematic showing coupled system of excitable network, polarity module (involving Z and W), and Opto-ACTU+ (Cm+) system. The excitable network involves membrane states F (front), B (back, defined by overall surface charge of inner membrane), and R (refractory). The polarity module comprises of local activator Z and delayed globally diffusing inhibitor W. The Opto-ACTU+ system constitutes of fast diffusing state Cmf+ and almost stationary membrane bound state Cmb+. The total charge actuator, Cm+ on the membrane is the summation of both the fast-diffusing and membrane-bound states. (B) Plot of B vs F with and without Opto-ACTU+. (C) F (green lines) and R (blue line) nullclines with and without Opto-ACTU+ (under the steady-state assumption for B). (D) The simulated kymographs of F (first), R (second), B (third) and Cm+ (fourth) in response to global recruitment. The instant of recruitment is shown by the white dashed line. (E) Line scans at two locations (as denoted by dashed and solid arrows) on the simulated kymographs showing the temporal profiles of F (green), B (red) and Cm+ (orange). (F, G) In silico reversible recruitment of Opto-ACTU+ demonstrating the reversibility of polarity breaking and protrusion formation events. (F) is showing the simulated kymographs and (G) is showing the line scans at two locations (as denoted by dashed and solid arrows). The color schemes of F, R, and B are same as (E). The instant of recruitment is shown by the first white dashed line and recruitment was stopped in the second dashed line. (H) Simulated kymographs of membrane states in response to the selective recruitment of Opto-ACTU+ (Cm+). Merged view of F (green) and B (red) are shown in the left panel; profile of Opto-ACTU+ (Cm+) was shown in the right panel (in grayscale); White dashed box: Location of in silico selective recruitment. The same timescale is applicable in both the left and right panels. Note that, simulated selective recruitment created de novo front-state around recruitment area which, in turn, caused the recruited actuator to move away (as happened in global recruitment).
Figure 8.
Figure 8.. Increase in negative surface potential in the inner membrane suppresses protrusions in macrophages and, separately, deactivates the EGF induced ERK activity in epithelial cells.
(A) Scheme for elevation of negative surface charge on membrane by the recruitment of negatively-charged optogenetic actuator, Opto-ACTU−, in context of biochemical excitable network topology with receptor input. (B) Design of Opto-ACTU− with net charge −14. Positively-charged amino acids in green, negatively-charged amino acids in red. (C-E) Experimental setup of selective Opto-ACTU−recruitment, followed by uniform C5a stimulation, in unpolarized RAW 264.7 macrophages (C); representative time-lapse images demonstrating cell migration driven by selective suppression of protrusion in the site where Opto-ACTU− was locally recruited and protrusion formation in other areas of cortex upon uniform C5a stimulation (D); polar histogram indicating higher probability of protrusion formation away from recruitment area. Time in min:sec format (D); Green arrows: F-actin-rich protrusions marked by Lifeact (D); nc=12 cells, np=51 protrusions (E). Cells were co-expressing Opto-ACTU−, CIBN-CAAX, and Lifeact-mVenus. (F) Simulated kymograph of membrane states in response to the in silico recruitment of Opto-ACTU− (Cm), followed by global stimulation. Front or F-state is in green, back or Σ-state is in red. (G) Scheme for elevation of negative surface charge in context of excitable network-mediated ERK regulation, along with receptor input module. (H) Representative time-lapse images of MCF10A cell displaying ERKKTR translocation from cytosol to nucleus demonstrating ERK deactivation, upon Opto-ACTU− global recruitment to membrane (cells were co-expressing CIBN-CAAX as membrane anchor); cells were pre-treated with and maintained in a saturating dose of EGF throughout the experiment; time in hr:min:sec format (H). (I) Quantification of ERK deactivation in terms of ERKKTR nucleus/cytosol ratio; n=12 cells for each case (Opto-ACTU− and Opto-CTRL), mean ± SEM; 488 nm was turned on first at t=0 min (as shown by vertical dashed line). Source numerical data are available in source data.

References

    1. Saha S, Nagy TL & Weiner OD Joining forces: crosstalk between biochemical signalling and physical forces orchestrates cellular polarity and dynamics. Philos. Trans. R. Soc. Lond. B. Biol. Sci 373, 10.1098/rstb.2017.0145 (2018). - DOI - PMC - PubMed
    1. Manning BD & Toker A AKT/PKB Signaling: Navigating the Network. Cell 169, 381–405 (2017). - PMC - PubMed
    1. Devreotes PN et al. Excitable Signal Transduction Networks in Directed Cell Migration. Annu. Rev. Cell Dev. Biol 33, 103–125 (2017). - PMC - PubMed
    1. Hoxhaj G & Manning BD The PI3K-AKT network at the interface of oncogenic signalling and cancer metabolism. Nat. Rev. Cancer 20, 74–88 (2020). - PMC - PubMed
    1. Ridley AJ et al. Cell migration: integrating signals from front to back. Science 302, 1704–1709 (2003). - PubMed

Methods-only references:

    1. Kreppel L et al. dictyBase: a new Dictyostelium discoideum genome database. Nucleic Acids Res. 32, 332 (2004). - PMC - PubMed
    1. Fey P, Dodson RJ, Basu S & Chisholm RL One stop shop for everything Dictyostelium: dictyBase and the Dicty Stock Center in 2012. Methods Mol. Biol 983, 59–92 (2013). - PMC - PubMed
    1. Meshik X, O'Neill PR & Gautam N Optogenetic Control of Cell Migration. Methods Mol. Biol 1749, 313–324 (2018). - PubMed
    1. Kamimura Y, Tang M & Devreotes P Assays for chemotaxis and chemoattractant-stimulated TorC2 activation and PKB substrate phosphorylation in Dictyostelium. Methods Mol. Biol 571, 255–270 (2009). - PMC - PubMed
    1. Cai H, Huang CH, Devreotes PN & Iijima M Analysis of chemotaxis in Dictyostelium. Methods Mol. Biol 757, 451–468 (2012). - PMC - PubMed

Publication types

MeSH terms