. 2022 Oct;24(10):1528-1540.
doi: 10.1038/s41556-022-00996-8. Epub 2022 Oct 6.

The HASTER lncRNA promoter is a cis-acting transcriptional stabilizer of HNF1A

Affiliations

The HASTER lncRNA promoter is a cis-acting transcriptional stabilizer of HNF1A

Anthony Beucher et al. Nat Cell Biol. 2022 Oct.

Abstract

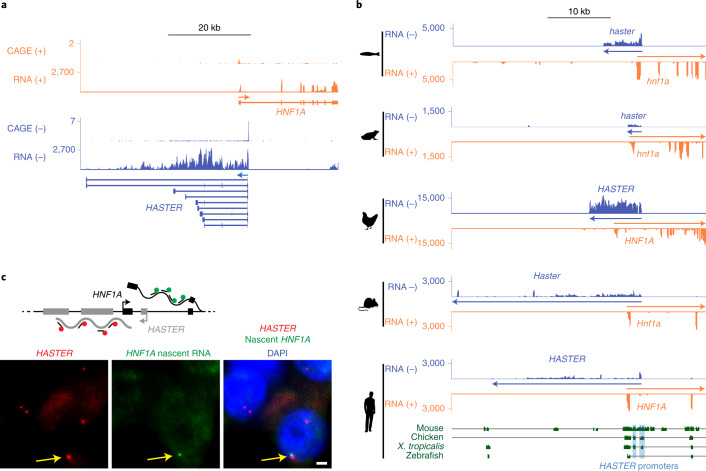
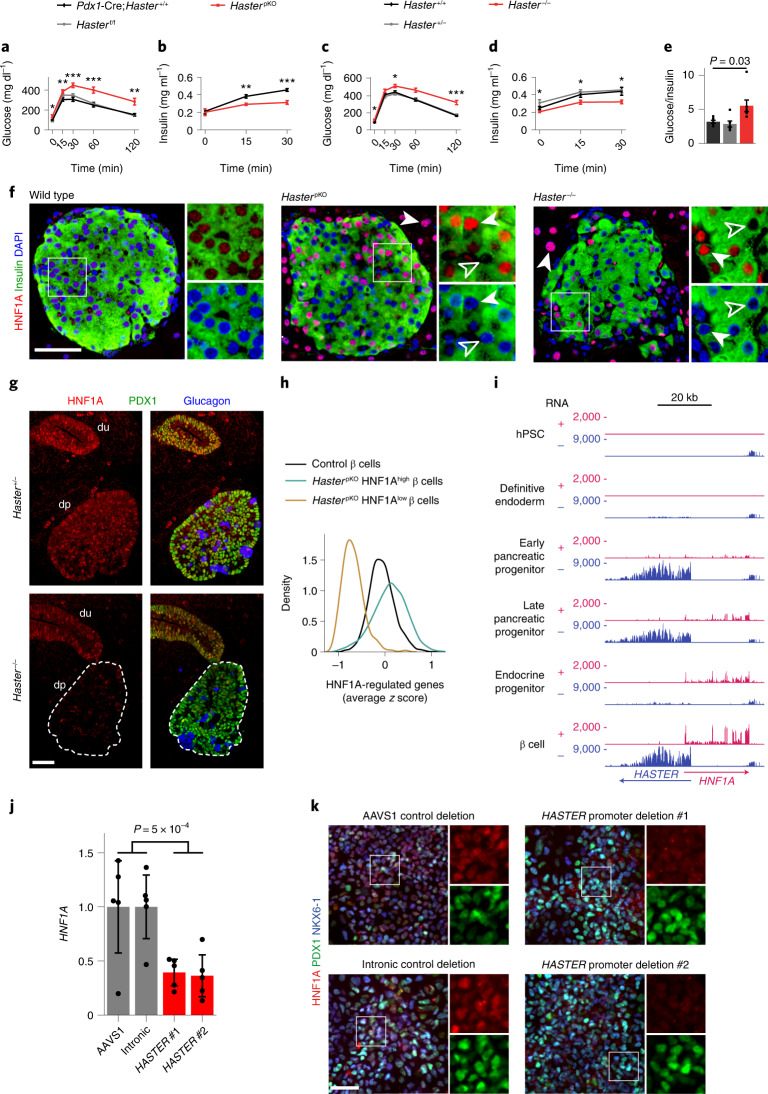
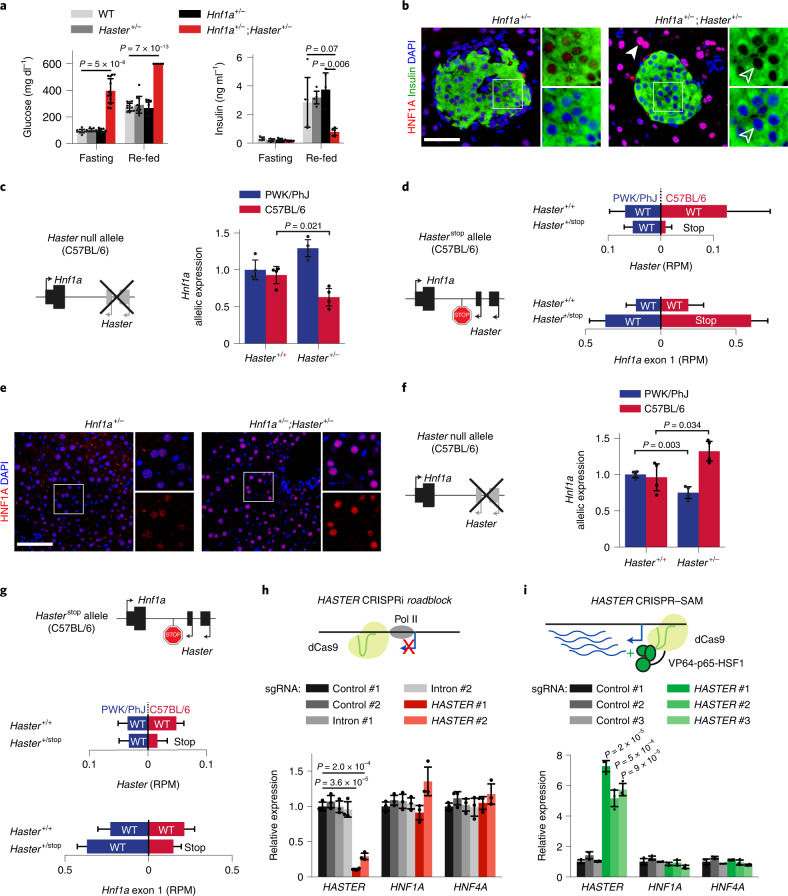
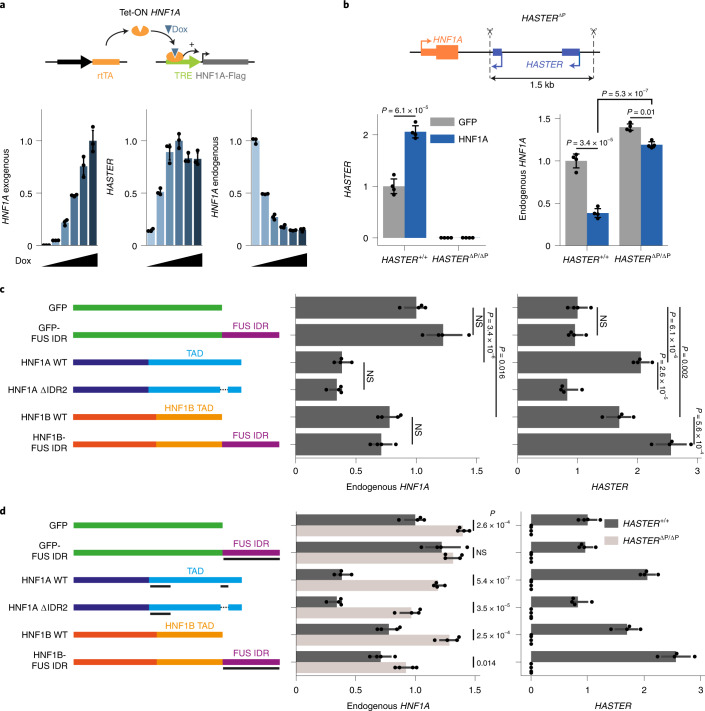
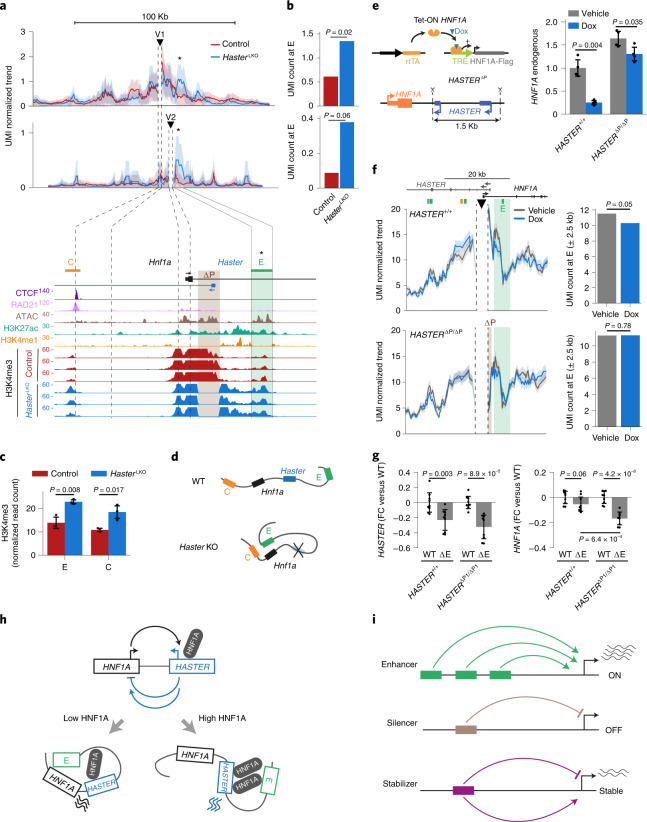
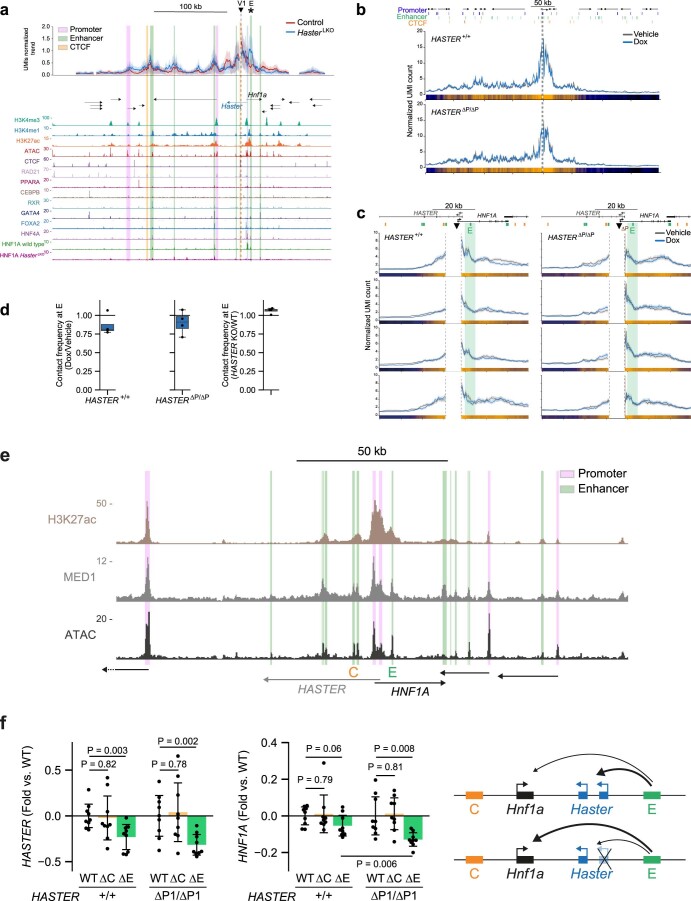
The biological purpose of long non-coding RNAs (lncRNAs) is poorly understood. Haploinsufficient mutations in HNF1A homeobox A (HNF1A), encoding a homeodomain transcription factor, cause diabetes mellitus. Here, we examine HASTER, the promoter of an lncRNA antisense to HNF1A. Using mouse and human models, we show that HASTER maintains cell-specific physiological HNF1A concentrations through positive and negative feedback loops. Pancreatic β cells from Haster mutant mice consequently showed variegated HNF1A silencing or overexpression, resulting in hyperglycaemia. HASTER-dependent negative feedback was essential to prevent HNF1A binding to inappropriate genomic regions. We demonstrate that the HASTER promoter DNA, rather than the lncRNA, modulates HNF1A promoter-enhancer interactions in cis and thereby regulates HNF1A transcription. Our studies expose a cis-regulatory element that is unlike classic enhancers or silencers, it stabilizes the transcription of its target gene and ensures the fidelity of a cell-specific transcription factor program. They also show that disruption of a mammalian lncRNA promoter can cause diabetes mellitus.


Conflict of interest statement

P.R. is a founder and consultant for EndoCells/UniverCell Biosolutions. All of the remaining authors declare no competing interests.

Figures

Fig. 1
Fig. 1. HASTER transcribes an evolutionarily conserved nuclear RNA.
a, Human islet RNA-seq (reads per kilobase per million reads, RPKM) and CAGE (normalized tag counts, TPM) showing overlapping and divergent transcription of HNF1A and HASTER (representative examples from four biological replicates). HASTER isoforms were detected by 3′ RACE from human islets. b, Liver strand-specific RNA-seq (RPKM) and Multiz alignments in the indicated species. c, Single-molecule fluorescence in situ hybridization for HASTER (exonic probes) and HNF1A nascent transcripts (intronic probes) in EndoC-βH3 β cells. The yellow arrows indicate co-localization of HASTER and nascent HNF1A transcripts. Quantifications are shown in Extended Data Fig. 2. Scale bar, 2 µm.
Fig. 2
Fig. 2. HASTER negative feedback regulates HNF1A in mice and humans.
a, Homozygous deletions of the HASTER promoter (two deletions with independent sgRNA pairs) or control deletions in HNF1A intron 1 or AAVS1 were generated in hESCs. b, HNF1A mRNA was increased in differentiated hepatocytes from HASTER mutant hESCs (n = 3 independent clones per deletion). The bar graphs show RPLP0-normalized expression values (means ± s.d.). Statistical significance was determined by two-tailed Student’s t-test. Act. A, Activin A; BMP-4, bone morphogenetic protein 4; HGF, hepatocyte growth factor; OSM, Oncostatin M. c, Schematic of the mouse Hasterf allele. d, Liver RNA levels in seven HasterLKO and eight control mice. The data represent Tbp-normalized values (means ± s.d.). Statistical significance was determined by two-tailed Student’s t-test. e, Liver HNF1A immunofluorescence in the indicated genotypes. Scale bar, 50 µm. f, Western blot for HNF1A on liver extracts (n = 3 mice for each genotype). The bars represent relative expression levels (means ± s.d.). Statistical significance was determined by two-tailed Student’s t-test. Ctrl, control. g,h, Haster was decreased in Hnf1a−/− islets (g; n = 4 Hnf1a−/− and n = 5 Hnf1a+/+ mice) and liver (h; n = 4 mice per genotype). The bars represent relative expression levels (means ± s.d.). Statistical significance was determined by two-sided Wald test with adjusted P values. i, EndoC-βH3 cells carrying an indel in HNF1A exon 1 showed decreased HASTER as well as HNF4A—another HNF1A-dependent gene (n = 3 lentiviral transductions). The data represent means ± s.d. and are normalized to TBP. Statistical significance was determined by two-tailed Student’s t-test. j, HNF1A binds the Haster promoter in mouse liver (representative example from three replicates, MACS2 P values). The locations of seven HNF1A motifs with a JASPAR CORE score of >0.8 are shown, along with the sequences of three motifs. See Extended Data Fig. 1 for information on transcriptional start sites. k, Schematic of the HNF1A/HASTER negative feedback loop. Source data
Fig. 3
Fig. 3. Haster controls HNF1A pioneer-like activity.
a, RNA-seq in HasterLKO liver. Differentially expressed genes (adjusted P ≤ 0.05) are highlighted in red and total numbers are indicated (n = 5 mice per genotype). FC, fold change. b, GSEA showing that genes up- or downregulated in Hnf1a KO liver have opposite expression patterns in HasterLKO liver. NES, normalized enrichment score. c, Enrichment of HasterLKO liver upregulated genes in different mouse tissues (Mouse Gene Atlas). The bars indicate Enrichr scores and the red dots show Fisher’s exact −log10-adjusted P values. d, HNF1A binding strength (log2[ChIP-seq normalized read count]) in HasterLKO and control liver (n = 3 mice). Red represents differentially bound sites (FDR ≤ 0.05) whereas blue represents a kernel density of HNF1A-bound sites with FDR > 0.05. The asterisk denotes the HasterLKO deletion. e, Left, HNF1A occupancy in control and HasterLKO liver. Right, chromatin accessibility for the same regions in liver and kidney. Neo-binding sites are bound by HNF1A only in HasterLKO. Increased bound sites include all of the other sites showing increased binding in HasterLKO. The heatmaps show the average signal of three replicates for ChIP-seq and two replicates for the assay for transposase-accessible chromatin with high-throughput sequencing (ATAC-seq). Windows were defined as peak centres ± 1 kb. P values were obtained with MACS2. f, Activation of a kidney-specific gene in HasterLKO liver. y axes represent MACS2 P values for ChIP-seq and RPKM for RNA-seq. g, H3K4me3 in HNF1A-bound regions in HasterLKO and control samples (average of three mice). h, Top HOMER de novo motifs for the different categories of HNF1A peak. i, Model showing that Haster KO leads to increased HNF1A (blue), causing increased HNF1A binding and expression of HNF1A-bound genes (bottom left), as well as HNF1A neo-binding sites that lead to transformation of silent inaccessible chromatin into active promoters (bottom right). Source data
Fig. 4
Fig. 4. Haster deletion causes islet cell HNF1A hyperactivation or silencing and diabetes.
a, Intraperitoneal glucose tolerance in 8-week-old male mice (n = 8 HasterpKO, n = 12 Pdx1-Cre;Haster+/+ and n = 8 Hasterf/f). P = 0.045, 8 × 10−3, 3 × 10−4, 4 × 10−4 and 5 × 10−3 at 0, 15, 30, 60 and 120 min, respectively. b, Plasma insulin of 8-week-old male mice (n = 7 HasterpKO and n = 6 Pdx1-Cre;Haster+/+). P = 0.83, 2 × 10−3 and 3 × 10−4 at 0, 15 and 30 min, respectively. c, Intraperitoneal glucose tolerance in 8-week-old male mice (n = 9 Haster−/−, n = 12 Haster+/− and n = 13 Haster+/+). P = 0.048, 0.075, 0.011, 4 × 10−4 and 2 × 10−4 at 0, 15, 30, 60 and 120 min, respectively. d, Plasma insulin in 8-week-old male mice (n = 7 Haster−/−, n = 6 Haster+/+ and n = 6 Haster+/−). P = 0.042, 0.045 and 0.026 at 0, 15 and 30 min, respectively. e, Glucose-to-insulin ratio in 8-week-old male mice (n = 9 Haster−/−, n = 12 Haster+/− and n = 13 Haster+/+). In ae, the data are presented as means ± s.e.m. and statistical significance was determined by two-tailed Student’s t-test (*P ≤ 0.05; **P ≤ 0.01; ***P ≤ 0.001). f, Immunofluorescence for HNF1A and insulin, showing either HNF1A overexpression (solid arrowheads) or no HNF1A expression (empty arrowheads) in endocrine cells of adult HasterpKO and Haster−/− mice. Note that all acinar cells from mutant mice overexpressed HNF1A (n = 3 Haster+/+, n = 3 HasterpKO and n = 2 Haster−/−). g, Immunofluorescence for HNF1A, PDX1 (a pancreatic and duodenal marker) and glucagon in Haster−/− and control E11.5 embryos, showing low heterogeneous HNF1A in pancreatic but not gut progenitors. dp, dorsal pancreas (delineated by dashed lines in KO); du, duodenum. h, Kernel density estimation of HNF1A-regulated gene expression (average z score) showing either down- or upregulation of HNF1A-dependent genes in HasterpKO HNF1Alow and HNF1Ahigh β cell clusters. i, RNA-seq (RPKM) from the indicated hESC-derived differentiation stages. j, HNF1A mRNA in hESC-derived pancreatic progenitors carrying HASTER P1 homozygous deletions (see Fig. 2a) (n = 5 independent differentiations). The data are presented as TBP-normalized relative expression (means ± s.d.). Statistical significance was determined by two-tailed Student’s t-test. k, Immunofluorescence for HNF1A, PDX1 and NKX6-1 in hESC-derived pancreatic progenitors carrying the indicated deletions, showing downregulation of HNF1A (n = 2 per deletion). In f, g and k, the scale bars represent 50 µm. Source data
Fig. 5
Fig. 5. The HASTER promoter is a positive and negative cis-acting element.
a, Severe fasting and fed hyperglycaemia (left; n = 12 wild-type (WT) mice, n = 10 Haster+/− mice, n = 11 Hnf1a+/− mice and n = 13 Hnf1a+/−;Haster+/− mice) and reduced insulin secretion (right; n = 5 mice per genotype) in Hnf1a+/−;Haster+/− compound heterozygotes. The data are presented as means ± s.d. Statistical significance was determined by two-tailed Student’s t-test. b, Immunofluorescence showing normal HNF1A in Hnf1a+/− islets and no expression in most islet cells from adult Hnf1a+/−;Haster+/− mice (n = 1 per genotype). Solid arrowhead: HNF1Ahigh acinar cell. Hollow arrowhead: HNF1Alow β cell. Scale bar, 50 µm. c, Allele-specific Hnf1a mRNA in islets from hybrid-strain mice carrying the Haster mutation in the C57BL/6 chromosome. Hnf1a was quantified by strain-specific qPCR and normalized to Tbp (n = 4 mice per genotype). The data are presented as means ± s.d. Statistical significance was determined by two-tailed Student‘s t-test, d, Strain-specific RNA-seq analysis from Haster+/stop and Haster+/+ PWK/PhJ;C57BL/6 hybrid islets (n = 4 mice per genotype). RPM, reads per million reads. e, HNF1A overexpression in liver from Hnf1a+/−;Haster+/− mice (n = 1 per genotype). Scale bar, 50 µm. f, Allele-specific Hnf1a mRNA in liver from Haster+/− hybrid-strain mice carrying the Haster mutation in the C57BL/6 chromosome. Hnf1a was quantified with strain-specific assays and normalized to Tbp (n = 4 mice per genotype). The data are presented as means ± s.d. Statistical significance was determined by two-tailed Student’s t-test. g, Strain-specific RNA expression from Haster+/stop C57BL/6;PWK/PhJ hybrid mice, showing that reducing Haster elongation in liver failed to increase Hnf1a expression from the same C57BL/6 allele. The graphs show reads per million (RPM) (means ± s.d.). h, Targeting dCAS9 to the HASTER transcriptional start site blocked HASTER transcription in EndoC-βH3 cells but did not affect HNF1A or HNF4A mRNAs (n = 3 lentiviral transductions). i, CRISPR–SAM HASTER activation in EndoC-βH3 cells did not affect HNF1A and HNF4A (n = 3 lentiviral transductions). In h and i, the data represent normalized expression levels (means ± s.d.) and statistical significance was determined by two-tailed Student’s t-test. Source data
Fig. 6
Fig. 6. HNF1A binding to HASTER mediates negative regulation of HNF1A.
a, Doxycycline (Dox)-induced HNF1A overexpression in EndoC-βH3 cells activated HASTER and blocked endogenous HNF1A (n = 3 independent experiments). b, HNF1A overexpression in clonal EndoC-βH3 cell lines with homozygous deletions of both HASTER promoters (n = 4 independent experiments). c, HNF1A transactivation of HASTER is separable from repression of its promoter. Wild-type HNF1A or HNF1A containing a deletion of an endogenous IDR, HNF1B or HNF1B fused to an unrelated IDR were expressed in EndoC-βH3 cells. Green fluorescent protein (GFP) and GFP fused to the unrelated IDR are shown as controls (n = 4 independent experiments). NS, not significant. d, Expression of HNF1A containing a deletion of an IDR and of HNF1B fused to an unrelated IDR in EndoC-βH3 cells, essentially as represented in b with the addition of experiments with HASTER promoter deletions to show that the effects are dependent on HASTER (n = 4 independent experiments). In ad, the data are presented as TBP-normalized relative expression (means ± s.d.) and statistical significance was determined by two-tailed Student‘s t-test. Source data
Fig. 7
Fig. 7. HASTER remodels enhancer–HNF1A interactions.
a, HasterLKO liver shows increased contacts between Hnf1a upstream viewpoints and the intronic E enhancer. UMI-4C contact trends with binomial standard deviation for the V1 and V2 viewpoints are shown (n = 6 for the wild type and n = 3 for mutant livers). Triangles denote viewpoints (DpnII fragment ± 1 kb) and asterisks mark E. The bottom panel shows liver H3K4me3. The brown shading shows the region deleted in HasterLKO. b, UMI normalized counts at E showed increased contacts with upstream regions (V1 and V2) in HasterLKO liver. Statistical significance was determined by 𝜒2 tests for n = 6 wild-type and mutant livers (V1) and n = 3 wild-type and mutant livers (V2). c, HasterLKO cells have increased H3K4me3 in C and E (n = 3 biological replicates). The data are presented as means ± s.d. Statistical significance was determined by two-tailed t-test. d, Schematic depicting increased Hnf1a promoter–E interactions in HasterLKO liver. e,f, Doxycycline-induced HNF1A overexpression in HASTER-deleted EndoC-βH3 cells (n = 4) showing (e) normalized HNF1A mRNA levels and (f) HNF1A promoter viewpoint (triangle) UMI-4C contacts. The green shading shows a 5-kb region centred on E that was used to quantify HNF1A promoter interactions. Normalized UMI counts and 𝜒2 test P values calculated with umi4c are shown on the right. g, E deletions prevent HNF1A increases in HASTER-deleted cells. HASTER+/+ or HASTERΔP1/ΔP1 clones were used to create polyclonal cells containing a mix of homozygous and heterozygous E deletions (ΔE) or wild-type sgGFP controls (WT). HASTER and HNF1A RNAs are shown as the fold change relative to parental HASTER+/+ or HASTERΔP1/ΔP1 cells. ΔE significantly reduced HASTER but not HNF1A in HASTER+/+ cells, yet it reduced HNF1A in HASTERΔP1/ΔP1 cells. Identical results were observed with a different clone, whereas C mutations had no effect (Extended Data Fig. 10f) (pool of n = 3 independent experiments with three pairs of sgRNAs for each deletion). In e and g, the data are presented as TBP-normalized relative expression (means ± s.d.) and statistical significance was determined by two-tailed t-test. h, HASTER exerts negative and positive feedbacks. At low HNF1A concentrations, HNF1A promoter–E interactions and transcription are unhindered, whereas at high HNF1A concentrations, HNF1A binding to HASTER limits HNF1A–E contacts, thereby decreasing HNF1A transcription. HASTER also acts as an essential enhancer in pancreatic lineages. i, HASTER is distinct from classic enhancers or silencers and is instead a cis-acting stabilizer that prevents overexpression and silencing. Source data
Extended Data Fig. 1
Extended Data Fig. 1. HASTER and HNF1A regulatory landscapes.
a, Chromatin and RNA maps in mouse (top) and human islets (bottom). Human CAGE is from islets, and mouse CAGE is from pancreas. The two mouse Haster transcriptional start sites are highlighted in blue, although only one transcriptional origin is apparent in human islets. The E islet enhancer, and CTCF-bound C region, both of which are bound by islet transcription factors, are highlighted in beige. b, HNF1A and HASTER expression across GTEx human tissues (Data Source: GTEx Analysis Release V8) and human islets (n = 130). Boxes show median and interquartile ranges. c, HASTER and HNF1A median transcript levels across tissues are negatively correlated, with the exception of whole pancreas. Source data
Extended Data Fig. 2
Extended Data Fig. 2. HASTER transcripts localize to the nucleus.
a, Relative subcellular expression of HASTER lncRNA in EndoC-βH3 cells, compared to control mRNAs (TBP and HNF1A) and the nuclear lncRNA MALAT1. Mean ± s.d., n = 3 biological replicates. b, Single molecule fluorescence in situ hybridization signals for HASTER. HASTER transcripts are almost exclusively observed in the nucleus (deconvoluted images). The inset shows a rare non-nuclear signal. (n = 5 independent experiments). c, Colocalization of single molecule fluorescent in situ hybridization signals for HASTER (exonic probes) and HNF1A (intronic probes for HNF1A) in human EndoC-βH3 cells. n = 496 cells. The degree to which HASTER and intronic HNF1A RNA molecules are located at the HNF1A locus can only be assessed when two HNF1A or two HASTER molecules are seen in the same nucleus. In all such instances HNF1A and HASTER were found to colocalize. Scale bar, 20 µm. Source data
Extended Data Fig. 3
Extended Data Fig. 3. Conditional Haster allele and phenotypic analysis in liver.
a, Schematic of the targeted allele, digestion fragments and probes used for Southern blot analysis of different alleles. b, Southern blot with KpnI (left) and NdeI (right) digestion. Asterisk, Clone 5 was selected to establish the line. n = 1 Southern blot. K, KpnI; N, NdeI; ES, parental embryonic stem cell (C57BL/6). c, Intraperitoneal glucose tolerance test in HasterLKO and control 8-week-old mice. Mean ± s.e.m. d, Body weight at 8 weeks for HasterLKO and controls. Mean ± s.d. c,d, n = 9 HasterLKO, n = 6 Alb-Cre;Haster+/+ and n = 7 Hasterf/f, two-tailed Student’s t-test. e, Immunofluorescence showing HNF1A overexpression in Haster-/- liver. n = 1 per genotype. Scale bar, 100 µM. f, GSEA displaying the enrichment of functional annotations in HasterLKO upregulated (top panel) and downregulated (bottom panel) genes. Source data
Extended Data Fig. 4
Extended Data Fig. 4. HASTER is sensitive to decreased or increased HNF1A expression.
a, Locked nucleic acid (LNA) GapmeR knockdown of HNF1A (#1, HNF1A exon 8; #2, HNF1A exon 1) in human EndoC-βH3 β cells led to decreased HASTER RNA, and minor changes in other HNF1A-dependent genes. n = 3 nucleofections, TBP-normalized mean ± s.d.; two-tailed Student’s t-test. b, CRISPR-SAM activation of Hnf1a in mouse MIN6 β cells. n = 3 lentiviral transductions, representative of 2 independent experiments. Tbp-normalized mean ± s.d.; two-tailed Student’s t-test. Source data
Extended Data Fig. 5
Extended Data Fig. 5. Hnf1a upregulation perturbs HNF1A binding selectivity.
a, Tissue specificity of gene expression across HNF1A-expressing tissues for genes upregulated in HasterLKO liver. To quantify tissue specificity, for each gene and tissue we calculated a Z-score that represents the deviation of expression in that tissue relative to the average from all tissues. n = 3 kidney samples, n = 5 liver and small intestine samples and n = 6 pancreatic islet samples. Box plots show medians and interquartile ranges; whiskers, 1.5 times the interquartile ranges. Two-sided Wilcoxon rank-sum P-values. b, Liver H3K4me3 and H3K27ac in HasterLKO and control liver (log2 normalized ChIP-seq read count; n = 3 mice per genotype). Red, differential H3K4me3 or H3K27ac sites (FDR ≤ 0.05); blue, kernel density of differential H3K4me3 or H3K27ac sites with FDR > 0.05. c, H3K27ac at HNF1A-bound regions in HasterLKO and controls (average of n = 3 mice per genotype). d, RNA fold change in HasterLKO vs. control liver of HNF1A-bound promoters for the different categories of HNF1A binding in HasterLKO liver. n = 5 mice per genotype for RNA and n = 3 mice per genotype for HNF1A ChIP. Box plots show medians and interquartile ranges; whiskers, 1.5 times the interquartile ranges. e, Examples of HNF1A neo-binding sites that lead to ectopic promoter and gene activation in HasterLKO liver. f, Ectopic activation of an intragenic promoter in HasterLKO liver (n = 2 mice per genotype). y axes in e and f represent MACS2 P values for ChIP-seq and RPKM for RNA-seq. g, Activated genomic regions that are bound by HNF1A and become active promoters in HasterLKO, but are inactive in control liver, overlap less frequently with annotated promoter and FANTOM5 CAGE transcriptional start sites, compared with unchanged HNF1A-bound active promoters in control liver, suggesting that some may be aberrant promoters rather that repurposed from other cell types. Two-sided Fisher’s exact test odd ratio (OR) and P-values, n = 3 mice per genotype. Source data
Extended Data Fig. 6
Extended Data Fig. 6. Characterization of Haster mutants.
a, Body weight of males at 8 weeks of age. HasterpKO (n = 8), Pdx1-Cre;Haster+/+ (n = 12) and Hasterf/f (n = 8). Mean ± s.d. b, Intraperitoneal glucose tolerance test in 8-week-old and 30-week-old female HasterpKO (n = 9), Pdx1-Cre;Haster+/+ (n = 10) and Hasterf/f (n = 10). Mean ± s.e.m., *P ≤ 0.05, **P ≤ 0.01 and ***P ≤ 0.001 (two-tailed Student’s t-test). c, Body weight of 8- to 10-week-old male Haster-/- (n = 9), Haster+/- (n = 12) and Haster-/- (n = 13). Mean ± s.d. d, Intraperitoneal glucose tolerance test in 8- to 10-week-old females Haster-/- (n = 10), Haster+/- (n = 10) and Haster+/+ (n = 12). Mean ± s.e.m., *P ≤ 0.05, **P ≤ 0.01 and ***P ≤ 0.001 (two-tailed Student’s t-test). e, Relative quantification of HNF1A-negative β cells at the indicated age and genotype. Results show that HNF1A silencing correlates with time of Haster knockout, with higher silencing frequency after early deletion (Haster germline KO and HasterpKO models). HNF1A silencing increased with time in β cells from germline KO and HasterpKO models, but not when excision occurred in early β cells (βKO). No HNF1A silenced β cells were observed after Pdx1-CreERTM-based tamoxifen-inducible excision in adult β cells (HasteriβKO model). Mean ± s.d from 2-4 sections per mouse, 2-4 mice per condition. f-h, Immunofluorescence for HNF1A and insulin in E15.5 (f) Haster+/+, (g) HasterpKO, and (h) Haster-/- pancreas. Solid arrowheads, insulin cells overexpressing HNF1A; hollow arrowheads, insulin cells lacking HNF1A. i-k, Immunofluorescence for HNF1A and insulin in adult (i) wild-type, (j) HasterβKO and (k) HasteriβKO pancreas. Arrows point to HNF1A-negative β cells. Most β cells from HasterβKO and HasteriβKO islets overexpress HNF1A. e-k, n = 2 wild type embryos and n = 3 adult wild type mice; n = 2 Haster-/- embryos and adult mice; n = 3 HasterpKO embryos and adult mice; n = 2 HasterβKO 6- and 32-week-old mice; n = 2 HasteriβKO mice. n.a.: not analyzed because deletions were performed at a later time point. Scale bar, 50 µM. Source data
Extended Data Fig. 7
Extended Data Fig. 7. Single-cell RNA-seq of HasterpKO islets.
a, Clusters of islet cells from female HasterpKO (4961 cells from triplicates for Seurat; 4456 for scVI) and controls (4646 cells from triplicates for Seurat; 4460 for scVI) determined by Seurat (t-SNE projection) or scVI (UMAP projection). b, scVI UMAP and Seurat t-SNE projections showing hormone expression. c, Cell type assignment based on marker gene expression. d, Haster and Hnf1a mRNA (log normalized UMI count) in different cellular populations of control and HasterpKO islets (Seurat). e, HNF1A-regulated gene expression (average Z-score) showing lower expression of HNF1A-regulated genes in the HASTERpKO-enriched β cell cluster (HNF1Alow) and high expression of HNF1A-regulated genes in other β cells in HASTERpKO cells. f, Relative proportions of β cells present in the HASTERpKO-enriched HNF1Alow β cell cluster. n = 3 mice per genotype. Mean ± s.d., two-tailed Student’s t-test. We note these proportions are lower than observed in situ, plausibly because Hnf1a-/- islets have a marked propensity to dissociate upon collagenase digestion, which is expected to cause negative selection of HNF1A-deficient cells after digestion and FACS sorting of single cells. g, HNF1A-regulated gene expression (average Z-score) for different cell types in individual samples (Seurat). h, Histograms showing the distribution of HNF1A-regulated gene expression (average Z-score) for β, α and δ cells (Seurat). Bins = 40. The variance of HNF1A-regulated gene expression increased in HasterpKO β, α and δ cells, showing that HNF1A-regulated genes are either upregulated or downregulated in islet cells. Levene test P-values. Source data
Extended Data Fig. 8
Extended Data Fig. 8. Differential gene expression in HasterpKO β cells.
a, Genes differentially expressed in the major β-cell cluster of HasterpKO islets. Many of the most upregulated genes in HasterpKO islets are downregulated in Hnf1a-/- islets (blue horizontal lines). b, Examples of two genes that are known to be downregulated in Hnf1a-/- islets, Cpb2 and Gc, and show increased expression in HasterpKO β cells. c, GSEA showing upregulation in HasterpKO β cells of genes downregulated in Hnf1a KO islets. d, Genes that are downregulated (combined P ≤ 0.05) in HasterpKO HNF1Alow cells are often downregulated in Hnf1a-/- islets (blue horizontal lines). e, Expression of selected genes that are known to be downregulated in Hnf1a KO islets and are downregulated in HasterpKO HNF1Alow cells. Dots are medians of samples (log normalized UMI count) and bars are means of 3 replicates. Two-sided Wilcoxon Rank Sum test, P-values for the different biological replicates combined with Fisher’s method. Source data
Extended Data Fig. 9
Extended Data Fig. 9. HASTER perturbations in β cells.
a,b, HASTER and HNF1A RNA in EndoC-βH3 cells with clonal homozygous deletion of (a) HASTER P1 promoter (HASTERΔP1/ΔP1) or (b) HASTER P1 and P2 promoters (HASTERΔP/ΔP). Deletion #1 and #2 were generated with independent pairs of sgRNAs, HASTER+/+ clones were transfected with sgRNAs targeting the AAVS1 locus. n = 4 clones per deletion. c, Two sets of LNA oligonucleotides (GapmeRs) were used to elicit HASTER degradation in EndoC-βH3 cells, without significant changes in HNF1A or HNF4A mRNA. n = 3 nucleofections. a-c, Expression normalized by TBP. Mean ± s.d., two-tailed Student’s t-test. d, Haster activation by CRISPR-SAM in MIN6 mouse β cells had no effect on Hnf1a expression. n = 3 lentiviral transductions. Expression normalized by Tbp. Mean ± s.d., two-tailed Student’s t-test relative to the control #1 sgRNA. Source data
Extended Data Fig. 10
Extended Data Fig. 10. HNF1A binding to HASTER promoter reduces HNF1A promoter – enhancer interactions.
a, Top, UMI-4C profile trends using a viewpoint region upstream of Hnf1a (V1), near a CTCF-bound C site, in adult liver from n = 3 wild type (blue) or mutant (red) mice. Bottom, chromatin features and transcription factor binding in adult mouse liver. The Hnf1a upstream region contacts several enhancers, promoters and CTCF/cohesin sites in control and HasterLKO liver. The interaction between Hnf1a upstream region and E (asterisk) is increased in HasterLKO liver (see also Fig. 7). The region deleted in HasterLKO mice is highlighted in blue. b, UMI-4C profile trends of doxycycline-induced HNF1A overexpression in HASTER+ / + and HASTERΔP/ΔP EndoC-βH3 cells with HNF1A promoter as viewpoint. Strongest contacts occurred within < 20 kb 3’ of HNF1A promoter, while weaker contacts were predominantly observed in a ~400 kb region 5’ of HNF1A promoter. Top tracks, genes and regulatory elements in human pancreatic islets (Miguel-Escalada, et al., 2019). Pool of libraries for n = 4 independent experiments. c, Individual UMI-4C profile trends from four individual experiments of doxycycline-induced HNF1A overexpression in HASTER+ / + and HASTERΔP/ΔP EndoC-βH3 cells. In a-c shades represent estimated binomial standard deviation centered on the profile trend. d, HNF1A promoter – E interaction frequencies from individual replicates (n = 4 independent experiments). Interaction frequencies were measured at a 5 kb region centered on E highlighted with a green shade. Box plots show medians and interquartile ranges; whiskers, 1.5 times the interquartile ranges. e, Human islet chromatin marks showing the position of enhancers in the vicinity of HNF1A. f, HASTER+ / + or HASTERΔP1/ΔP1 clone #1 cells carrying targeted deletions in C (ΔC), E (ΔE) or sgGFP as control (WT). HASTER+ / + control and E deletion are identical to Fig. 7e. ΔC and ΔE were polyclonal deletions. Results are expressed as fold-differences relative to the parental HASTER+ / + or HASTERΔP1/ΔP1 cells. This showed that ΔC has no effect on HASTER or HNF1A, ΔE had significant effects on HASTER but did not significantly affect HNF1A in wild type cells, yet showed a significant HNF1A reduction in HASTERΔP1/ΔP1 cells. This is shown in cartoon form in the right panel, whereby E predominantly enhances HASTER transcription, but enhances HNF1A in the absence of HASTER. Pool of n = 3 independent experiments with 3 pairs of sgRNAs for each deletion. TBP-normalized mean expression ± s.d.; two-tailed Student’s t-test. Source data

References

    1. Hon C-C, et al. An atlas of human long non-coding RNAs with accurate 5′ ends. Nature. 2017;543:199–204. - PMC - PubMed
    1. Iyer MK, et al. The landscape of long noncoding RNAs in the human transcriptome. Nat. Genet. 2015;47:199–208. - PMC - PubMed
    1. Gil N, Ulitsky I. Regulation of gene expression by cis-acting long non-coding RNAs. Nat. Rev. Genet. 2020;21:102–117. - PubMed
    1. Rinn JL, Chang HY. Genome regulation by long noncoding RNAs. Annu. Rev. Biochem. 2012;81:145–166. - PMC - PubMed
    1. Cabili MN, et al. Integrative annotation of human large intergenic noncoding RNAs reveals global properties and specific subclasses. Genes Dev. 2011;25:1915–1927. - PMC - PubMed

Publication types

Substances