. 2022 Oct;29(10):990-999.
doi: 10.1038/s41594-022-00838-z. Epub 2022 Oct 6.

A PKA inhibitor motif within SMOOTHENED controls Hedgehog signal transduction

Affiliations

A PKA inhibitor motif within SMOOTHENED controls Hedgehog signal transduction

John T Happ et al. Nat Struct Mol Biol. 2022 Oct.

Abstract

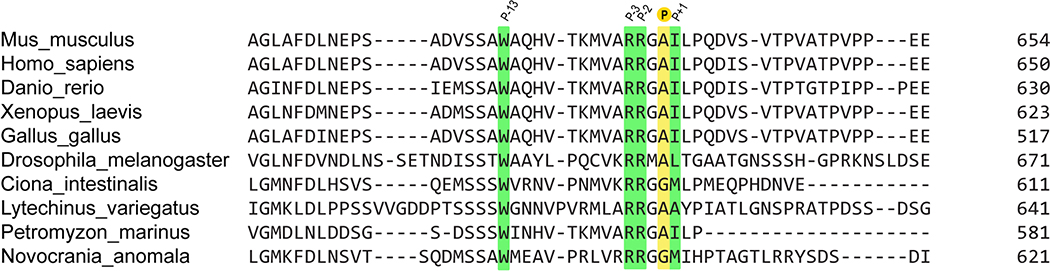
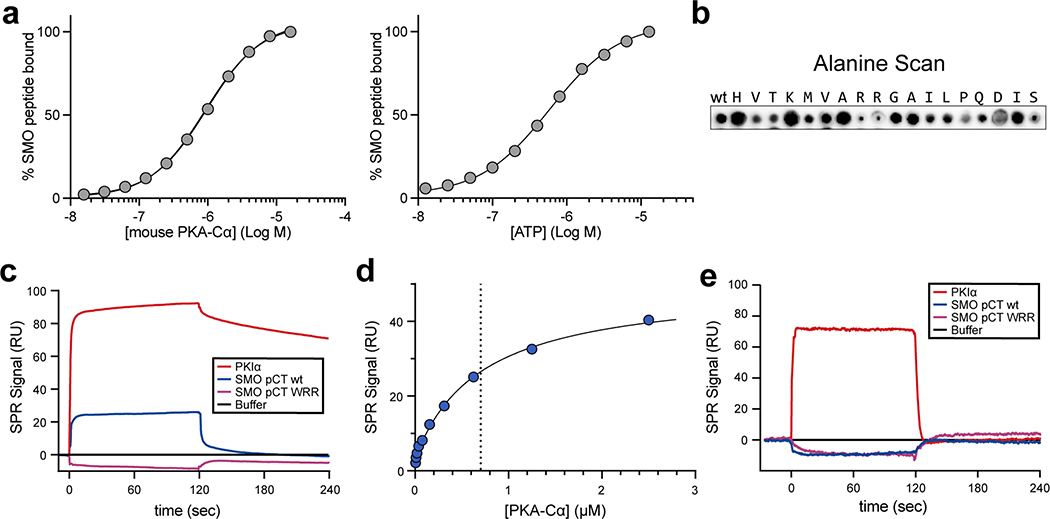
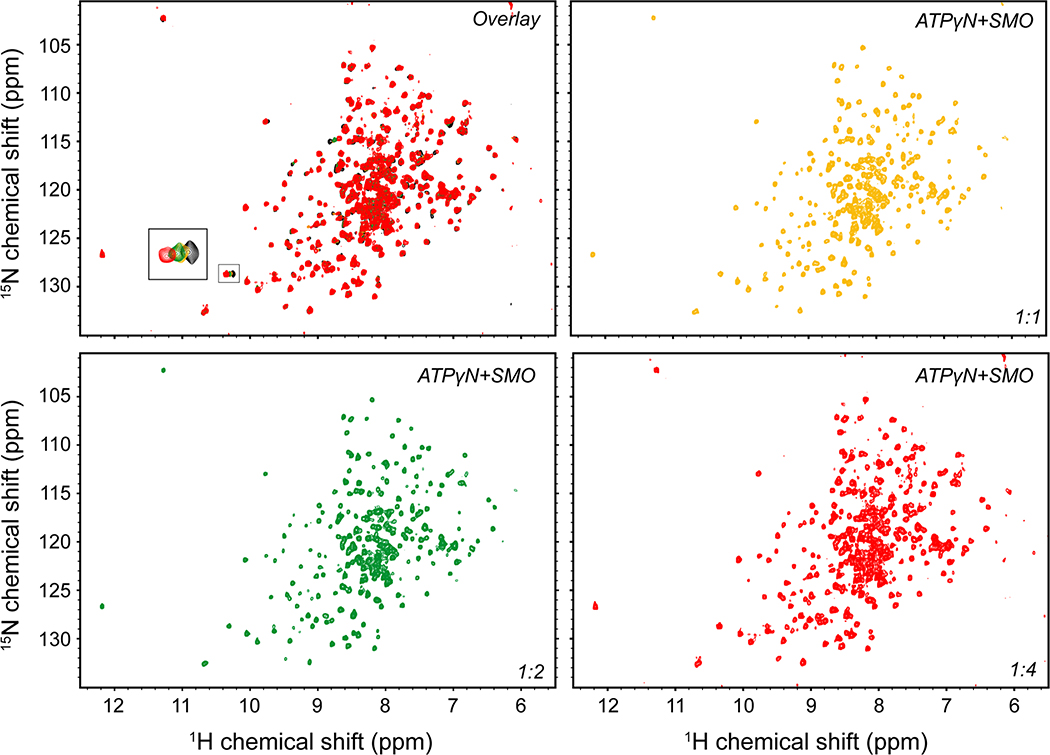
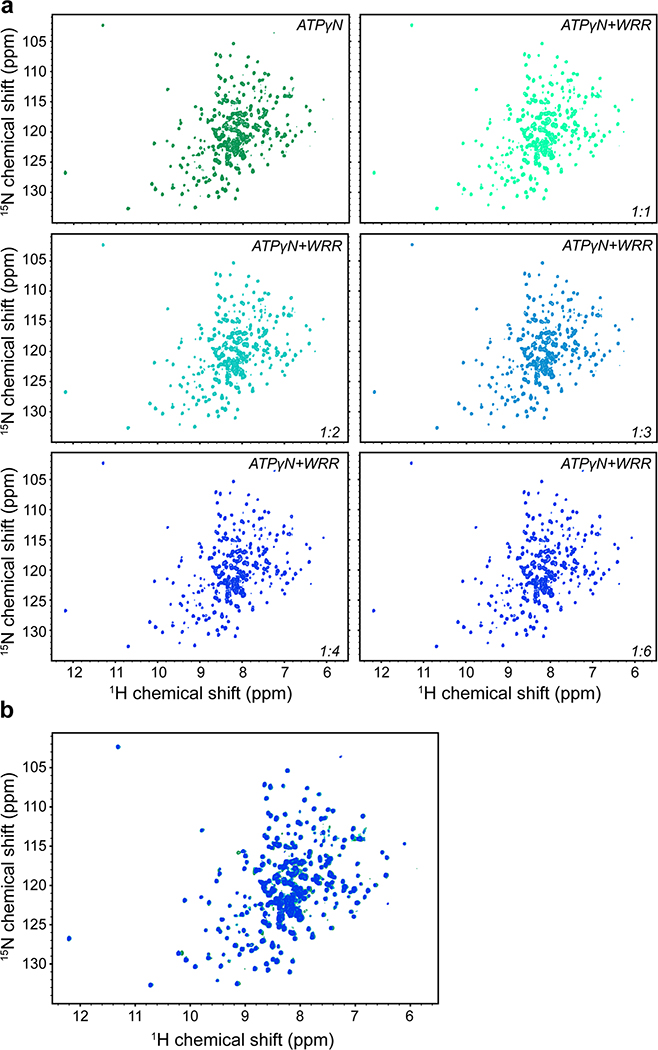
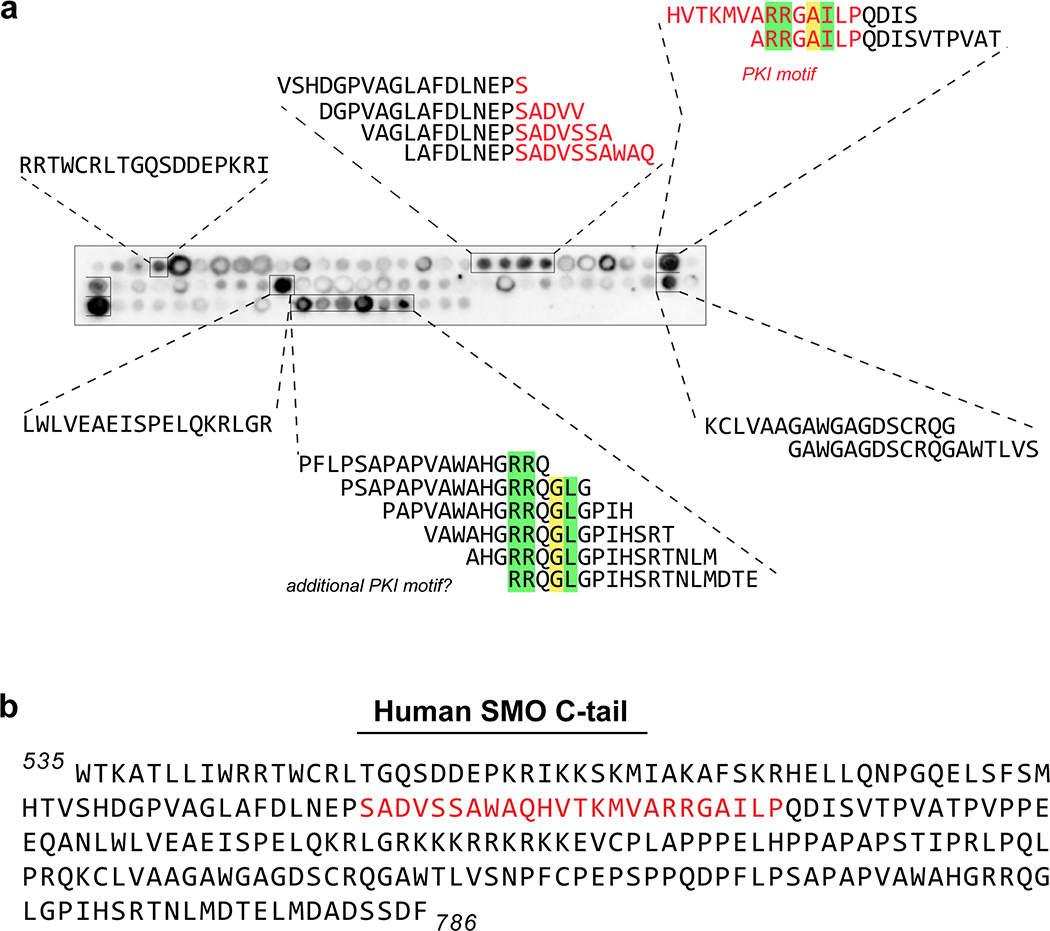
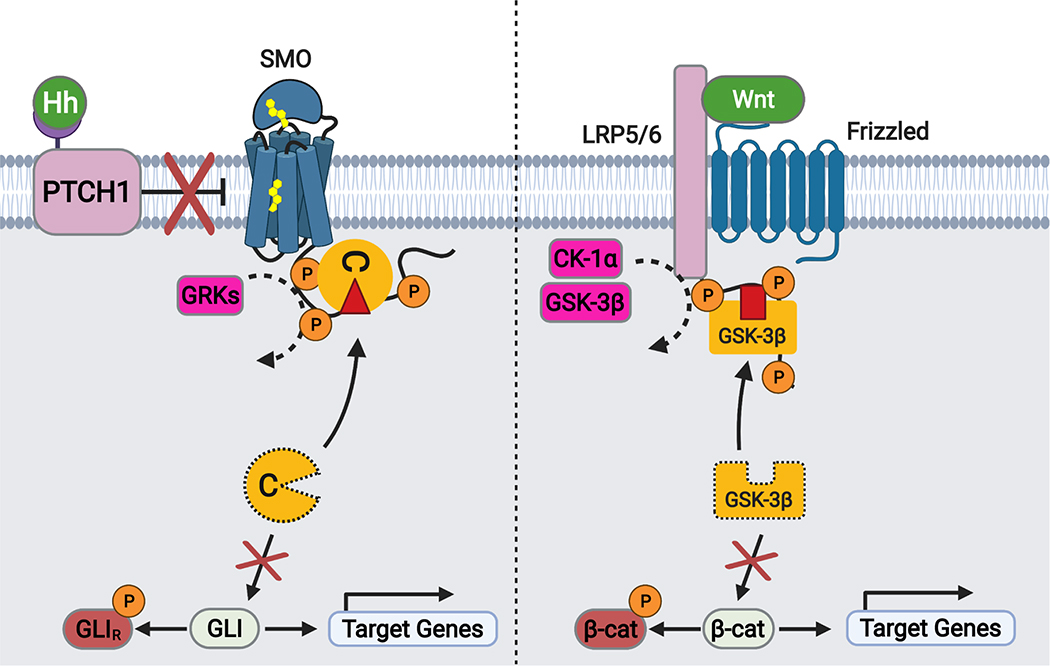
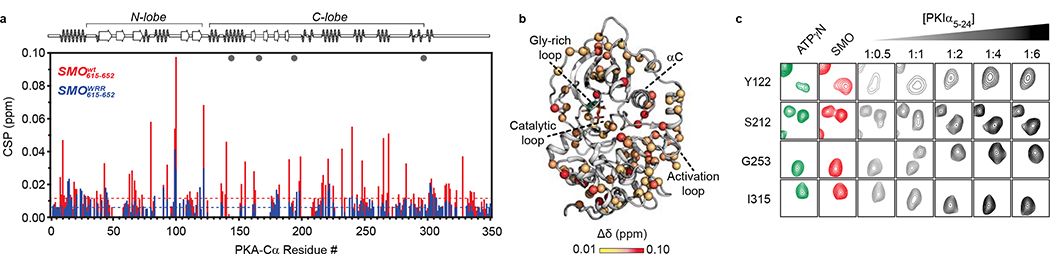
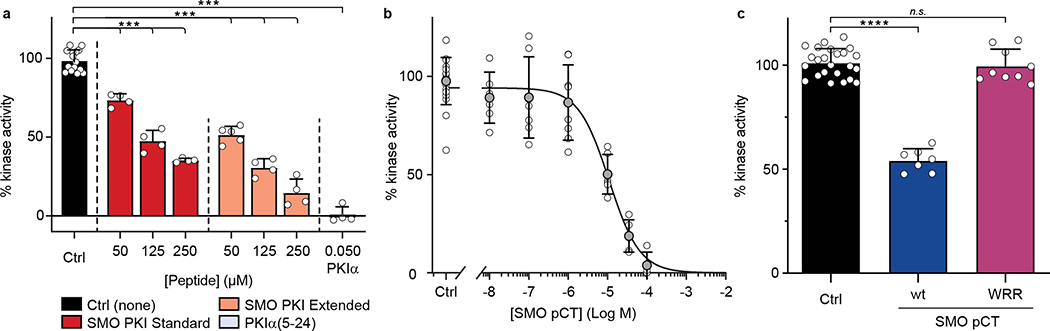
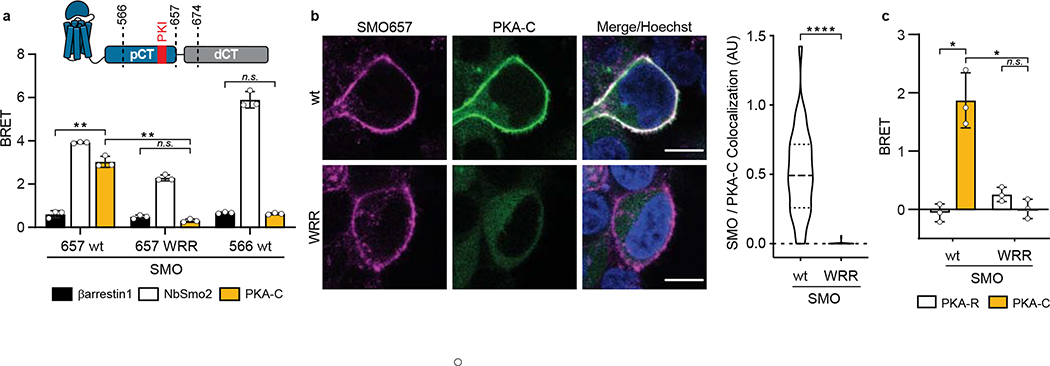
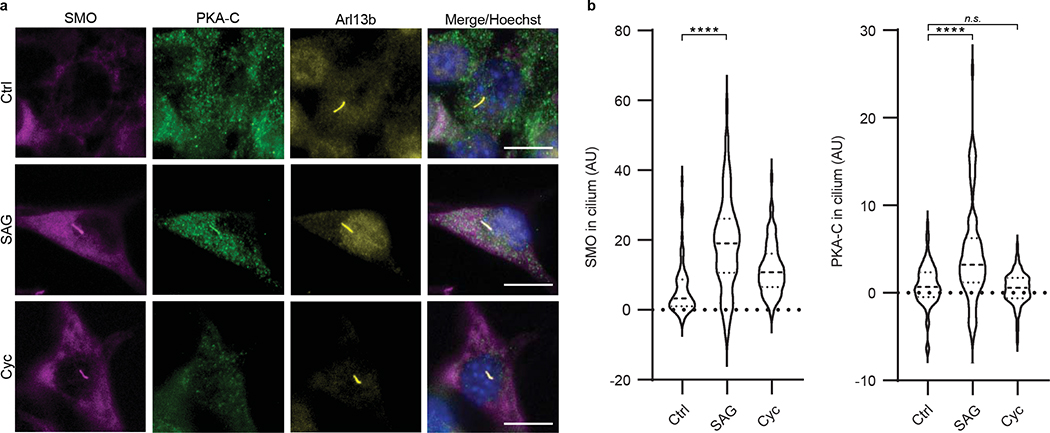
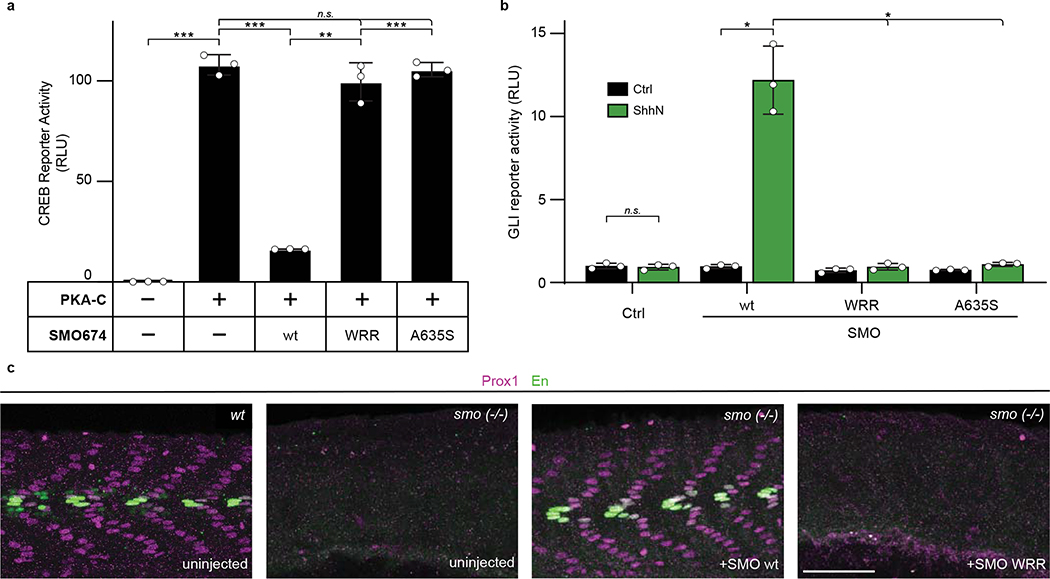
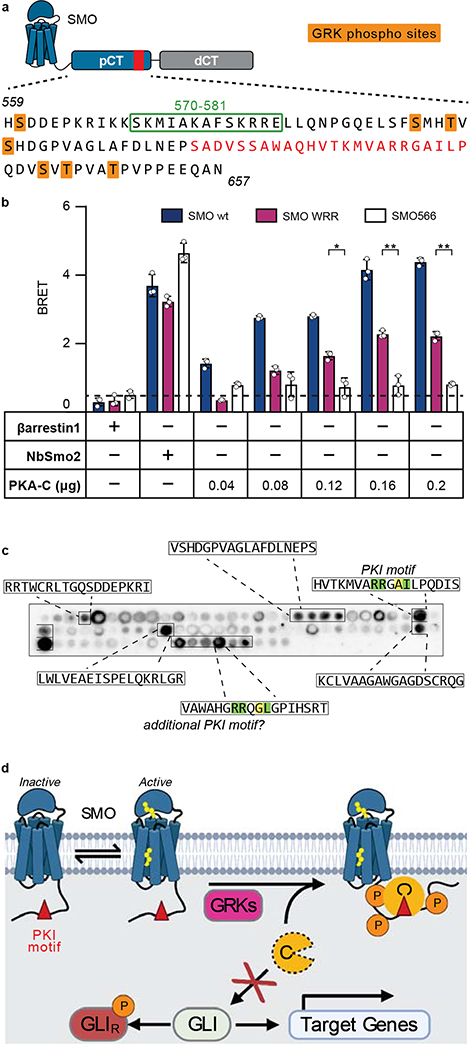
The Hedgehog (Hh) cascade is central to development, tissue homeostasis and cancer. A pivotal step in Hh signal transduction is the activation of glioma-associated (GLI) transcription factors by the atypical G protein-coupled receptor (GPCR) SMOOTHENED (SMO). How SMO activates GLI remains unclear. Here we show that SMO uses a decoy substrate sequence to physically block the active site of the cAMP-dependent protein kinase (PKA) catalytic subunit (PKA-C) and extinguish its enzymatic activity. As a result, GLI is released from phosphorylation-induced inhibition. Using a combination of in vitro, cellular and organismal models, we demonstrate that interfering with SMO-PKA pseudosubstrate interactions prevents Hh signal transduction. The mechanism uncovered echoes one used by the Wnt cascade, revealing an unexpected similarity in how these two essential developmental and cancer pathways signal intracellularly. More broadly, our findings define a mode of GPCR-PKA communication that may be harnessed by a range of membrane receptors and kinases.


Conflict of interest statement

COMPETING FINANCIAL INTERESTS:

The authors declare no competing financial interests.

Figures

Extended Data Fig. 1
Extended Data Fig. 1. Sequence alignment of SMO PKI motif.
Extended alignment of a portion of the pCT from the indicated SMO orthologs, with key PKI motif residues colored as in Fig. 1a.
Extended Data Fig. 2
Extended Data Fig. 2. Additional binding and peptide array studies, SPR sensorgrams, and SMO pCT purification strategy
a, Fluorescence polarization assays using mouse PKA-Cɑ, performed as in Fig. 1b. Triplicate points from representative experiments are shown. b, Peptide array, performed as in Fig. 1c, but with individual residues in the human SMO PKI motif mutated to alanine. c, SPR sensorgram for 625 nM PKA-Cɑ binding to GST-tagged wild-type (blue) or WRR mutant (purple) SMO pCT, or a PKIɑ positive control (red), in the presence of ATP and MgCl2. d, Exemplary steady-state analysis of binding interactions between human PKA-Cɑ and a recombinant wild-type SMO pCT, with a KD of 703 +/− 0.003 nM (dotted line) as assessed by SPR. This measurement was made three times, resulting in a mean KD value of 752 +/− 34 nM. e, SPR sensorgram, performed as in c, but with ATP and MgCl2 omitted from the buffer. PKA-Cɑ was present at 2.5 μM. Note that although removal of ATP and MgCl2 does not completely eliminate steady-state binding to the PKIɑ positive control, it dramatically accelerates the dissociation rate, as expected.
Extended Data Fig. 3
Extended Data Fig. 3. Raw NMR spectra for wild-type SMO peptide binding to PKA-Cα at varying kinase:peptide ratios
2D NMR spectra from an experiment in which SMO peptide was titrated into ATPγN-bound PKA-Cα at the indicated kinase:peptide ratios. Upper left panel represents an overlay of all three spectra to highlight the concentration dependence of the SMO peptide-induced changes observed in each spectrum. Black spectrum represents ATPγN-bound PKA-Cα without SMO peptide (see also Extended Data Fig. 4, 5). In the overlay plot, a box denotes one example of a peak (likely corresponding to an unassigned tryptophan residue) that changes linearly according to SMO peptide concentration (magnified in the inset at left).
Extended Data Fig. 4
Extended Data Fig. 4. Raw NMR spectra for WRR mutant peptide binding to PKA-Cα, as shown in Fig 2a.
a, The WRR mutant SMO peptide was titrated into ATPγN-bound PKA-Cα at the indicated kinase:peptide ratios. ATPγN-bound PKA-Cα without peptide (dark green spectrum, upper left) is shown for reference. See Extended Data Fig. 5 for raw NMR spectrum corresponding to PKA-Cα:wild-type SMO peptide at 1:6 ratio. b, Overlay of the spectra in a.
Extended Data Fig. 5
Extended Data Fig. 5. Raw NMR spectra for wild-type SMO peptide binding to PKA-Cα, as shown in Fig. 2a, and PKIα(5–24)-induced displacement of SMO peptide from PKA-Cα, as shown in Fig. 2c.
a, 2D NMR spectra for ATPγN-bound PKA-Cα, either alone (left) or with SMO peptide added at a 1:6 kinase:peptide ratio (right). b, 2D NMR spectra for titration of PKIα(5–24) peptide into the SMO peptide:ATPγN:PKA-Cα complex at the indicated kinase: PKIα(5–24) ratios. Upper left panel represents an overlay of the individual spectra to highlight the concentration dependence of the PKIα(5–24) peptide-induced effects.
Extended Data Fig. 6
Extended Data Fig. 6. Coimmunoprecipitation studies and ciliary colocalization studies to assess SMO / PKA-C interactions
a, Coimmunoprecipitation of PKA-Cɑ-YFP with the indicated FLAG-tagged wild-type or mutant SMO constructs was assessed using FLAG chromatography from lysates of transfected HEK293 cells. Data shown are representative of two independent experiments. b, Left, Colocalization of FLAG-tagged wild-type or mutant SMO674 (magenta) with mNeonGreen-tagged PKA-Cɑ (green) in ciliated IMCD3 cells stably expressing both constructs and treated with the SMO agonist SAG21k. Cilia are marked by the SMO (FLAG-647) stain. mNeonGreen-tagged Nbβ2AR80 (which does not bind SMO) serves as a negative control. 3D reconstructions from Z-stacks of confocal live-cell images are shown. Right, quantification of microscopy studies with the median represented by a dashed line and the upper and lower quartiles indicated by dotted lines (n=142–244 cilia per condition). P < 0.0001 (****). See Supplementary Table 1 for full statistical analysis.
Extended Data Fig. 7
Extended Data Fig. 7. Characterization of NIH3T3 cell line expressing epitope-tagged SMO.
The NIH3T3 cell line used in Fig. 5 exhibited trace amounts of SMO in cilia under vehicle (“Ctrl”) -treated conditions, and a dramatic accumulation of SMO in cilia under SAG-treated conditions. SMO (magenta) is visualized using an anti-V5 antibody, and cilia are visualized using an anti-Arl13b antibody (green). Scale bar = 10 μm. Data shown are representative of two independent experiments.
Extended Data Fig. 8
Extended Data Fig. 8. Controls for SMO / PKA-C binding, colocalization, and signaling studies.
a, Expression levels of SMO constructs in Fig. 3a, assessed by whole-cell nanoluc measurements. Data represent the mean +/− standard deviation, n = three biologically independent samples. n.s. = not significant. b, Surface levels of N-terminally FLAG-tagged wild-type or mutant SMO674 constructs were quantified via expression in HEK293 cells followed by FLAG staining and flow cytometry. Mock-infected cells stained with FLAG antibody (red) serve as a negative control. A representative histogram is shown. The % of FLAG-positive cells (i.e., those to the right of the vertical dashed line) are: 0.3 +/− 0.3% (Ctrl); 95.9 +/− 0.9% (wt), 96.0 +/− 2.5% (WRR); 93.4 +/− 4.2% (A635S); values represent the mean +/− standard deviation from two biologically independent samples. See Supplementary Table 1 for full statistical analysis, and Supplementary Figure 2 for gating strategy.. c, Ciliary localization in IMCD3 cells of myc-tagged wild-type or mutant SMO proteins (magenta). Cilia were visualized with Arl13b antibody (green). Scale bar = 5 μm. Data shown are representative of two independent experiments. d, GRK2/3-dependent phosphorylation of FLAG-tagged wild-type or mutant SMO674 constructs was determined via expression in HEK293 cells treated with or without the GRK2/3 inhibitor cmpd101, followed by FLAG purification. Levels of total and phosphorylated SMO were assessed by Stain Free imaging and ProQ Diamond fluorescence, respectively. SMO566, which is not phosphorylated by GRK2/3 (as it does not contain the C-tail and therefore lacks all previously mapped physiological GRK2/3 phosphorylation sites), serves as a negative control. Data shown are representative of two independent experiments.
Extended Data Fig. 9
Extended Data Fig. 9. Complete data set from SMO C-tail peptide array studies
a, The same SMO tiled peptide array from Fig. 7c, but including the sequences of all positive hits in each array cluster. b, Complete human SMO C-tail sequence used to create the peptide array. In a,b, the SMO PKI motif identified in the pCT is indicated in red. Key residues in this PKI motif, along with ones in the candidate PKI motif in the dCT, are colored as in Fig. 1a.
Extended Data Fig. 10
Extended Data Fig. 10. Similarity between signal transduction mechanisms in the Hh and Wnt pathways.
Schematic diagram of transmembrane signal transduction in the Hh (left) and Wnt (right) pathways. During Hh signal transduction, active SMO is phosphorylated on its cytoplasmic tail by GRK2/3, triggering membrane sequestration and inhibition of PKA-C, and ultimately stabilization and activation of GLI. During Wnt signal transduction, active LRP5/6 is phosphorylated on its cytoplasmic tail by glycogen synthase kinase (GSK)-3β and casein kinase (CK)-1ɑ, triggering membrane sequestration and inhibition of GSK-3β, and ultimately stabilization and activation of β-catenin. Note that this is a simplified and highly schematized diagram and is not intended to be comprehensive; many other components of both pathways (for example, the destruction complex in which GSK-3β and β-catenin reside) are omitted in order to highlight mechanistic similarities between the underlying transmembrane signaling mechanisms.
Fig. 1:
Fig. 1:. SMO binds PKA-C as a pseudosubstrate.
a, CLUSTAL alignment of the mouse SMO pCT with the PKIɑ pseudosubstrate region. Additional PKA-C pseudosubstrate and substrate sequences are provided for comparison,,. P-site is yellow; other key conserved residues are green. Spiral cartoon above alignment indicates predicted SMO helical region. Standard (615–638) and extended (615–652) SMO peptides used for in vitro assays are colored red or black, respectively. Inset, structure of PKA-Cɑ bound to PKIɑ(5–24) (PDB: 3FJQ), with ATP colored orange and key PKI residues colored as described above. b, Top, fluorescence polarization assay employing FAM-labeled SMO peptide, 1 mM ATP, and varying concentrations of human PKA-Cɑ. Points represent the mean from two separate experiments composed of quadruplicates. Bottom, the same assay except with 3 μM PKA-Cɑ and varying concentrations of ATP. Quadruplicates representative of two independent trials are plotted. c, Overlay of purified mouse PKA-Cɑ onto an array of SMO peptides containing the indicated substitutions in the P−13, P−3, and P−2 positions. d, SPR sensorgram for binding of PKA-Cɑ, in concentrations ranging from 5 nM to 2.5 μM, to GST-tagged wild-type SMO pCT. Buffer contained 1 mM ATP and 10 mM MgCl2. e, As d, but with SMO pCT harboring the WRR mutation. Note that the negative signal results from the subtraction of the non-specific binding of PKA-Cɑ to a GST control surface.
Fig. 2:
Fig. 2:. SMO induces changes in the amide fingerprint of PKA-C.
a, Mapping of amide backbone chemical shift perturbations (CSP) for [1H, 15N]-labeled PKA-Cɑ bound to nucleotide (ATPɣN) and either an extended SMO wild-type (red) or WRR mutant (blue) peptide, provided at a 1:6 PKA-Cɑ:peptide ratio, and calculated relative to ATPɣN-bound PKA-Cɑ without peptide. Key secondary structural elements within the N-lobe and C-lobe of PKA-Cɑ are determined via assignment of resonances in the kinase spectrum as previously described, and are indicated along the X-axis. Gray spheres designate PKA-Cɑ residues that typically show a signal for PKIɑ(5–24),, but are broadened out upon binding SMO. Dashed lines indicate one standard deviation from baseline for each dataset. b, CSP values from a were mapped onto the PKA-Cɑ structure (PDB: 4WB5) and displayed as a heatmap. c, Competition-induced changes in the indicated residues observed in the NMR spectrum upon titration of PKIɑ(5–24) peptide (1:0.5, 1:1, 1:2, 1:4, or 1:6 ratios, relative to PKA-Cɑ) into a SMO peptide:ATPɣN:PKA-Cɑ complex (1:6 PKA-Cɑ:SMO peptide ratio). Spectrum for ATPɣN-bound PKA-Cɑ (green) and SMO peptide:ATPɣN:PKA-Cɑ complex (red) are shown for reference.
Fig. 3:
Fig. 3:. SMO inhibits PKA-C enzymatic activity.
a, Spectrophotometric assay of PKA-Cɑ substrate phosphorylation, in the presence of standard (red) or extended (coral) SMO peptides (see Fig. 1a) or a control PKIα(5–24) peptide (grey). b, Concentration dependent inhibition of PKA-Cɑ with recombinant SMO pCT. c, As a, but comparing wild-type vs. WRR mutant versions of the recombinant SMO pCT.Inhibition in a-c is calculated relative to a control without SMO or PKIα(5–24) peptide (Ctrl.). Data in a-c is shown as the mean +/− standard deviation of two independent experiments. P < 0.001 (***); P < 0.0001 (****), n.s. = not significant. See Supplementary Table 1 for full statistical analysis.
Fig. 4:
Fig. 4:. The SMO PKI motif is required for Hh signal transduction.
a, Top, schematic diagram of truncated SMO expression constructs. Bottom, BRET analysis of SMO / PKA-C interactions in HEK293 cells expressing nanoluc-tagged wild-type SMO657 (SMO657 wt) or SMO657 harboring the WRR mutation (SMO657 WRR), along with YFP-tagged PKA-Cɑ. SMO566 (which lacks the C-tail) serves as a negative control donor. YFP-tagged βarrestin1 (which exhibits minimal binding to SMO) and NbSmo2 (which binds the intracellular surface of the SMO 7TM domain) serve as negative and positive control acceptors, respectively. Data represent mean +/− standard deviation, n = three biologically independent samples. b, Left, confocal images of live HEK293 cells coexpressing GFP-tagged PKA-Cɑ with FLAG-tagged wild-type or mutant SMO674. Cells were treated with SMO agonist (SAG21k). Scale bar = 10 μm. Right, quantification of SMO / PKA-C colocalization with the median represented by a dashed line and the upper and lower quartiles indicated by dotted lines (n=34 or 48 cells for “wt” or “WRR”, respectively, examined over two independent experiments). c, BRET analysis of SMO / PKA-C interactions in IMCD3 cells expressing nanoluc-tagged wild-type or mutant SMO, along with low levels of PKA-Cɑ-YFP. PKA-RIɑ-YFP serves as a negative control. Under these conditions, PKA-Cɑ-YFP is expressed at substantially lower levels than PKA-RIɑ-YFP. Data represent mean +/− standard deviation, n = three biologically independent samples. P < 0.05 (*); P < 0.01 (**), P < 0.0001 (****), n.s. = not significant. See Supplementary Table 1 for full statistical analysis.
Fig. 5:
Fig. 5:. SMO colocalizes with endogenous PKA-C in primary cilia.
a, Left, immunofluorescence microscopy images of endogenous PKA-C (green) in NIH3T3 cells stably expressing a V5-TurboID-tagged full-length SMO construct at low levels (see Extended Data Fig. 7 and “Supplementary Note 1”), and treated with SAG, cyclopamine (“Cyc”), or vehicle control (“Ctrl”) for 8 hours. SMO is marked by a fluorescent streptavidin conjugate (magenta). Cilium is marked by Arl13b (yellow). Scale bar = 10 μm. b, Quantification of SMO or PKA-C signal intensity in cilia, with the median represented by a dashed line and the upper and lower quartiles indicated by dotted lines (n=74, 81, or 78 cells per condition for “Ctrl”, “SAG”, or “Cyc”, respectively, examined over two independent experiments). P < 0.0001 (****), n.s. = not significant. See Supplementary Table 1 for full statistical analysis.
Fig. 6:
Fig. 6:. The SMO PKI motif is required for Hh signal transduction.
a, CREB transcriptional reporter assay, reflecting PKA-C mediated substrate phosphorylation, in HEK293 cells transfected with PKA-Cɑ and the indicated SMO674 constructs. Data represent the mean +/− standard deviation, n = three biologically independent samples. b, GLI transcriptional reporter assay in Smo−/− MEFs transfected with a GFP negative control (Ctrl), or the indicated wild-type (wt) or mutant SMO constructs. Cells were treated with conditioned medium containing the N-terminal signaling domain of Sonic hedgehog (ShhN, green), or control, non-ShhN-containing conditioned medium (Ctrl, black). Data represent the mean +/− standard deviation, n = three biologically independent samples. c, Wild-type or smo−/− zebrafish injected with the indicated mRNA constructs were stained for Prox1 (magenta) or Engrailed (En, green) to mark muscle fiber nuclei. n=12 (uninjected), n=41 (SMO wt), n= 47 (SMO WRR). P < 0.05 (*); P < 0.01 (**), P < 0.001 (***), n.s. = not significant. See Supplementary Table 1 for full statistical analysis of Fig. 6a,b.
Fig. 7:
Fig. 7:. An avidity-based mechanism for SMO inhibition of PKA-C.
a, Annotated sequence of the mouse SMO pCT. PKI motif is indicated in red, along with GRK2/3 phosphorylation sites (orange) and residues 570–581 (green box), previously shown to influence SMO / PKA-C interactions and Hh signal transduction,. b, BRET analysis of SMO / PKA-C interactions in HEK293 cells transfected with full-length wild-type SMO (wt, navy) WRR mutant (purple), or C-terminally truncated (SMO566, white) versions of SMO as donor, and the indicated DNA amounts of PKA-Cɑ as acceptor. Nonspecific signal is indicated by the negative control BRET acceptor βarrestin1 (dashed line). Data represent the mean +/− standard deviation, n = three biologically independent samples.). P < 0.05 (*); P < 0.01 (**), See Supplementary Table 1 for full statistical analysis. c, Representative image of a tiled array of 18mer peptides covering the complete C-tail of human SMO, probed with PKA-Cɑ as in Fig. 1c. Peptides that bind are boxed and their sequences indicated. d, Proposed model for Hh signal transduction, as described in “Discussion.”

References

    1. Briscoe J & Therond PP The mechanisms of Hedgehog signalling and its roles in development and disease. Nat Rev Mol Cell Biol 14, 416–29 (2013). - PubMed
    1. Ingham PW & McMahon AP Hedgehog signaling in animal development: paradigms and principles. Genes Dev 15, 3059–87 (2001). - PubMed
    1. Ingham PW, Nakano Y & Seger C Mechanisms and functions of Hedgehog signalling across the metazoa. Nat Rev Genet 12, 393–406 (2011). - PubMed
    1. Kong JH, Siebold C & Rohatgi R Biochemical mechanisms of vertebrate hedgehog signaling. Development 146(2019). - PMC - PubMed
    1. Muenke M & Beachy PA Genetics of ventral forebrain development and holoprosencephaly. Curr Opin Genet Dev 10, 262–9 (2000). - PubMed

METHODS-ONLY REFERENCES:

    1. Zimmermann B, Schweinsberg S, Drewianka S & Herberg FW Effect of metal ions on high-affinity binding of pseudosubstrate inhibitors to PKA. Biochem J 413, 93–101 (2008). - PubMed
    1. Myers BR et al. Hedgehog pathway modulation by multiple lipid binding sites on the smoothened effector of signal response. Dev Cell 26, 346–57 (2013). - PMC - PubMed
    1. Lu TW et al. Two PKA RIalpha holoenzyme states define ATP as an isoform-specific orthosteric inhibitor that competes with the allosteric activator, cAMP. Proc Natl Acad Sci U S A 116, 16347–16356 (2019). - PMC - PubMed
    1. Olsen SR & Uhler MD Affinity purification of the C alpha and C beta isoforms of the catalytic subunit of cAMP-dependent protein kinase. J Biol Chem 264, 18662–6 (1989). - PubMed
    1. Walker C et al. Cushing’s syndrome driver mutation disrupts protein kinase A allosteric network, altering both regulation and substrate specificity. Sci Adv 5, eaaw9298 (2019). - PMC - PubMed

Publication types

MeSH terms

Substances