

Identification of novel cuproptosis-related lncRNA signatures to predict the prognosis and immune microenvironment of breast cancer patients
- PMID: 36203428
- PMCID: PMC9531154
- DOI: 10.3389/fonc.2022.988680
Identification of novel cuproptosis-related lncRNA signatures to predict the prognosis and immune microenvironment of breast cancer patients
Abstract
Background: Cuproptosis is a new modality of cell death regulation that is currently considered as a new cancer treatment strategy. Nevertheless, the prognostic predictive value of cuproptosis-related lncRNAs in breast cancer (BC) remains unknown. Using cuproptosis-related lncRNAs, this study aims to predict the immune microenvironment and prognosis of BC patients. and develop new therapeutic strategies that target the disease.
Methods: The Cancer Genome Atlas (TCGA) database provided the RNA-seq data along with the corresponding clinical and prognostic information. Univariate and multivariate Cox regression analyses were performed to acquire lncRNAs associated with cuproptosis to establish predictive features. The Kaplan-Meier method was used to calculate the overall survival rate (OS) in the high-risk and low-risk groups. High risk and low risk gene sets were enriched to explore functional discrepancies among risk teams. The mutation data were analyzed using the "MAFTools" r-package. The ties of predictive characteristics and immune status had been explored by single sample gene set enrichment analysis (ssGSEA). Last, the correlation between predictive features and treatment condition in patients with BC was analyzed. Based on prognostic risk models, we assessed associations between risk subgroups and immune scores and immune checkpoints. In addition, drug responses in at-risk populations were predicted.
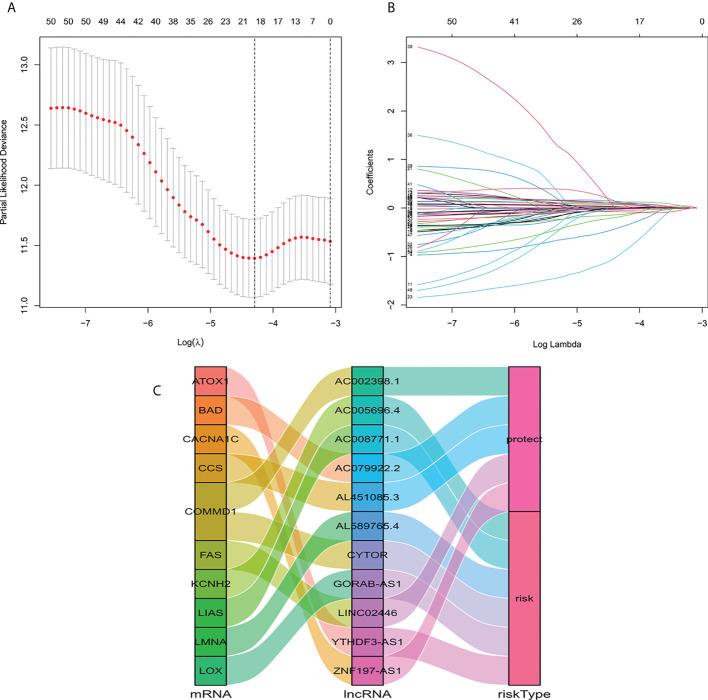
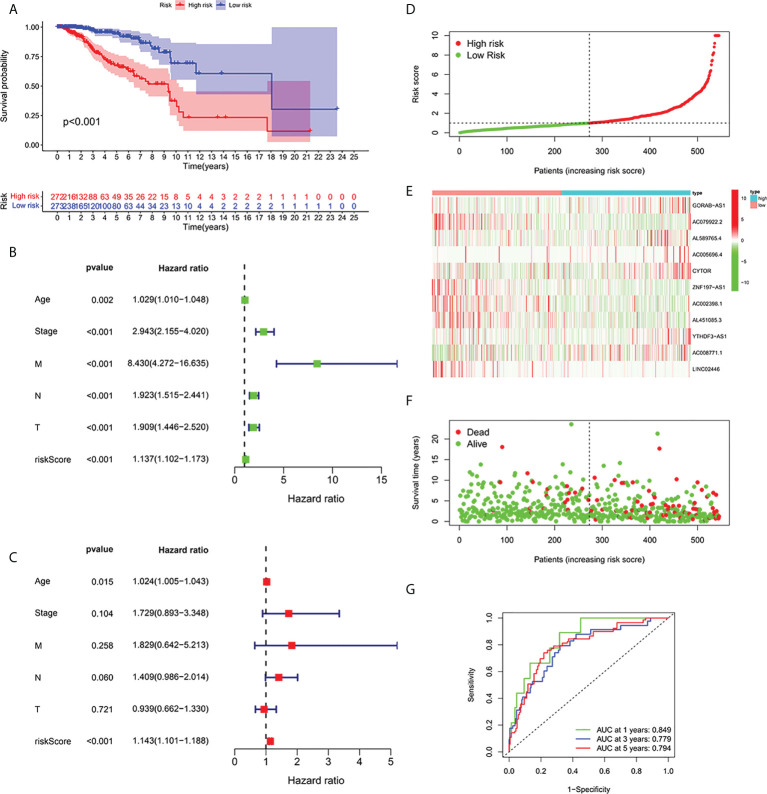
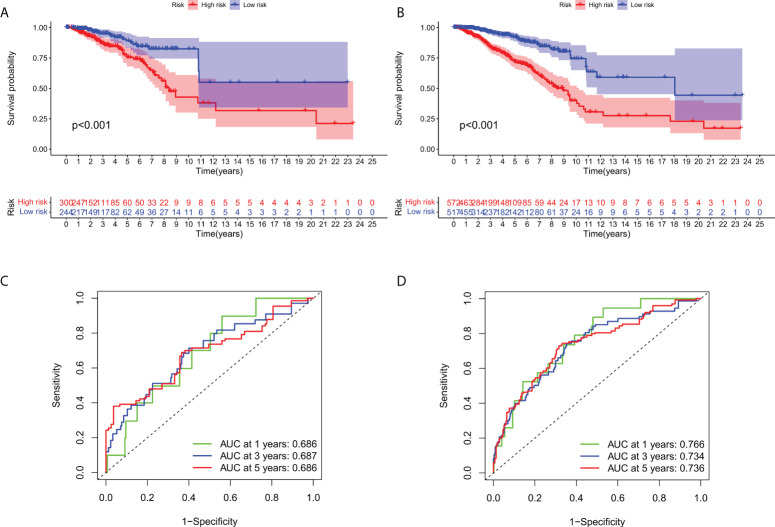
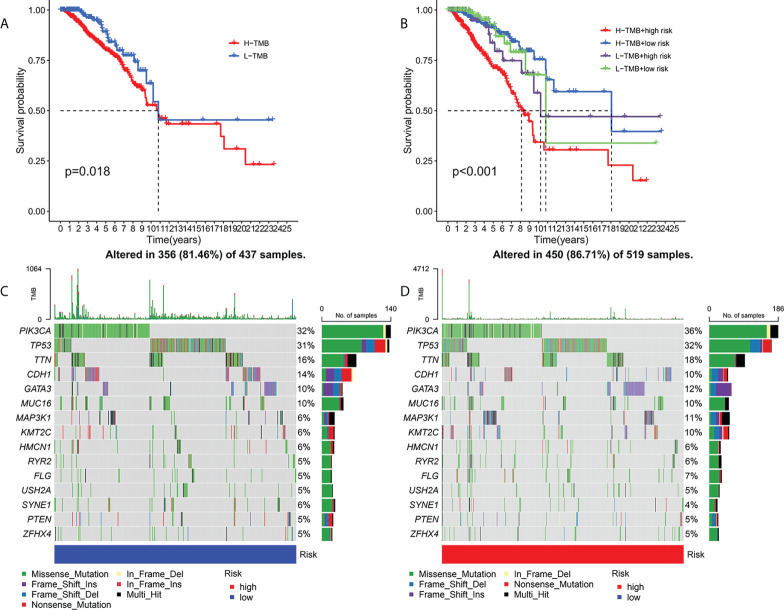
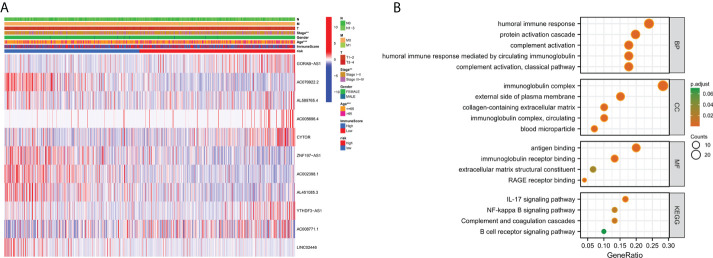
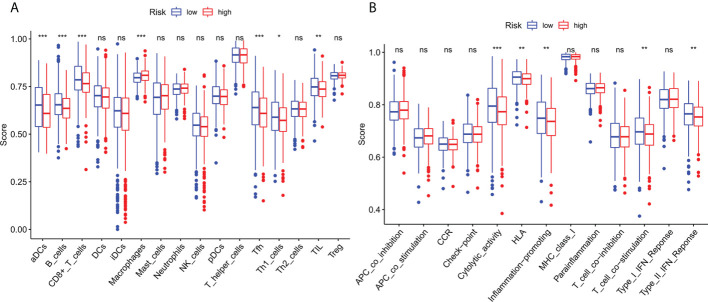
Results: We identified a set of 11 Cuproptosis-Related lncRNAs (GORAB-AS1, AC 079922.2, AL 589765.4, AC 005696.4, Cytor, ZNF 197-AS1, AC 002398.1, AL 451085.3, YTH DF 3-AS1, AC 008771.1, LINC 02446), based on which to construct the risk model. In comparison to the high-risk group, the low-risk patients lived longer (p < 0.001). Moreover, cuproptosis-related lncRNA profiles can independently predict prognosis in BC patients. The AUC values for receiver operating characteristics (ROC) of 1-, 3-, and 5-year risk were 0.849, 0.779, and 0.794, respectively. Patients in the high-risk group had lower OS than those in the low-risk group when they were divided into groups based on various clinicopathological variables. The tumor burden mutations (TMB) correlation analysis showed that high TMB had a worse prognosis than low-TMB, and gene mutations were found to be different in high and low TMB groups, such as PIK3CA (36% versus 32%), SYNE1 (4% versus 6%). Gene enrichment analysis indicated that the differential genes were significantly concentrated in immune-related pathways. The predictive traits were significantly correlated with the immune status of BC patients, according to ssGSEA results. Finally, high-risk patients showed high sensitivity in anti-CD276 immunotherapy and conventional chemotherapeutic drugs such as imatinib, lapatinib, and pazopanib.
Conclusion: We successfully constructed of a cuproptosis-related lncRNA signature, which can independently predict the prognosis of BC patients and can be used to estimate OS and clinical treatment outcomes in BRCA patients. It will serve as a foundation for further research into the mechanism of cuproptosis-related lncRNAs in breast cancer, as well as for the development of new markers and therapeutic targets for the disease.
Keywords: breast cancer; cuproptosis; lncRNA; tumor microenvironment; tumor mutation burden.
Copyright © 2022 Jiang, Yang, Jin, Yi, Bing, Zhou and Yang.
Conflict of interest statement
The authors declare that the research was conducted in the absence of any commercial or financial relationships that could be construed as a potential conflict of interest.
Figures


Similar articles
-
A Cuproptosis-Related LncRNA Risk Model for Predicting Prognosis and Immunotherapeutic Efficacy in Patients with Hepatocellular Carcinoma.Biochem Genet. 2024 Jun;62(3):2332-2351. doi: 10.1007/s10528-023-10539-x. Epub 2023 Oct 29. Biochem Genet. 2024. PMID: 37898914
-
Cuproptosis-related lncRNA scoring system to predict the clinical outcome and immune landscape in pancreatic adenocarcinoma.Sci Rep. 2023 Nov 27;13(1):20870. doi: 10.1038/s41598-023-47223-4. Sci Rep. 2023. PMID: 38012210 Free PMC article.
-
Cuproptosis-related long non-coding RNAs model that effectively predicts prognosis in hepatocellular carcinoma.World J Gastrointest Oncol. 2022 Oct 15;14(10):1981-2003. doi: 10.4251/wjgo.v14.i10.1981. World J Gastrointest Oncol. 2022. PMID: 36310708 Free PMC article.
-
lncRNAs as prognostic markers and therapeutic targets in cuproptosis-mediated cancer.Clin Exp Med. 2024 Sep 26;24(1):226. doi: 10.1007/s10238-024-01491-0. Clin Exp Med. 2024. PMID: 39325172 Free PMC article. Review.
-
Elucidating the evolving role of cuproptosis in breast cancer progression.Int J Biol Sci. 2024 Sep 9;20(12):4872-4887. doi: 10.7150/ijbs.98806. eCollection 2024. Int J Biol Sci. 2024. PMID: 39309446 Free PMC article. Review.
Cited by
-
LncRNA FAS-AS1 upregulated by its genetic variation rs6586163 promotes cell apoptosis in nasopharyngeal carcinoma through regulating mitochondria function and Fas splicing.Sci Rep. 2023 May 22;13(1):8218. doi: 10.1038/s41598-023-35502-z. Sci Rep. 2023. PMID: 37217794 Free PMC article.
-
IAPP blocks anti-breast cancer function of CD8+T cells via targeting cuproptosis.Front Immunol. 2024 Nov 25;15:1481129. doi: 10.3389/fimmu.2024.1481129. eCollection 2024. Front Immunol. 2024. PMID: 39654888 Free PMC article.
-
A Prognostic Cuproptosis-Related LncRNA Signature for Colon Adenocarcinoma.J Oncol. 2023 Feb 17;2023:5925935. doi: 10.1155/2023/5925935. eCollection 2023. J Oncol. 2023. PMID: 36844874 Free PMC article.
-
Association between thyroid disorders and extra-thyroidal cancers, a review.Clin Transl Oncol. 2024 Sep;26(9):2075-2083. doi: 10.1007/s12094-024-03434-3. Epub 2024 Mar 15. Clin Transl Oncol. 2024. PMID: 38491294 Review.
-
Causal associations between HbA1c and multiple diseases unveiled through a Mendelian randomization phenome-wide association study in East Asian populations.Medicine (Baltimore). 2025 Mar 14;104(11):e41861. doi: 10.1097/MD.0000000000041861. Medicine (Baltimore). 2025. PMID: 40101035 Free PMC article.
References
LinkOut - more resources
Full Text Sources
Research Materials
Miscellaneous