

Glycosyltransferase-related long non-coding RNA signature predicts the prognosis of colon adenocarcinoma
- PMID: 36203430
- PMCID: PMC9530784
- DOI: 10.3389/fonc.2022.954226
Glycosyltransferase-related long non-coding RNA signature predicts the prognosis of colon adenocarcinoma
Abstract
Purpose: Colon adenocarcinoma (COAD) is the most common type of colorectal cancer (CRC) and is associated with poor prognosis. Emerging evidence has demonstrated that glycosylation by long noncoding RNAs (lncRNAs) was associated with COAD progression. To date, however, the prognostic values of glycosyltransferase (GT)-related lncRNAs in COAD are still largely unknown.
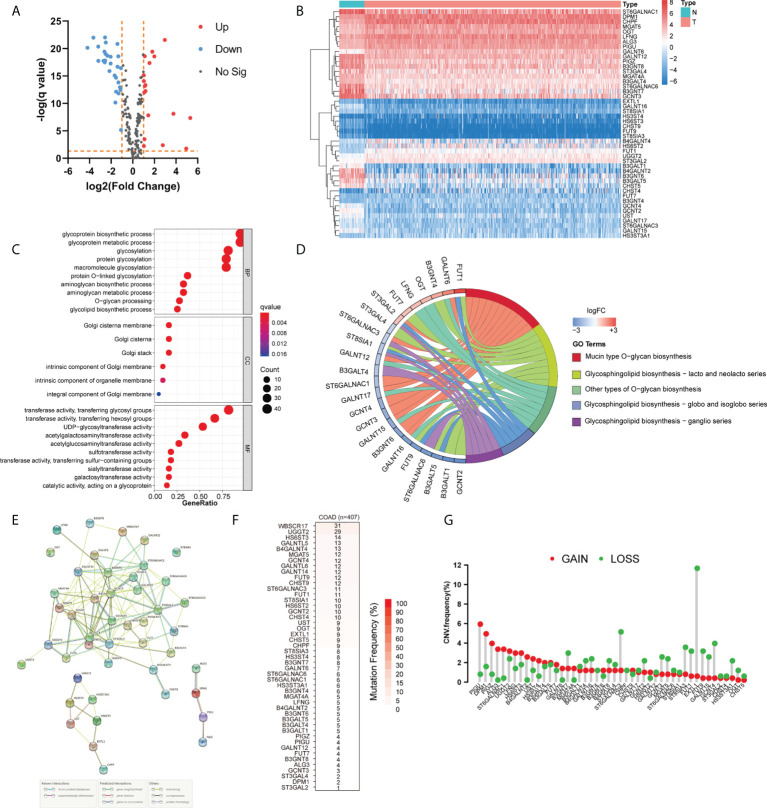
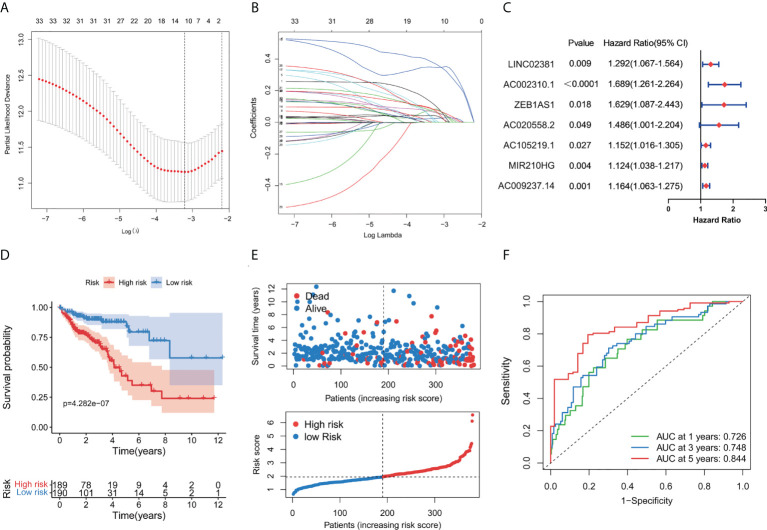
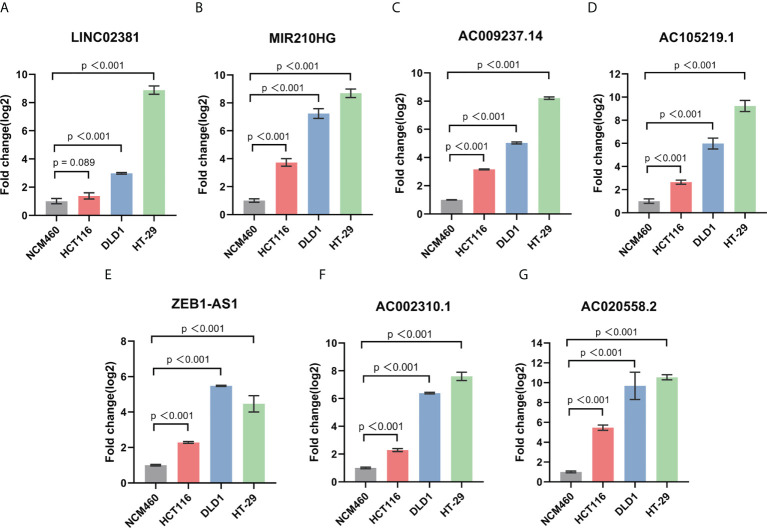
Methods: We obtained the expression matrix of mRNAs and lncRNAs in COAD from The Cancer Genome Atlas (TCGA) database. Then, the univariate Cox regression analysis was conducted to identify 33 prognostic GT-related lncRNAs. Subsequently, LASSO and multivariate Cox regression analysis were performed, and 7 of 33 GT-related lncRNAs were selected to conduct a risk model. Gene set enrichment analysis (GSEA) was used to analyze gene signaling pathway enrichment of the risk model. ImmuCellAI, an online tool for estimating the abundance of immune cells, and correlation analysis were used to explore the tumor-infiltrating immune cells in COAD. Finally, the expression levels of seven lncRNAs were detected in colorectal cancer cell lines by reverse transcription-quantitative polymerase chain reaction (RT-qPCR).
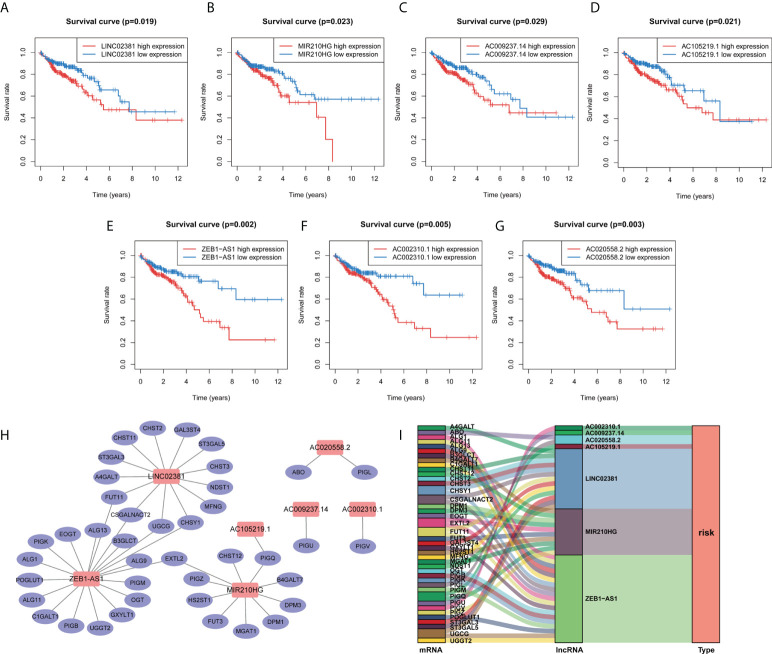
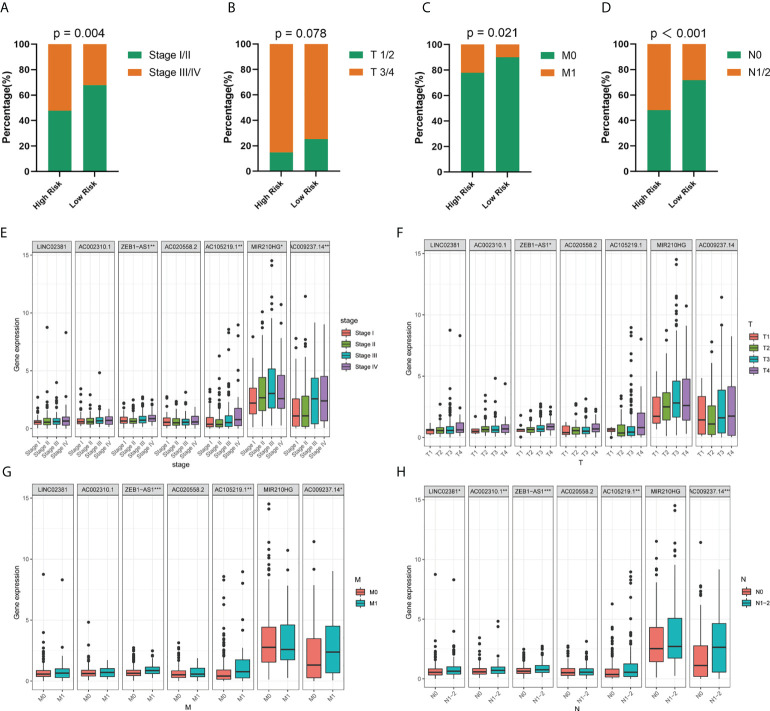
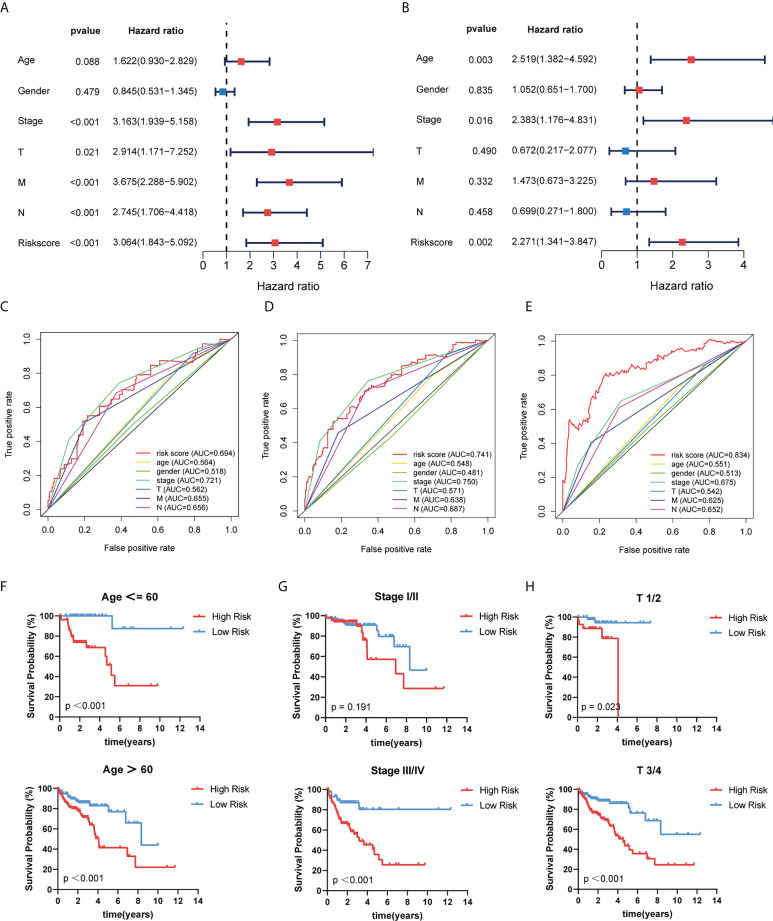
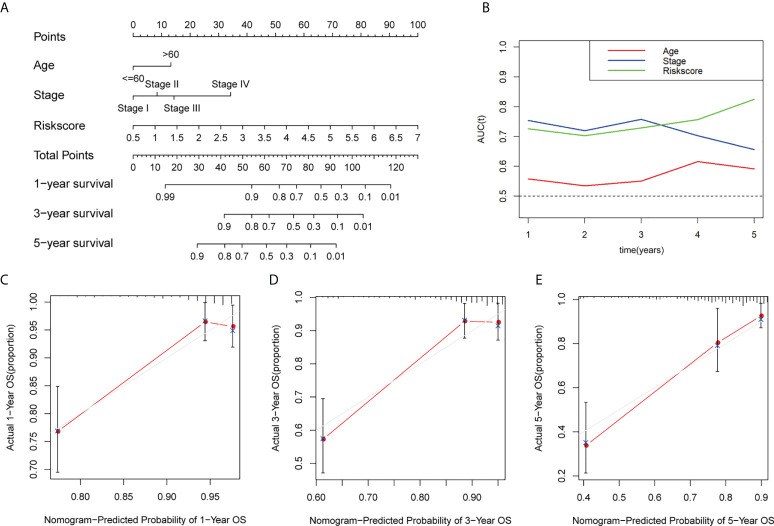
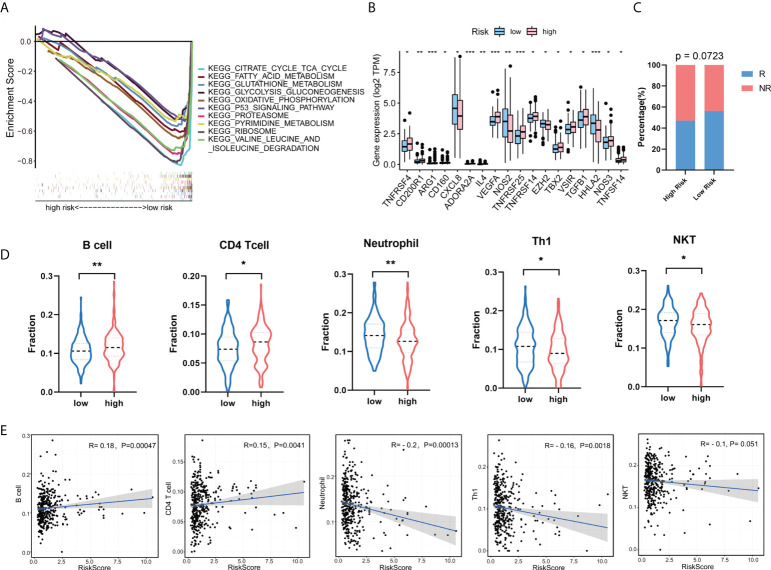
Results: A total of 1,140 GT-related lncRNAs were identified, and 7 COAD-specific GT-related lncRNAs (LINC02381, MIR210HG, AC009237.14, AC105219.1, ZEB1-AS1, AC002310.1, and AC020558.2) were selected to conduct a risk model. Patients were divided into high- and low-risk groups based on the median of risk score. The prognosis of the high-risk group was worse than that of the low-risk group, indicating the good reliability and specificity of our risk model. Additionally, a nomogram based on the risk score and clinical traits was built to help clinical decisions. GSEA showed that the risk model was significantly enriched in metabolism-related pathways. Immune infiltration analysis revealed that five types of immune cells were significantly different between groups, and two types of immune cells were negatively correlated with the risk score. Besides, we found that the expression levels of these seven lncRNAs in tumor cells were significantly higher than those in normal cells, which verified the feasibility of the risk model.
Conclusion: The efficient risk model based on seven GT-related lncRNAs has prognostic potential for COAD, which may be novel biomarkers and therapeutic targets for COAD patients.
Keywords: colorectal cancer; glycosyltransferase; lncRNAs; overall survival; risk model.
Copyright © 2022 Zhang, Wu, Mu, Xin, Wang, Fan, Zhang and Xu.
Conflict of interest statement
The authors declare that the research was conducted in the absence of any commercial or financial relationships that could be construed as a potential conflict of interest.
Figures
Similar articles
-
The Interferon Gamma-Related Long Noncoding RNA Signature Predicts Prognosis and Indicates Immune Microenvironment Infiltration in Colon Adenocarcinoma.Front Oncol. 2022 Jun 7;12:876660. doi: 10.3389/fonc.2022.876660. eCollection 2022. Front Oncol. 2022. PMID: 35747790 Free PMC article.
-
Potential Prognostic Value of a Seven m6A-Related LncRNAs Signature and the Correlative Immune Infiltration in Colon Adenocarcinoma.Front Genet. 2021 Dec 22;12:774010. doi: 10.3389/fgene.2021.774010. eCollection 2021. Front Genet. 2021. PMID: 35003214 Free PMC article.
-
An Intratumor Heterogeneity-Related Signature for Predicting Prognosis, Immune Landscape, and Chemotherapy Response in Colon Adenocarcinoma.Front Med (Lausanne). 2022 Jul 7;9:925661. doi: 10.3389/fmed.2022.925661. eCollection 2022. Front Med (Lausanne). 2022. PMID: 35872794 Free PMC article.
-
Identification of a glycolysis- and lactate-related gene signature for predicting prognosis, immune microenvironment, and drug candidates in colon adenocarcinoma.Front Cell Dev Biol. 2022 Aug 23;10:971992. doi: 10.3389/fcell.2022.971992. eCollection 2022. Front Cell Dev Biol. 2022. PMID: 36081904 Free PMC article.
-
Construction and validation of a cuproptosis-related lncRNA signature as a novel and robust prognostic model for colon adenocarcinoma.Front Oncol. 2022 Jul 28;12:961213. doi: 10.3389/fonc.2022.961213. eCollection 2022. Front Oncol. 2022. PMID: 35965536 Free PMC article.
Cited by
-
Novel insights into lncRNAs as key regulators of post-translational modifications in cancer: mechanisms and therapeutic potential.Cell Oncol (Dordr). 2025 Jul 2. doi: 10.1007/s13402-025-01086-1. Online ahead of print. Cell Oncol (Dordr). 2025. PMID: 40601247 Review.
-
Integrative approach using network pharmacology, bioinformatics, and experimental methods to explore the mechanism of cantharidin in treating colorectal cancer.Naunyn Schmiedebergs Arch Pharmacol. 2024 Sep;397(9):6745-6761. doi: 10.1007/s00210-024-03041-7. Epub 2024 Mar 20. Naunyn Schmiedebergs Arch Pharmacol. 2024. PMID: 38507104
-
Prediction of Prognosis and Chemotherapeutic Sensitivity Based on Cuproptosis-Associated lncRNAs in Cervical Squamous Cell Carcinoma and Endocervical Adenocarcinoma.Genes (Basel). 2023 Jun 30;14(7):1381. doi: 10.3390/genes14071381. Genes (Basel). 2023. PMID: 37510286 Free PMC article.
-
Predictive Significance of Glycosyltransferase-Related lncRNAs in Endometrial Cancer: A Comprehensive Analysis and Experimental Validation.ACS Omega. 2025 Feb 24;10(8):8023-8041. doi: 10.1021/acsomega.4c09071. eCollection 2025 Mar 4. ACS Omega. 2025. PMID: 40060793 Free PMC article.
References
LinkOut - more resources
Full Text Sources
Miscellaneous