. 2022 Sep 20:12:910494.
doi: 10.3389/fonc.2022.910494. eCollection 2022.

Identification of therapeutically potential targets and their ligands for the treatment of OSCC

Affiliations

Identification of therapeutically potential targets and their ligands for the treatment of OSCC

Pratima Kumari et al. Front Oncol. .

Abstract

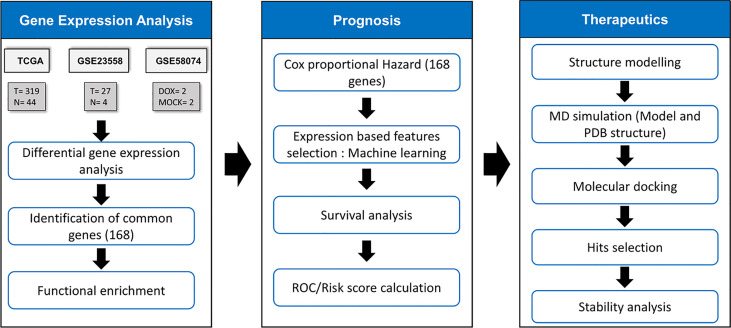
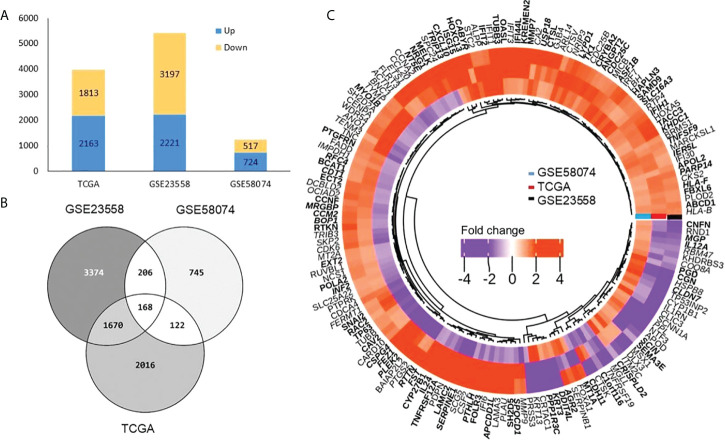
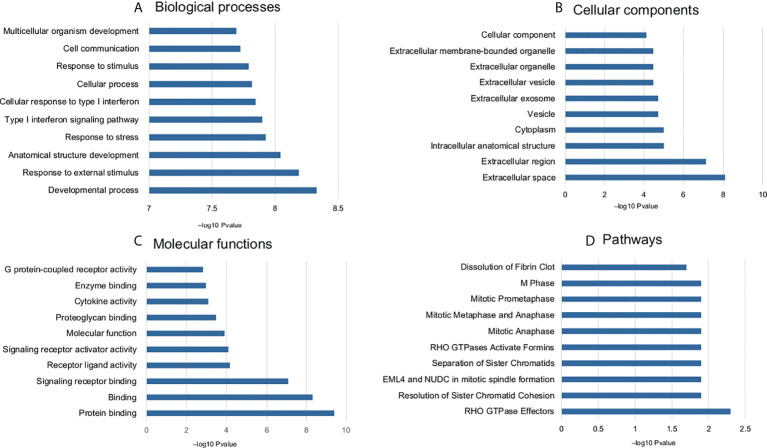
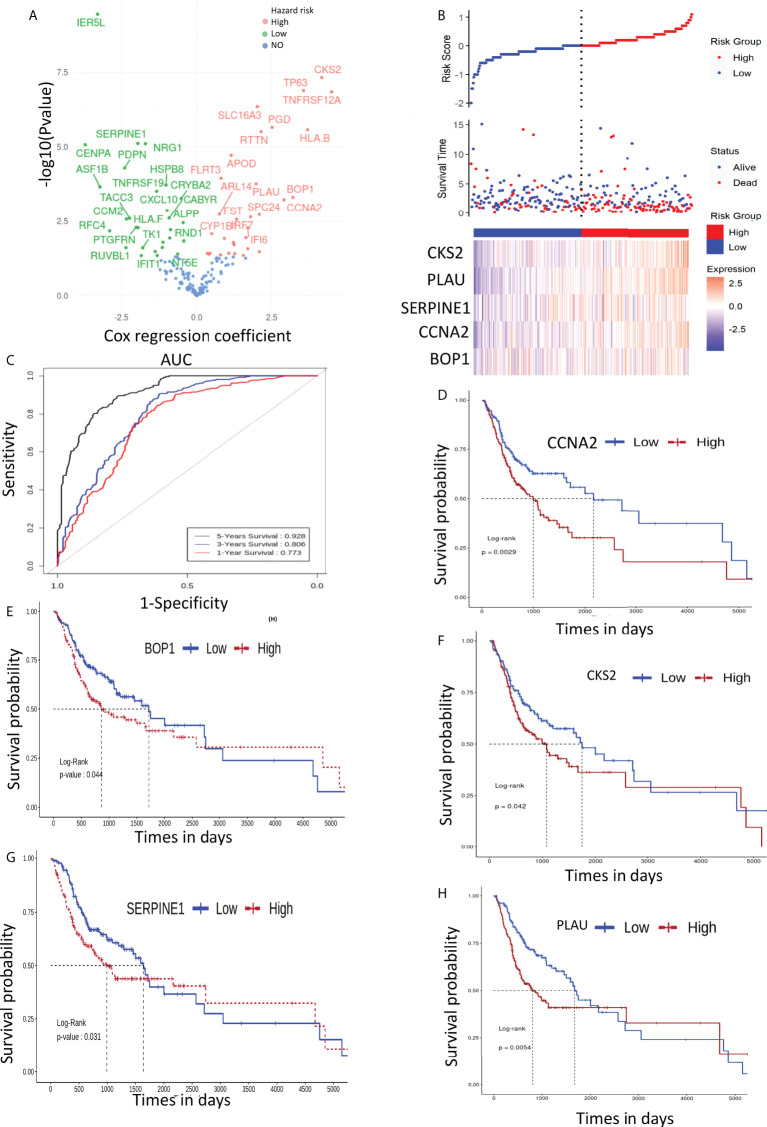
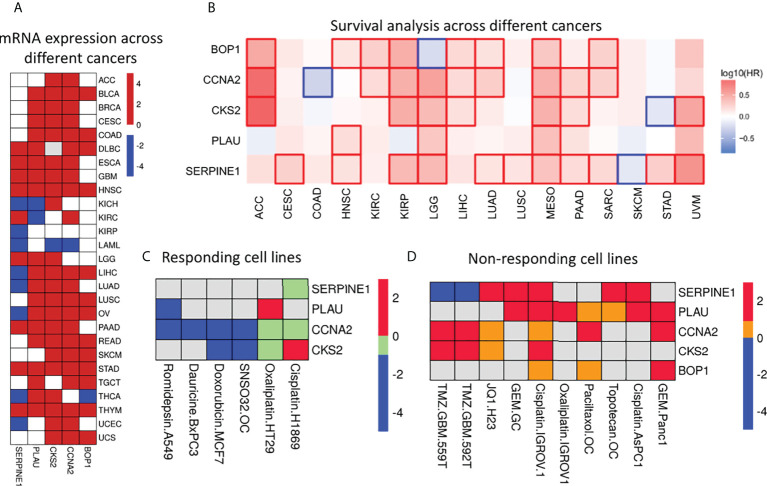
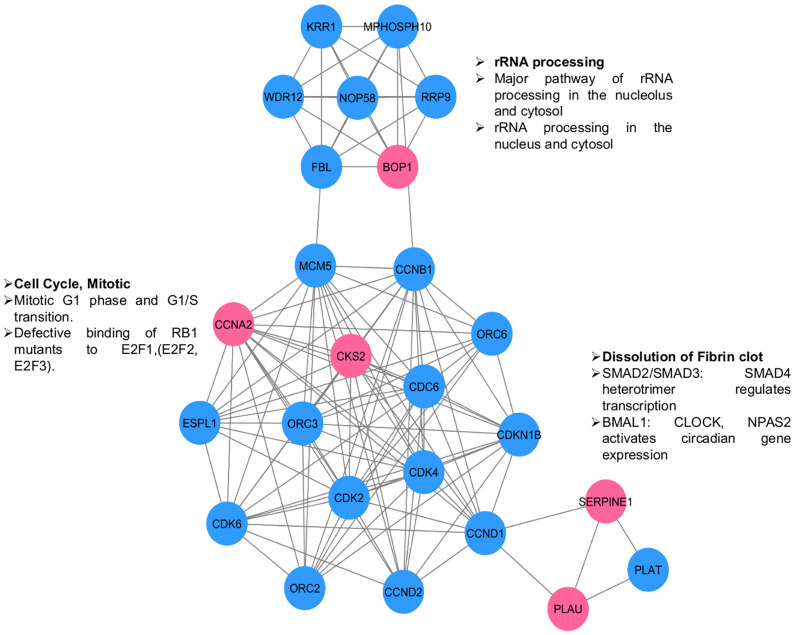
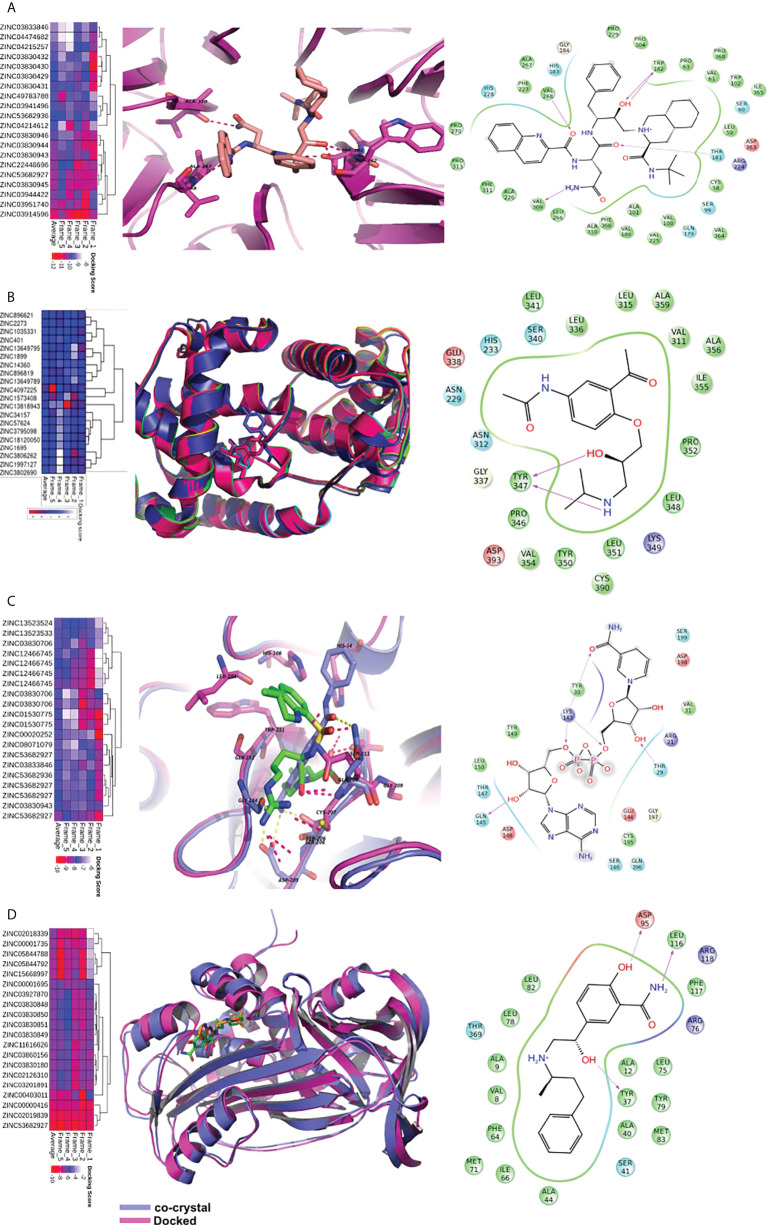
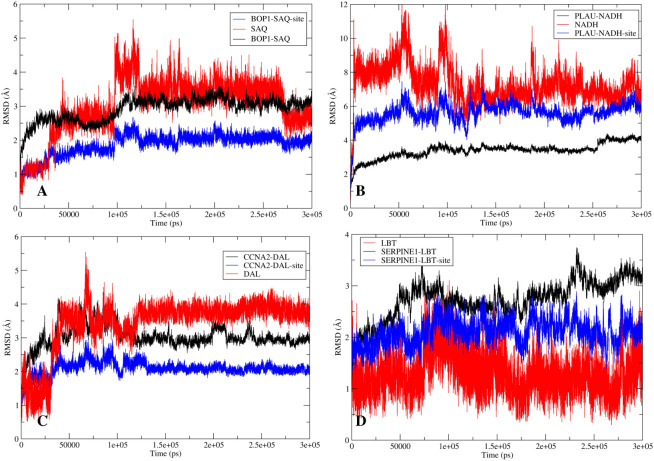
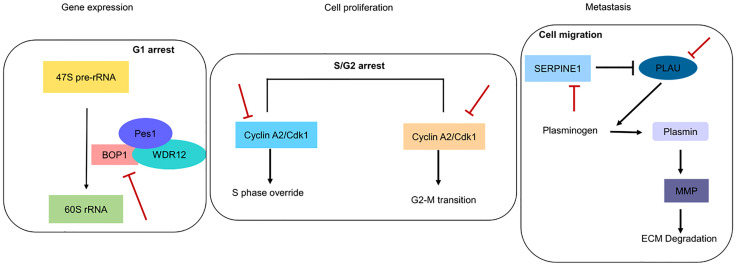
Recent advancements in cancer biology have revealed molecular changes associated with carcinogenesis and chemotherapeutic exposure. The available information is being gainfully utilized to develop therapies targeting specific molecules involved in cancer cell growth, survival, and chemoresistance. Targeted therapies have dramatically increased overall survival (OS) in many cancers. Therefore, developing such targeted therapies against oral squamous cell carcinoma (OSCC) is anticipated to have significant clinical implications. In the current work, we have identified drug-specific sensitivity-related prognostic biomarkers (BOP1, CCNA2, CKS2, PLAU, and SERPINE1) using gene expression, Cox proportional hazards regression, and machine learning in OSCC. Dysregulation of these markers is significantly associated with OS in many cancers. Their elevated expression is related to cellular proliferation and aggressive malignancy in various cancers. Mechanistically, inhibition of these biomarkers should significantly reduce cellular proliferation and metastasis in OSCC and should result in better OS. It is pertinent to note that no effective small-molecule candidate has been identified against these biomarkers to date. Therefore, a comprehensive in silico drug design strategy assimilating homology modeling, extensive molecular dynamics (MD) simulation, and ensemble molecular docking has been applied to identify potential compounds against identified targets, and potential molecules have been identified. We hope that this study will help in deciphering potential genes having roles in chemoresistance and a significant impact on OS. It will also result in the identification of new targeted therapeutics against OSCC.

Keywords: OSCC; chemoresistance; chemotherapy; drug discovery; prognosis.


Conflict of interest statement

The authors declare that the research was conducted in the absence of any commercial or financial relationships that could be construed as a potential conflict of interest.

Figures

Figure 1
Figure 1
Methodology for identification of drug response related signature and identification of their inhibitors. The TCGA samples had 319 OSCC & 44 normal samples. GSE23558 had 27 OSCC patients’ data. GSE58074 examined the effect of doxorubicin on SCC25 cell lines to check for molecular markers underlying doxorubicin response..
Figure 2
Figure 2
Differentially expressed genes (A) Bar graph representing total DEGs both up (blue) and down (yellow) in three datasets. (B) Venn diagram showing number of DEGs (common and unique) among TCGA, GSE23558 and GSE58074. A total of 168 common DEGs were obtained. (C) Heatmap shows DEGs related to doxorubicin response (GSE58074) and non-treated samples in OSCC from TCGA and GSE23558. Three types of distinct expression pattern are discernible (1) 52 genes overexpressed (orange) in all the three data sets, (2) 76 genes underexpressed in GSE58074 (purple) while overexpressed in TCGA (orange) and GSE23558 (orange), and (3) 26 genes underexpressed in TCGA (purple) and GSE23558 (purple) while overexpressed in GSE58074 (orange).
Figure 3
Figure 3
Enriched GO terms and pathways (top 10) common DEGs associated with doxorubicin response. (A) biological process, (B) cellular components, (C) molecular function, and (D) pathways.
Figure 4
Figure 4
(A) Volcano plot of cox regression showing hazard ratio (HR) for 168 genes. (B) Patient stratification according to risk score to predict the survival time of patients with high- and low-expression level of prognostic genes. (C) ROC depicting the effect of selected genes on overall survival (1, 3, and 5 years). (D–H) depict the effect of signature gene expression on overall survival of OSCC patients..
Figure 5
Figure 5
Expression & significance of selected prognostic genes. (A) Differential gene expression analysis across different cancers. Red, blue and white squares depict over, under and insignificant expression respectively. It is clear that these genes are upregulated in most of the cancers. (B) Survival map: Red and blue squares indicate poor survival due to over and under expression respectively. The figure clearly indicates the expression of these genes have significant effect on survival of the patients across cancers. (C) Heatmap represents expression level of these genes in drug sensitive cells. These genes were found to be significantly differentially expressed (|log2Fc| > 1 and pvalue < 0.05). The down- (blue) and up- (red) regulated genes in response to drug; green square indicates down-regulated genes with significant pvalue but |log2Fc| < 1. Grey square indicated no differential expression. (D) The expression of selected genes in drug resistant cells. Red and blue squares indicate significant (|log2Fc| > 1 and pvalue < 0.05) up- and down-regulated genes; yellow square indicates up-regulated genes with significant pvalue (|log2Fc| < 1); grey square indicated no differential expression of the genes.
Figure 6
Figure 6
PPI network for selected genes (pink circles) to understand their interactions & significance. Other interacting proteins are depicted in blue circles. Three clusters are visible. The enriched functions are shown along the clusters.
Figure 7
Figure 7
Virtual screening of FDA approved drugs against identified proteins. Top scoring 20 molecules for each of the five proteins are shown in heatmap (figures A–D). The first column depicts the heatmap of docking scores in five MD frames. The average docking score is also depicted for better understanding. In the second column, proteins are shown in cartoon while the ligands are shown in sticks. The dotted lines depict hydrogen bonds. The third column depicts the interaction map of the ligand receptor interactions. The pink arrows show hydrogen bonds. The arrowhead depicts the HB-acceptor molecule. Pi-pi stacking interactions are depicted by green line. (A) The docking of saquinavir with BOP1. It makes hydrogen bonding interactions with backbone of TRP-182, VAL-268, VAL-309, and sidechain of THR-181. (B) The binding of molecules in CCNA2. The diacetolol is shown in blue sticks. The ligand makes hydrogen bonds with Tyr347 (C) The binding of ligands in PLAU. NADH is shown in binding site of PLAU. It makes hydrogen bonding interactions with THR30, TYR31, LYS154, and SER157. (D) The binding of ligands in SERPINE1, and docked molecule labetalol. The drug forms hydrogen bonds with sidechain of ASP-95, TYR37.
Figure 8
Figure 8
The stability analysis: The root mean square deviation (RMSD) analysis for the protein-ligand complexes. The RMSD of protein is shown in red while the RMSD of ligand is shown in blue. (A) RMSD for BOP1-Saquinavir complex. (B) RMSD for PLAU-NADH complex. (C) RMSD for CCNA2-Diacetolol complex. (D) RMSD for SERPINE1-Labetalol complex.
Figure 9
Figure 9
Pictorial depiction of identified genes in biological pathways. Red blunt lines indicate that their pharmacological inhibition can inhibit major functions involved in gene expression, cell proliferation and metastasis.

Similar articles

Cited by

References

    1. Sung H, Ferlay J, Siegel RL, Laversanne M, Soerjomataram I, Jemal A, et al. . Global cancer statistics 2020: GLOBOCAN estimates of incidence and mortality worldwide for 36 cancers in 185 countries. CA: Cancer J Clin (2021) 7:1–9. doi: 10.3322/caac.21660 - DOI - PubMed
    1. Jitender S, Sarika G, Varada HR, Omprakash Y, Mohsin K. Screening for oral cancer. J Exp Ther Oncol (2016) 11(4):303–7. doi: 10.1007/s12032-021-01548-0 - DOI - PubMed
    1. Siegel RL, Miller KD, Jemal A. Cancer statistics, 2020. CA: Cancer J Clin (2020) 70(1):7–30. doi: 10.3322/caac.21590 - DOI - PubMed
    1. Nocini R, Capocasale G, Marchioni D, Zotti F. A snapshot of knowledge about oral cancer in Italy: A 505 person survey. Int J Environ Res Public Health (2020) 17(13):4889. doi: 10.3390/ijerph17134889 - DOI - PMC - PubMed
    1. Hartner L. Chemotherapy for oral cancer. Dental Clinics North Am (2018) 62(1):87–97. doi: 10.1016/j.cden.2017.08.006 - DOI - PubMed