

An explanatory model of temperature influence on flowering through whole-plant accumulation of FLOWERING LOCUS T in Arabidopsis thaliana
- PMID: 36203490
- PMCID: PMC9534314
- DOI: 10.1093/insilicoplants/diz006
An explanatory model of temperature influence on flowering through whole-plant accumulation of FLOWERING LOCUS T in Arabidopsis thaliana
Abstract
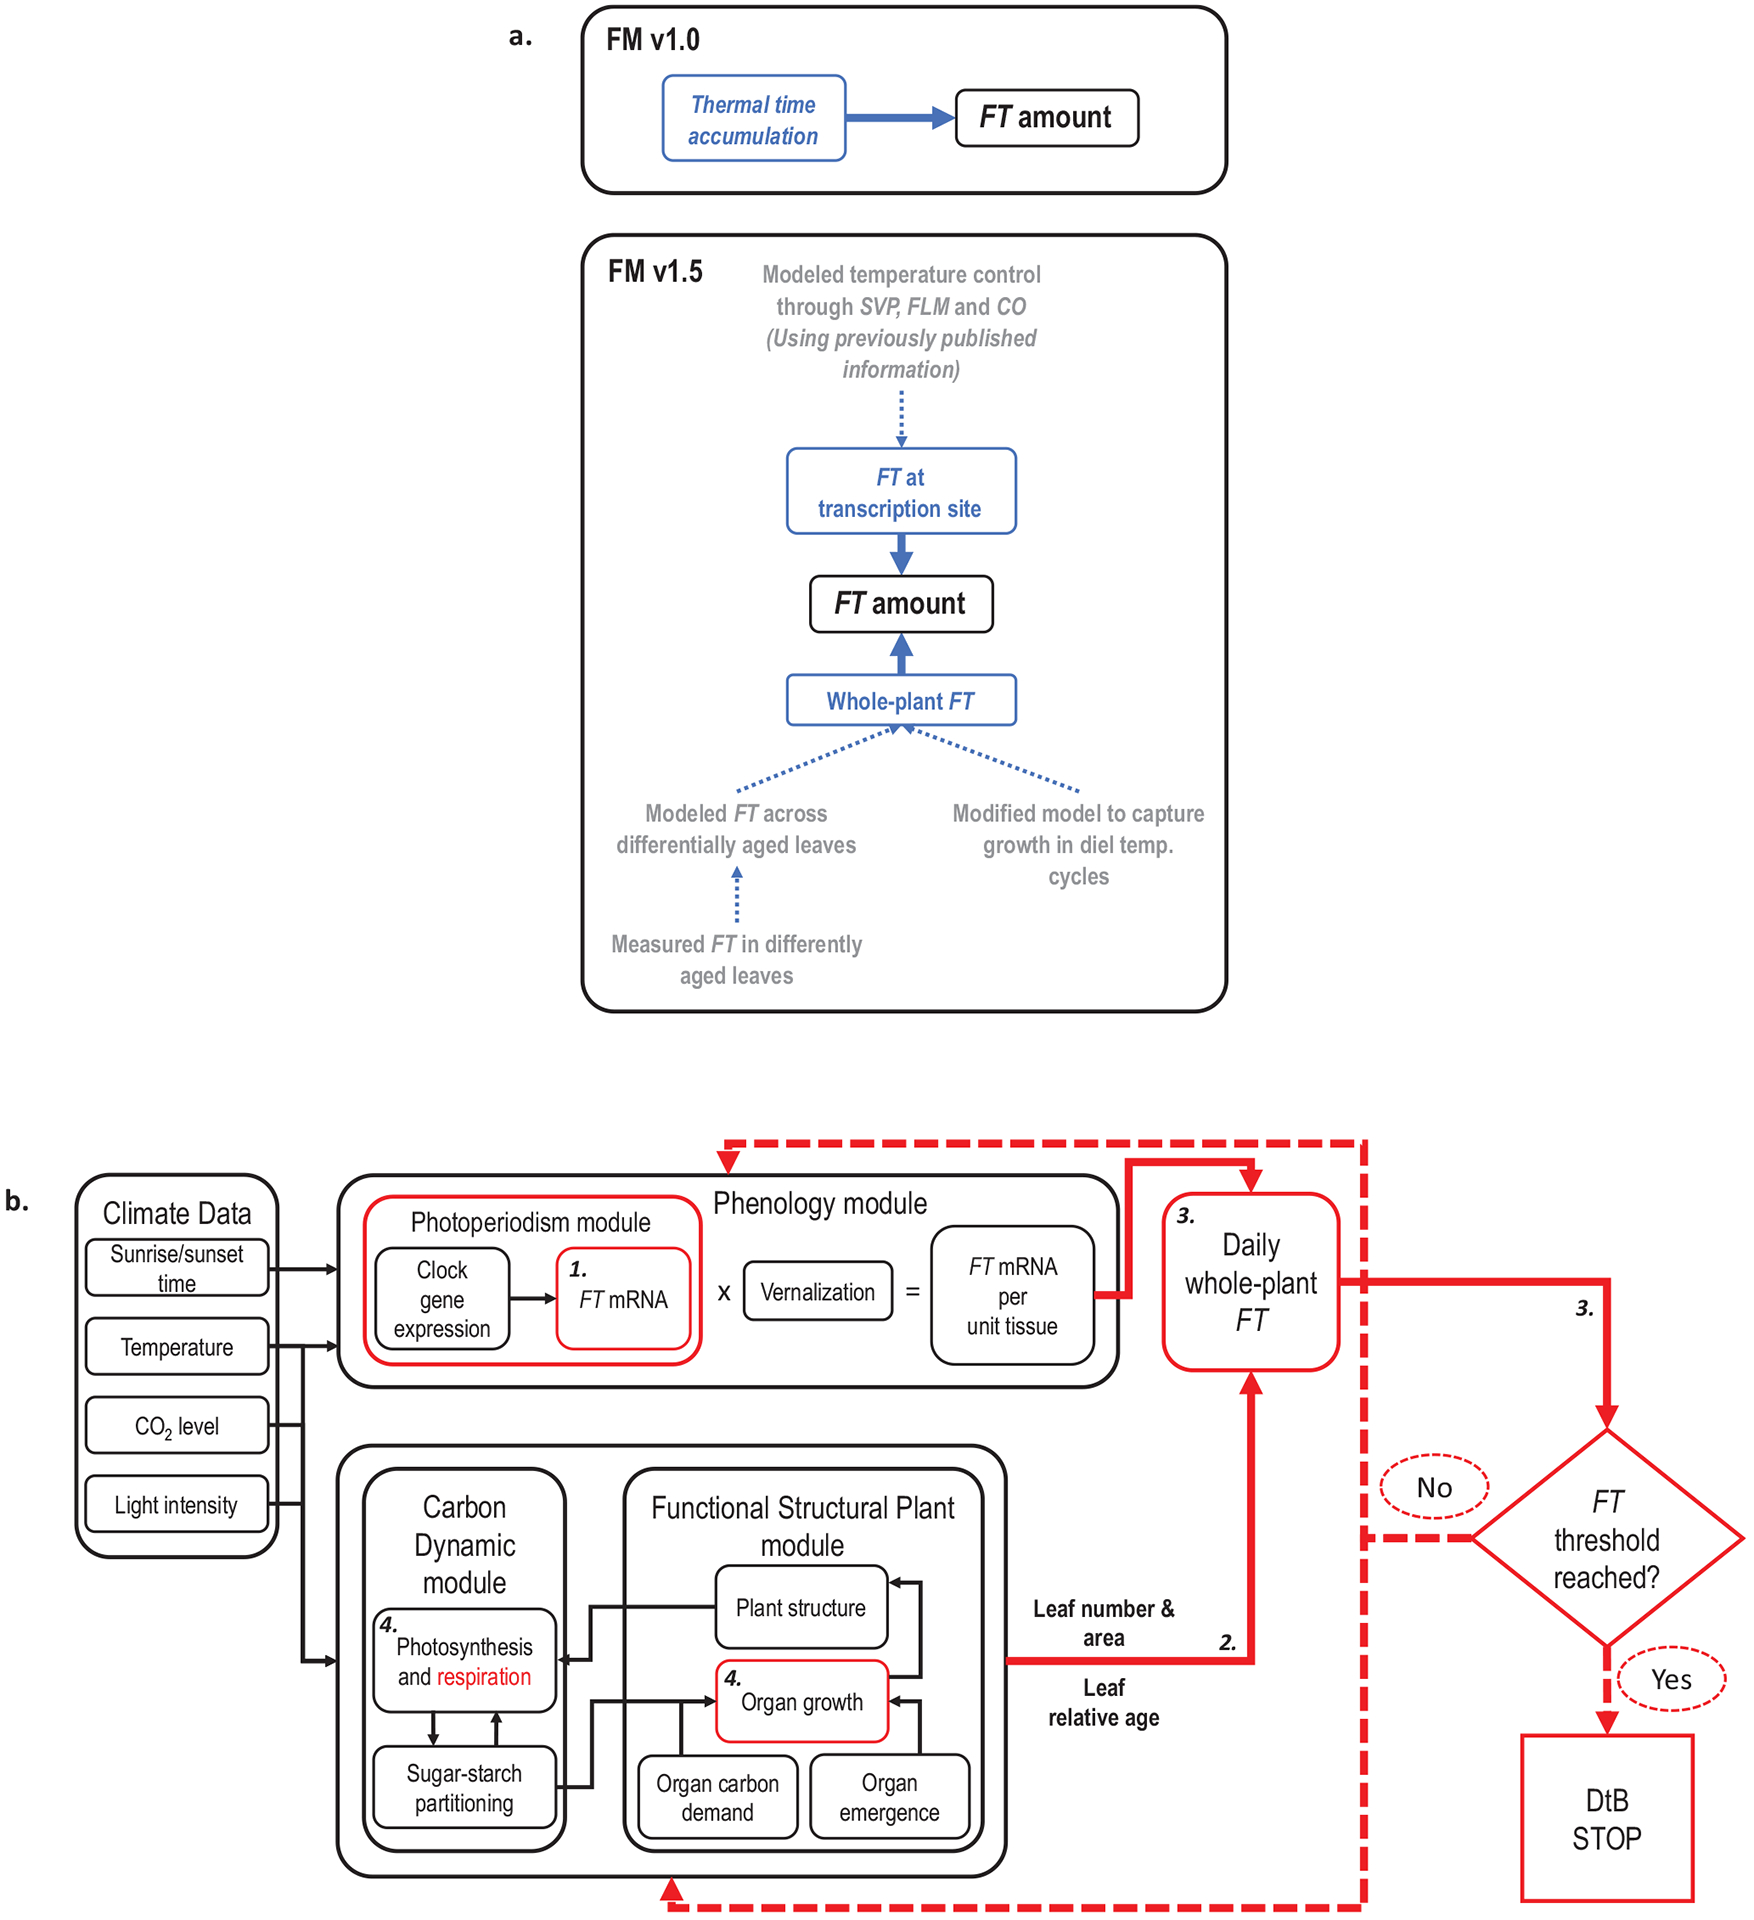
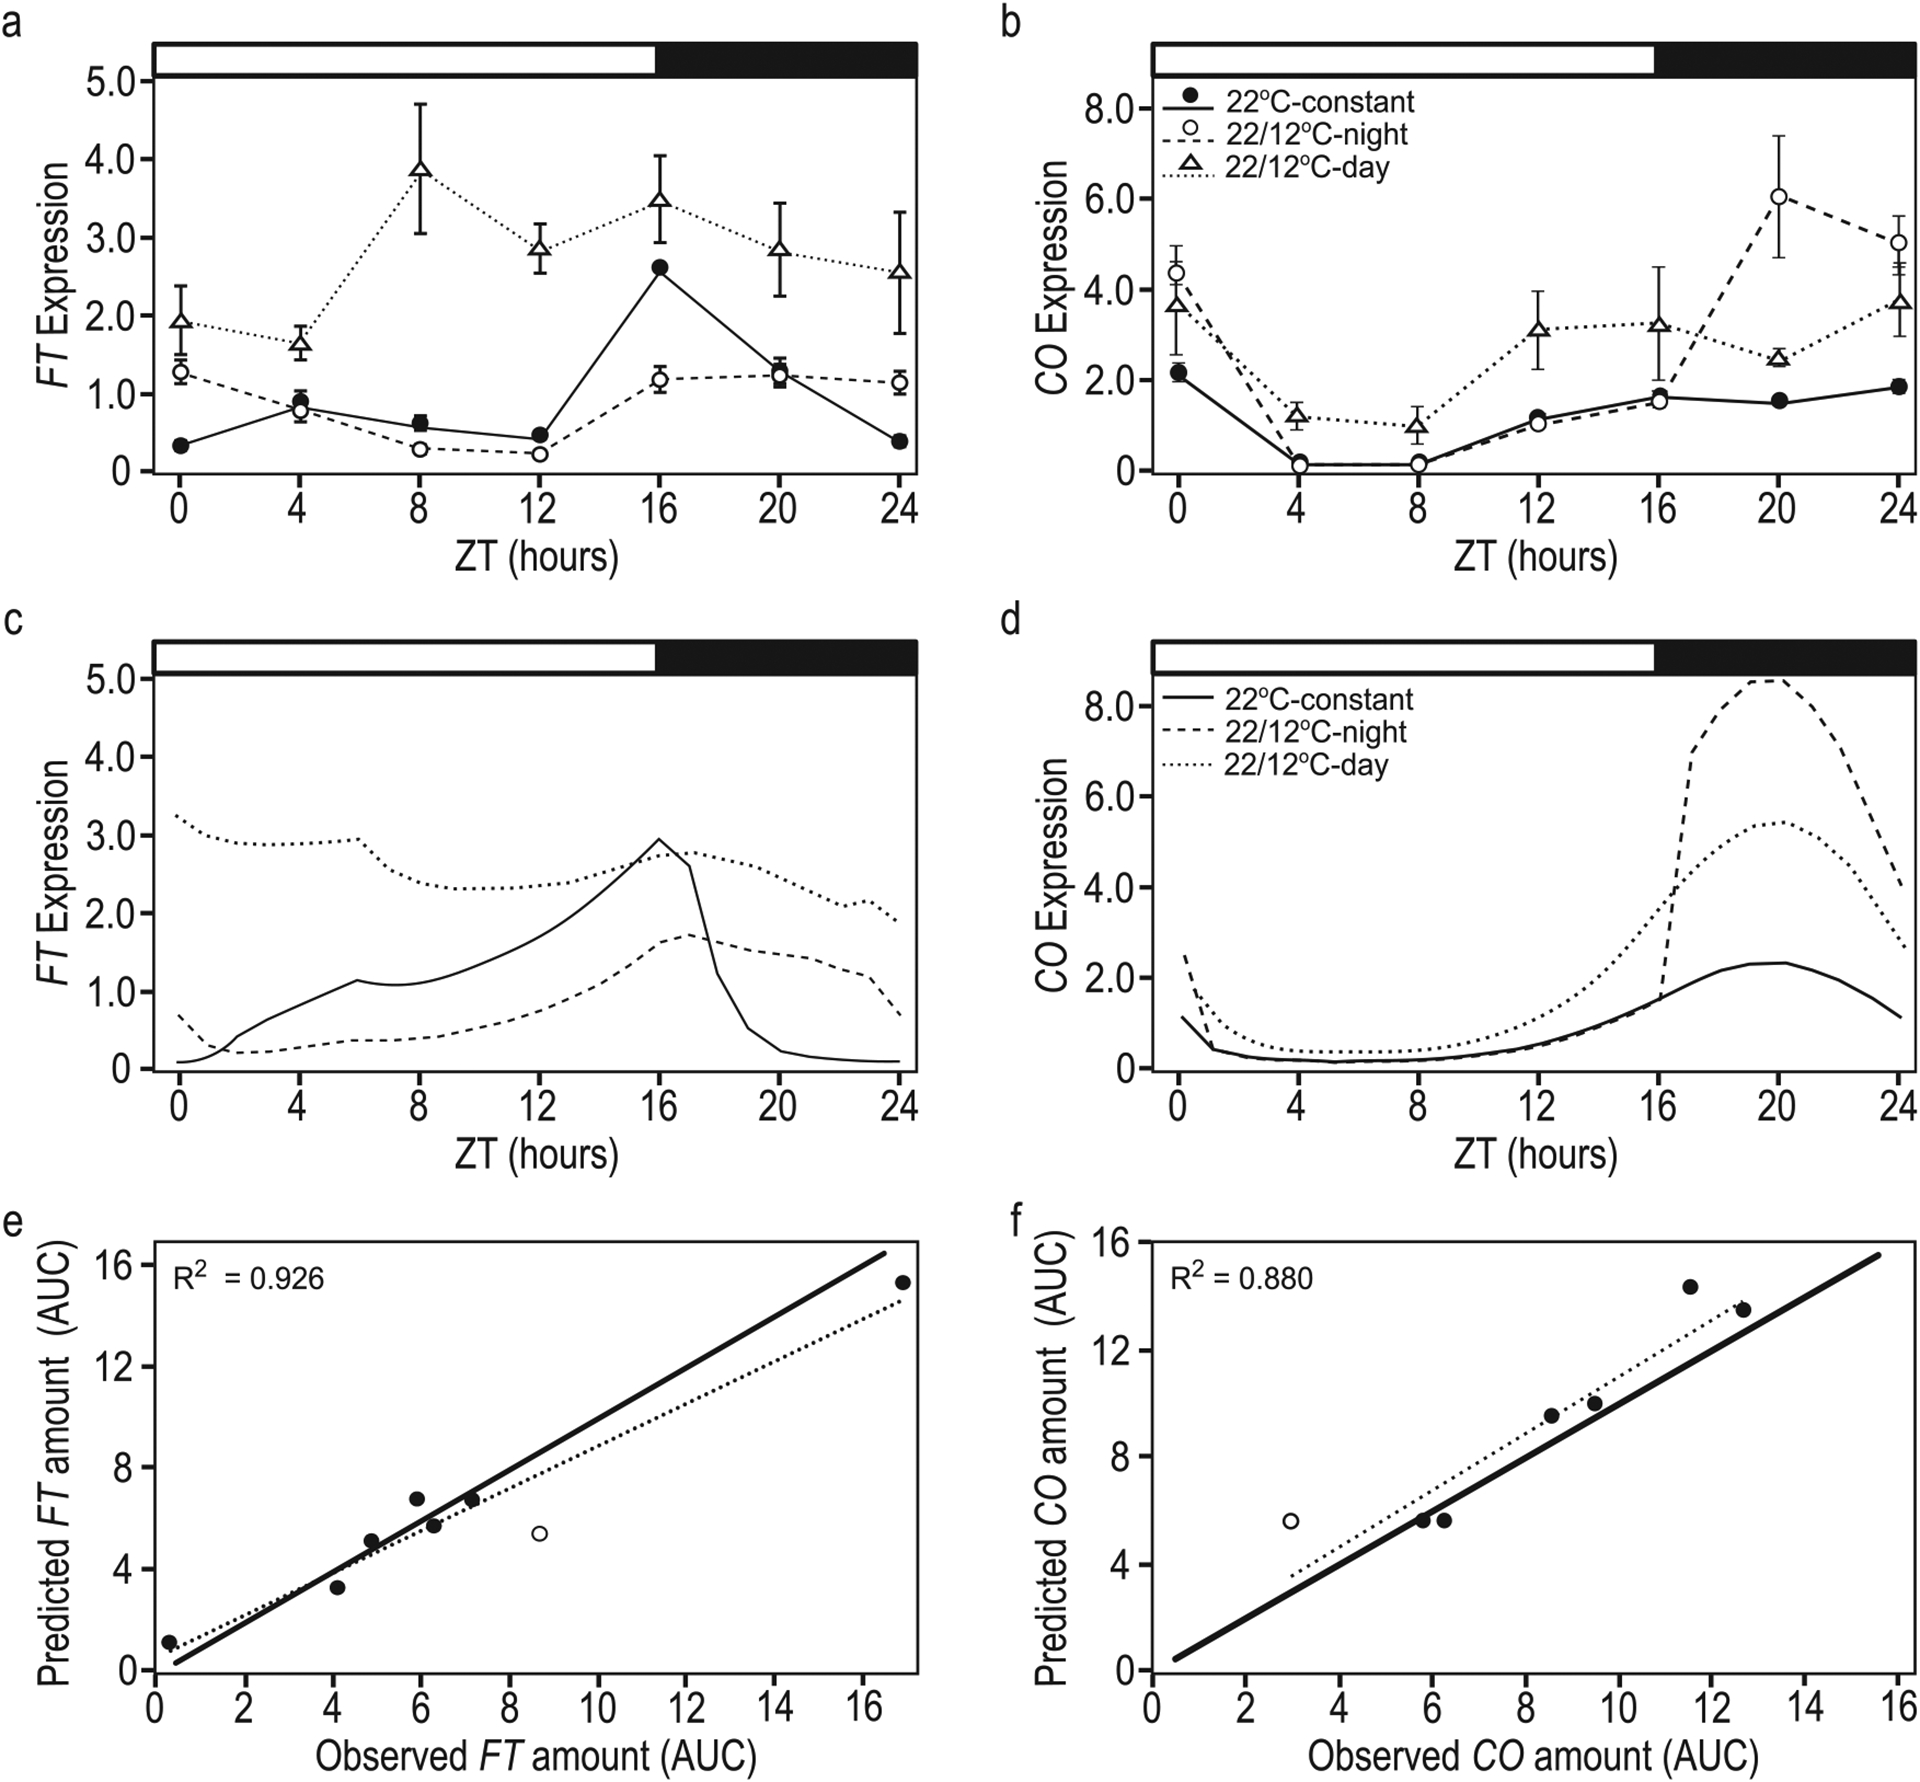
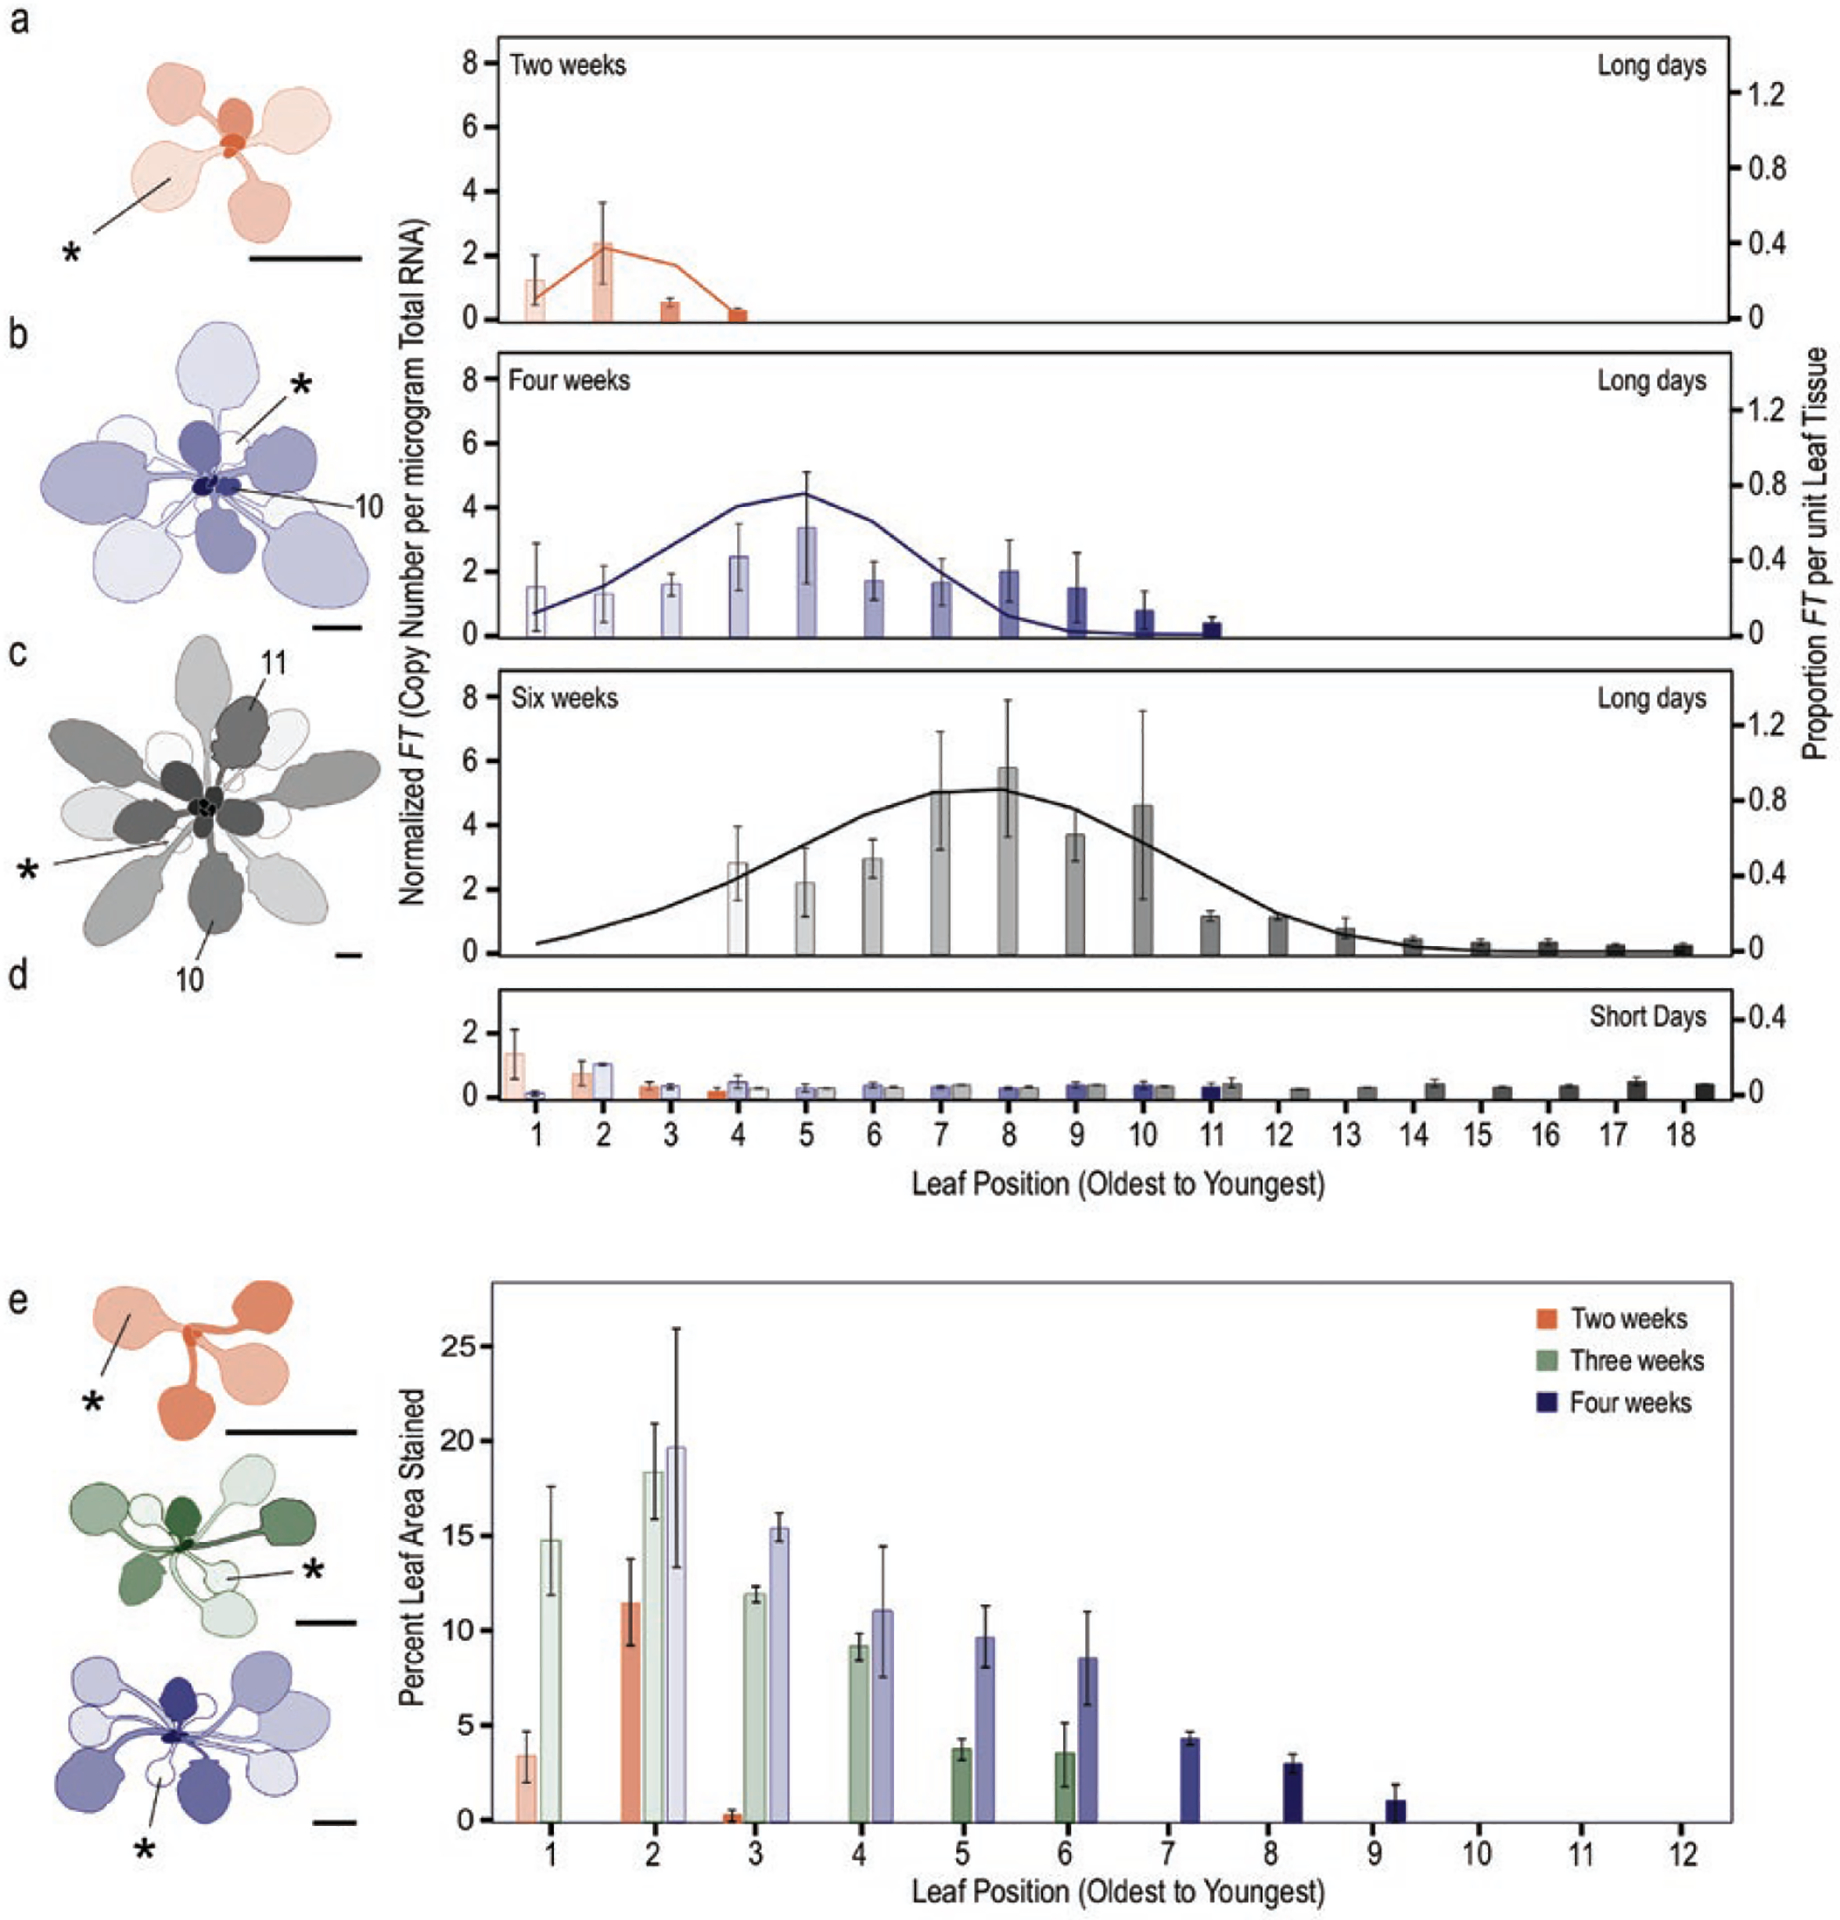
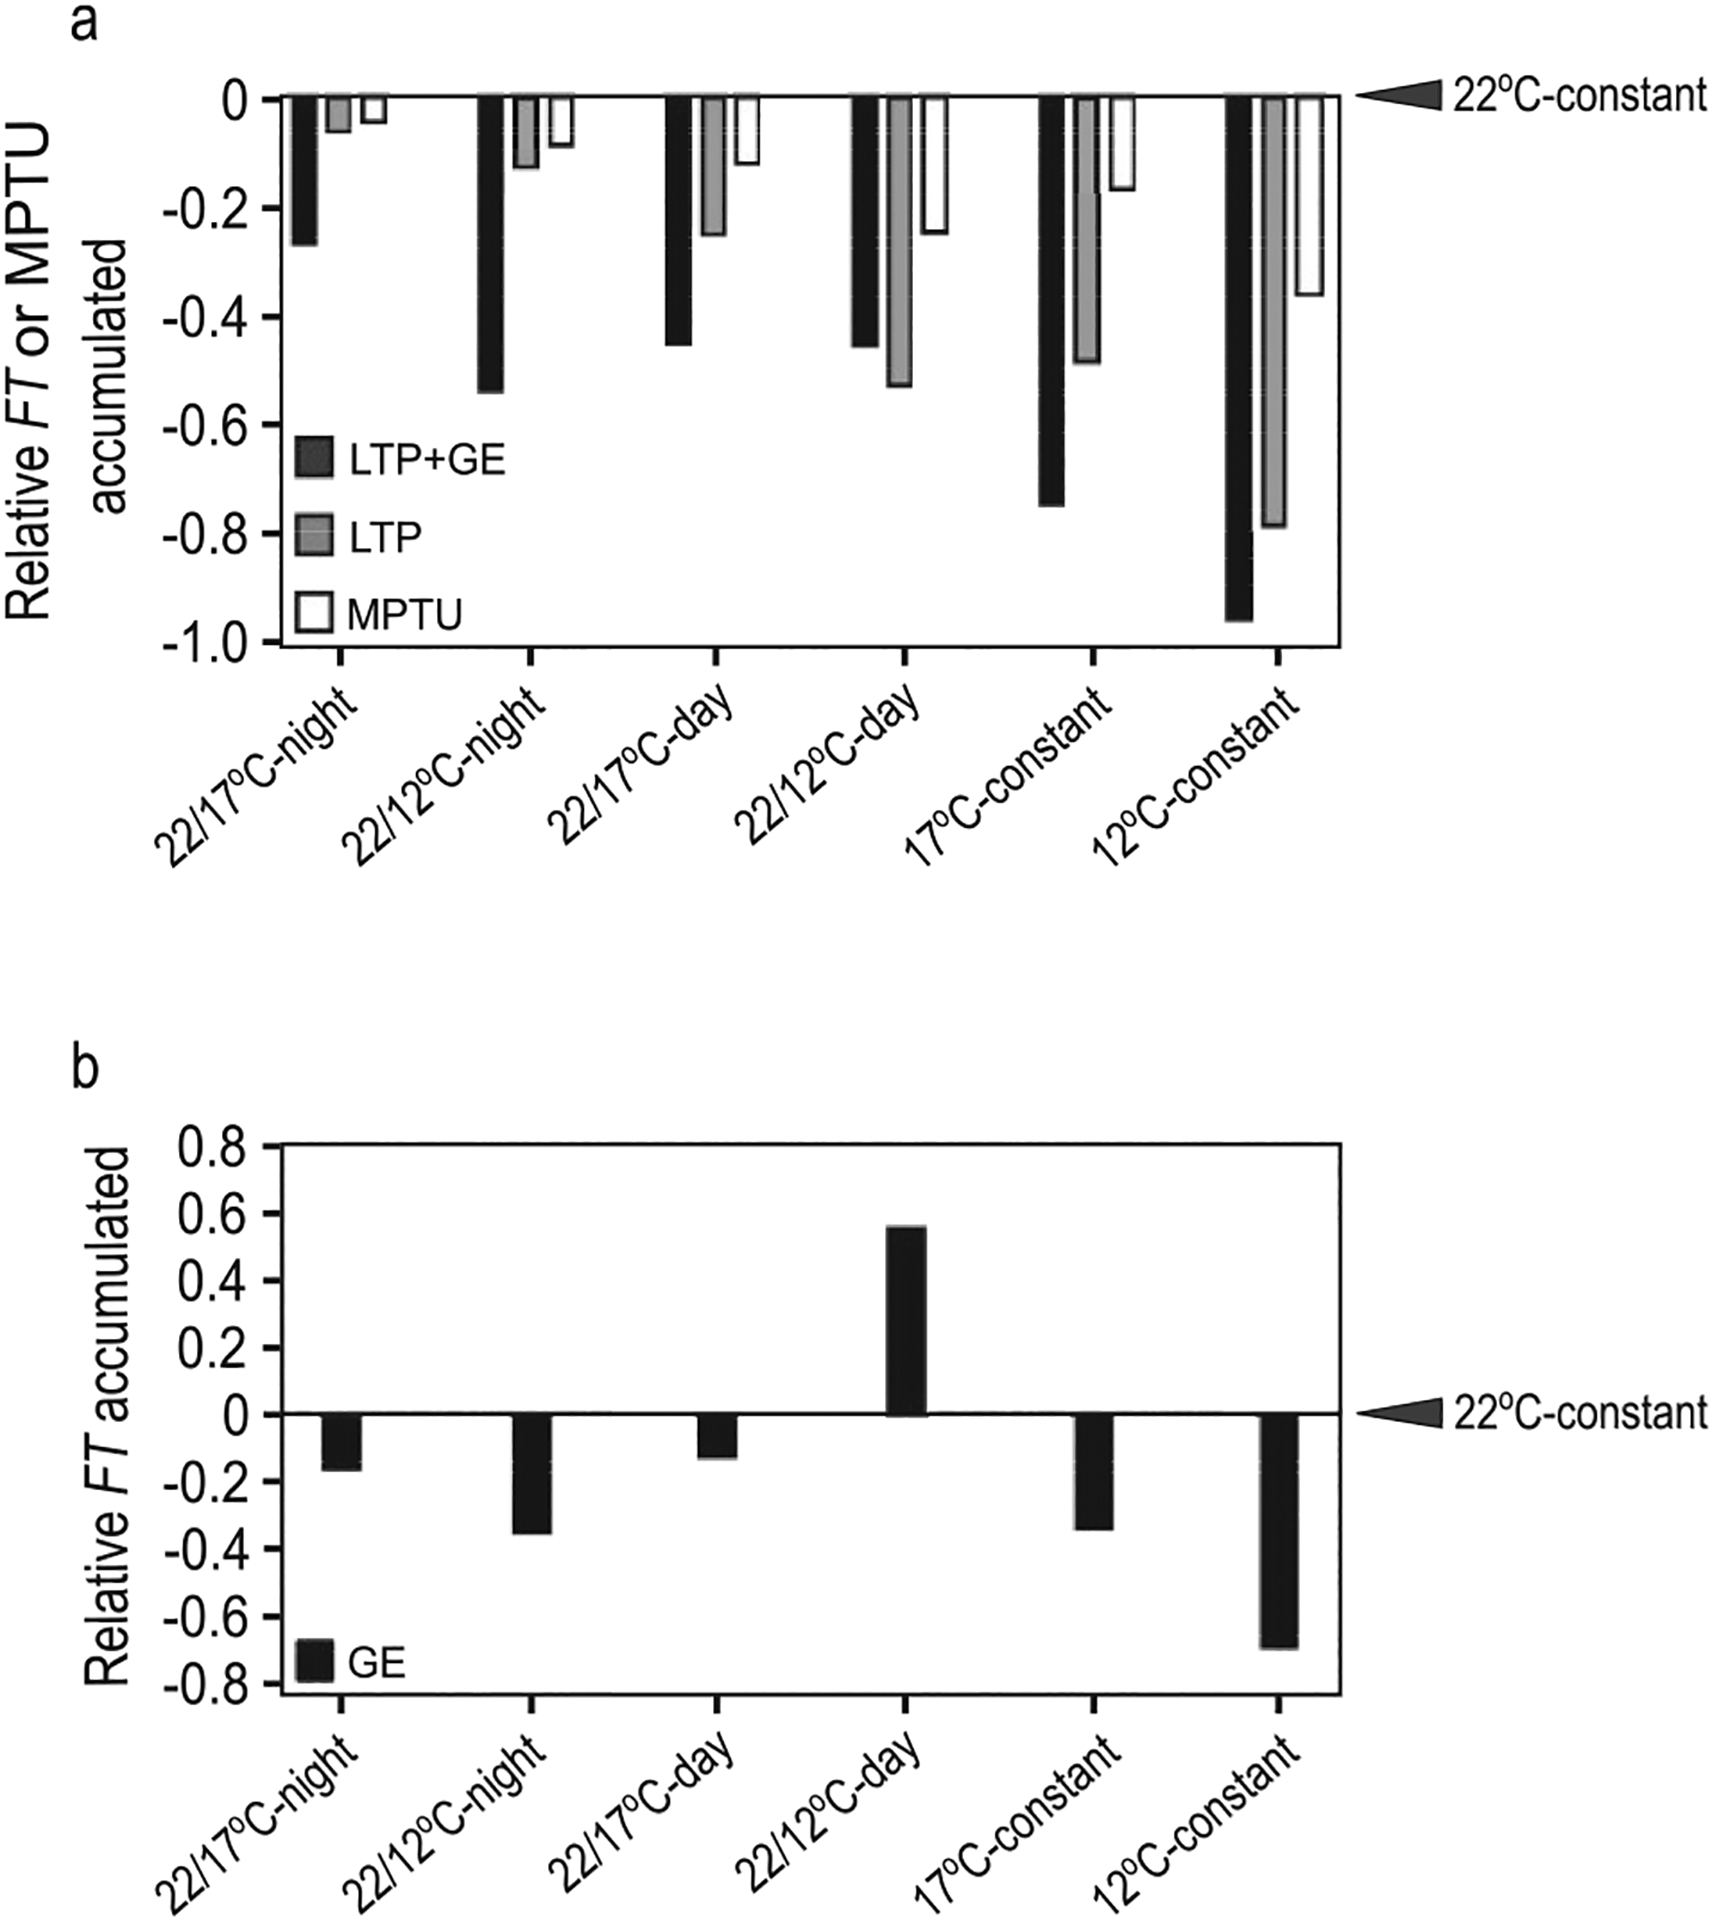
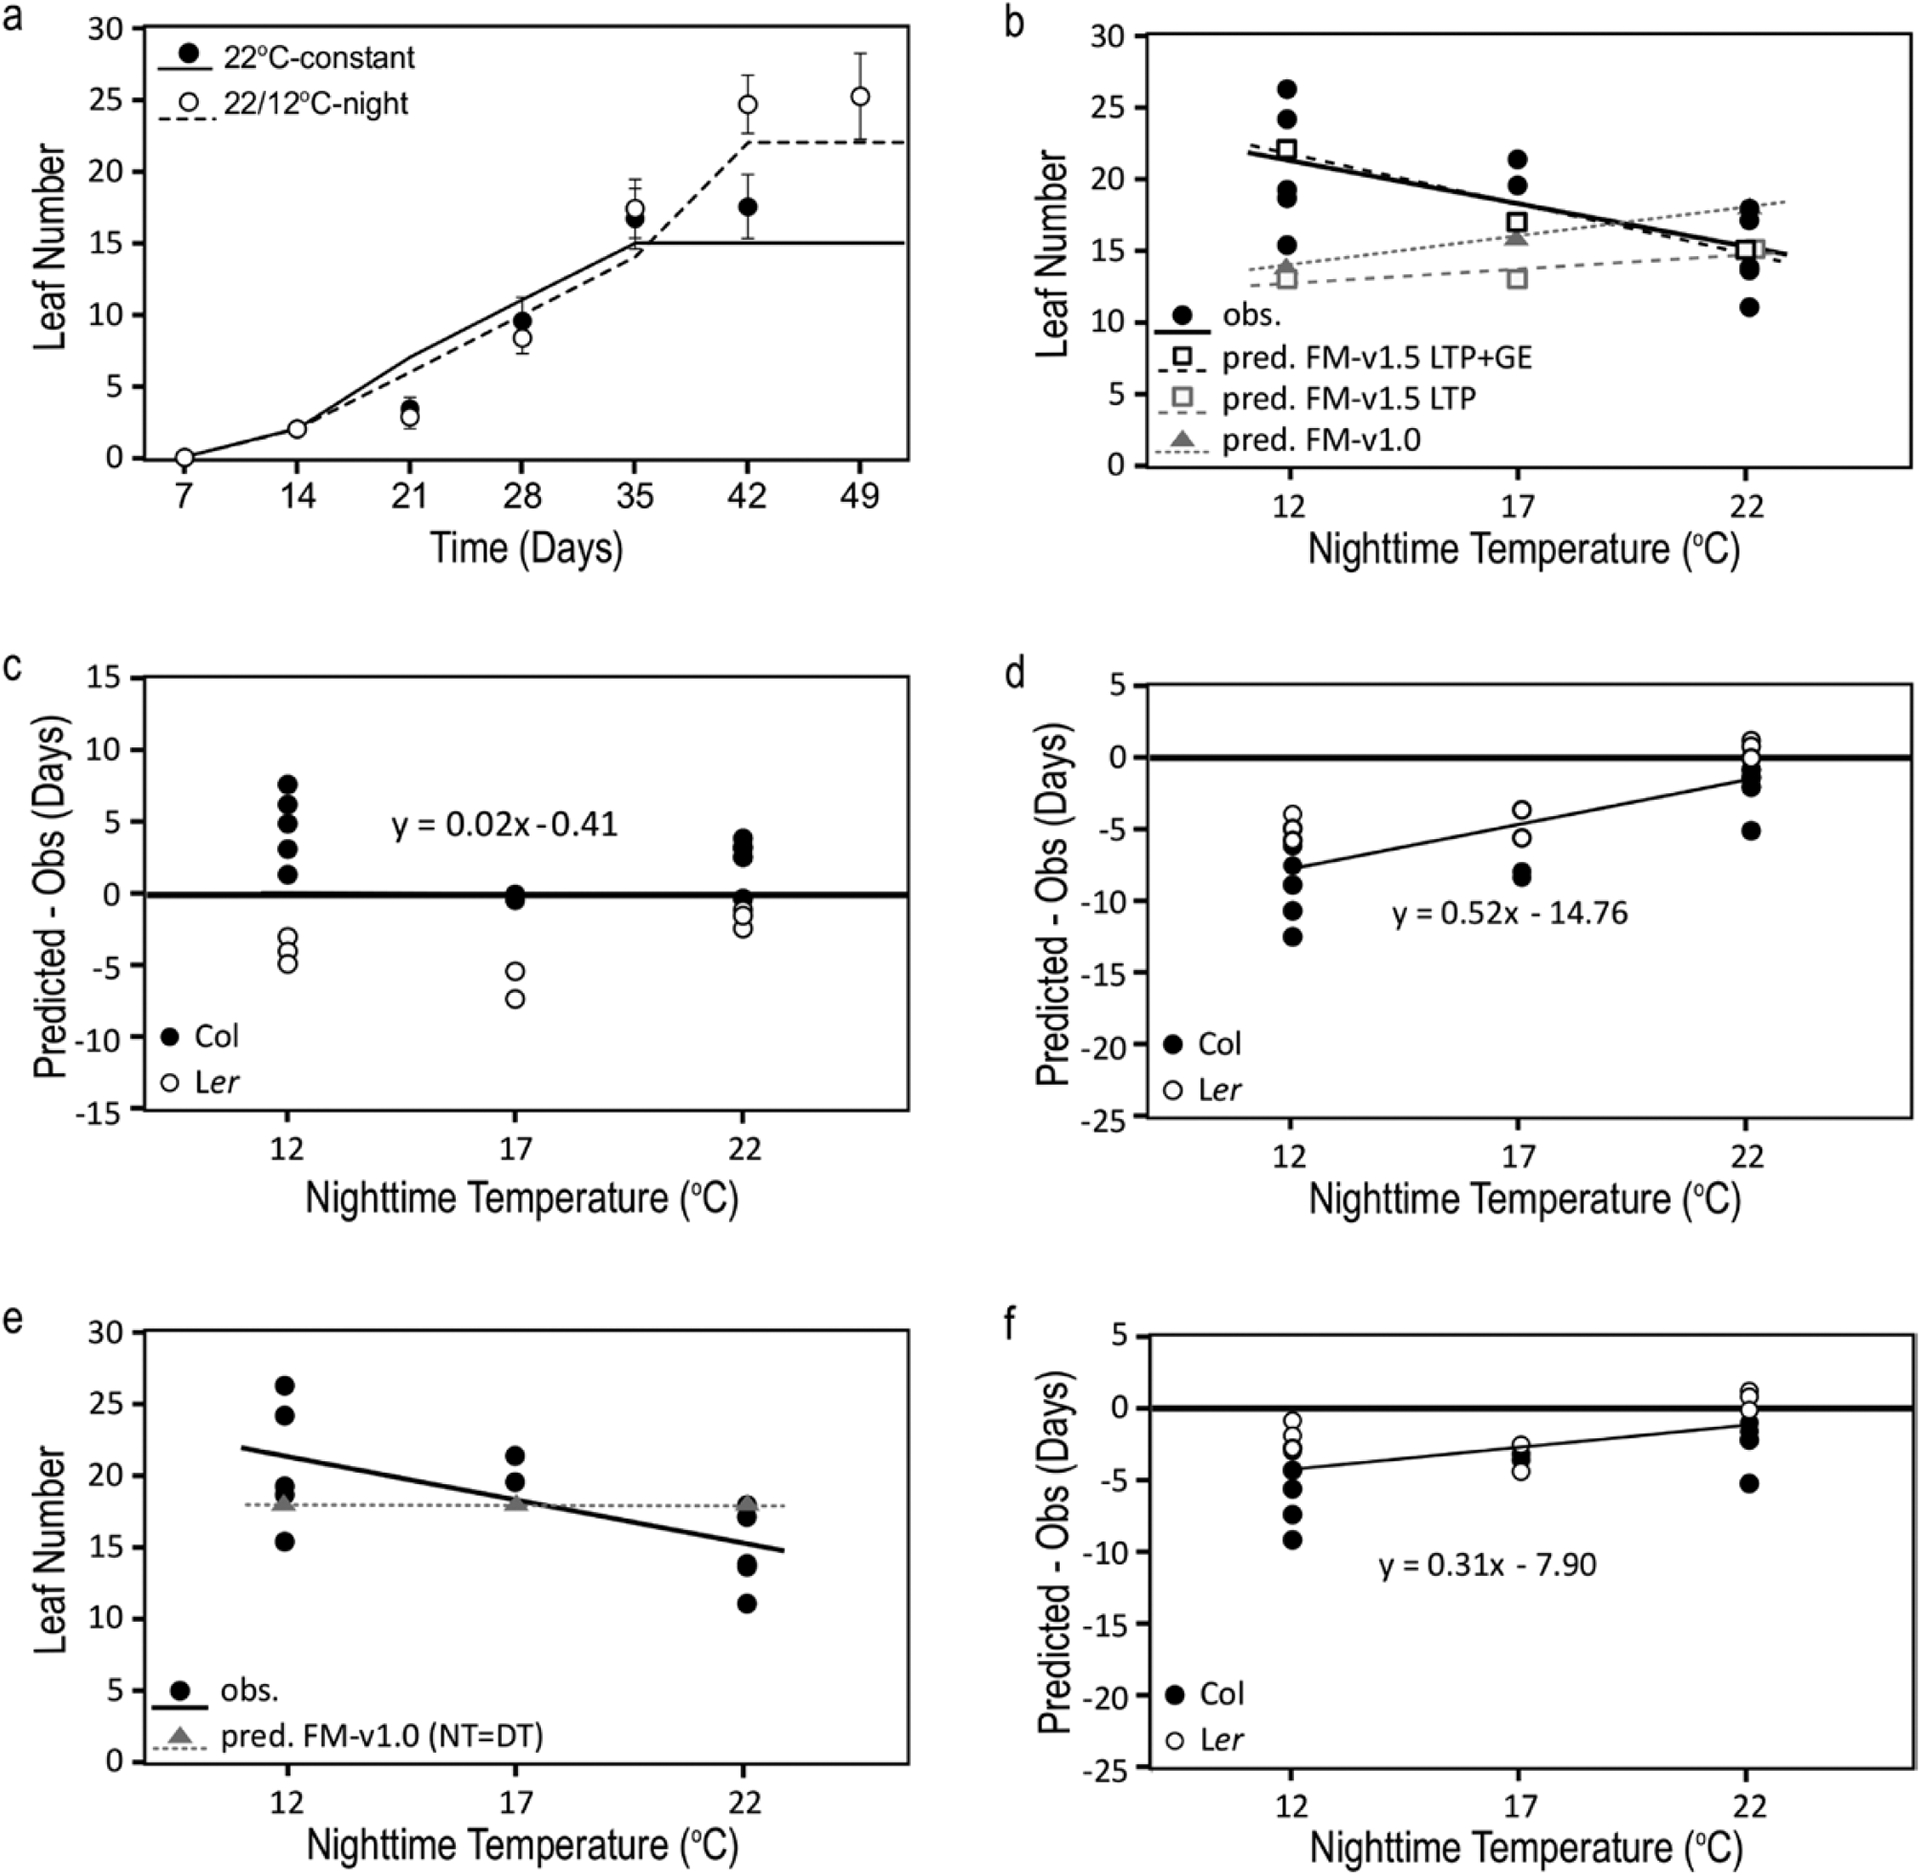
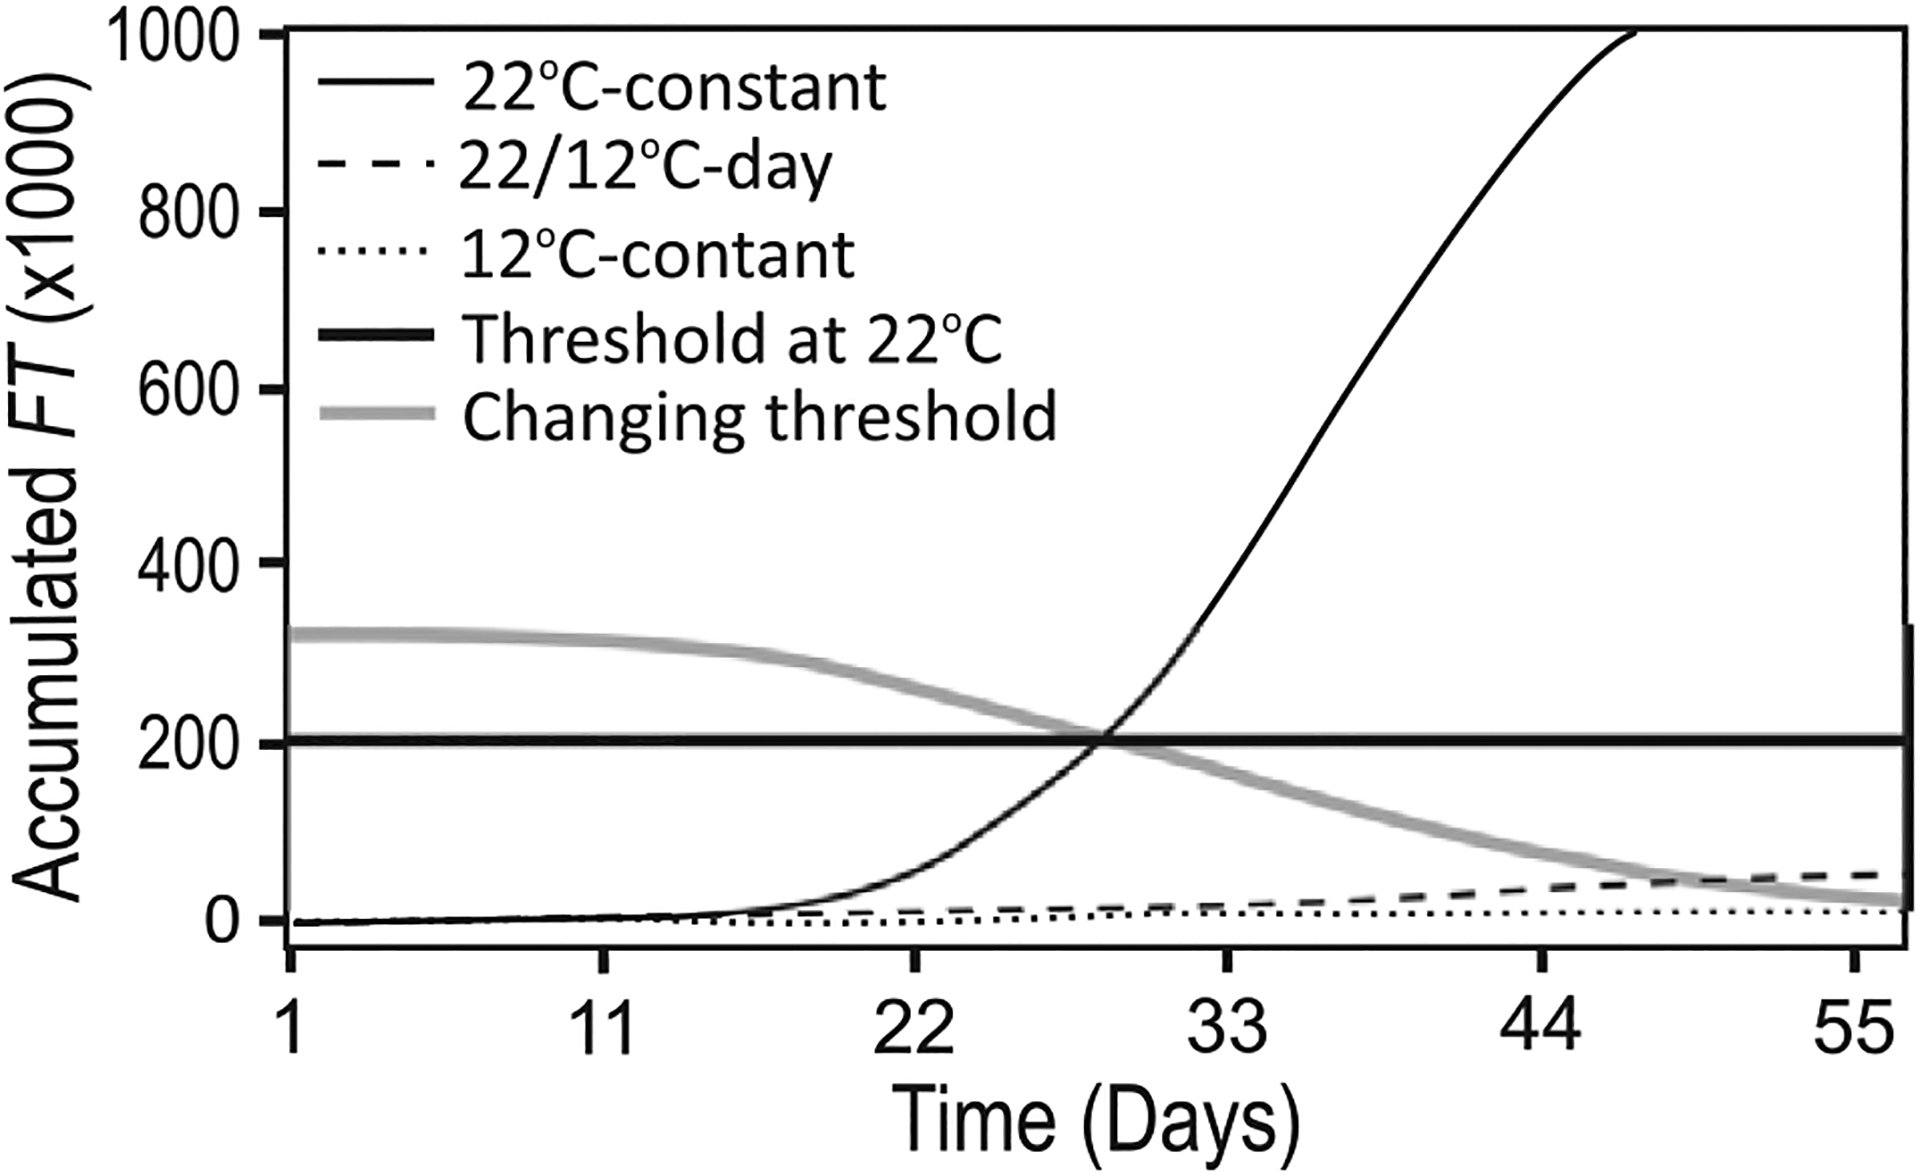
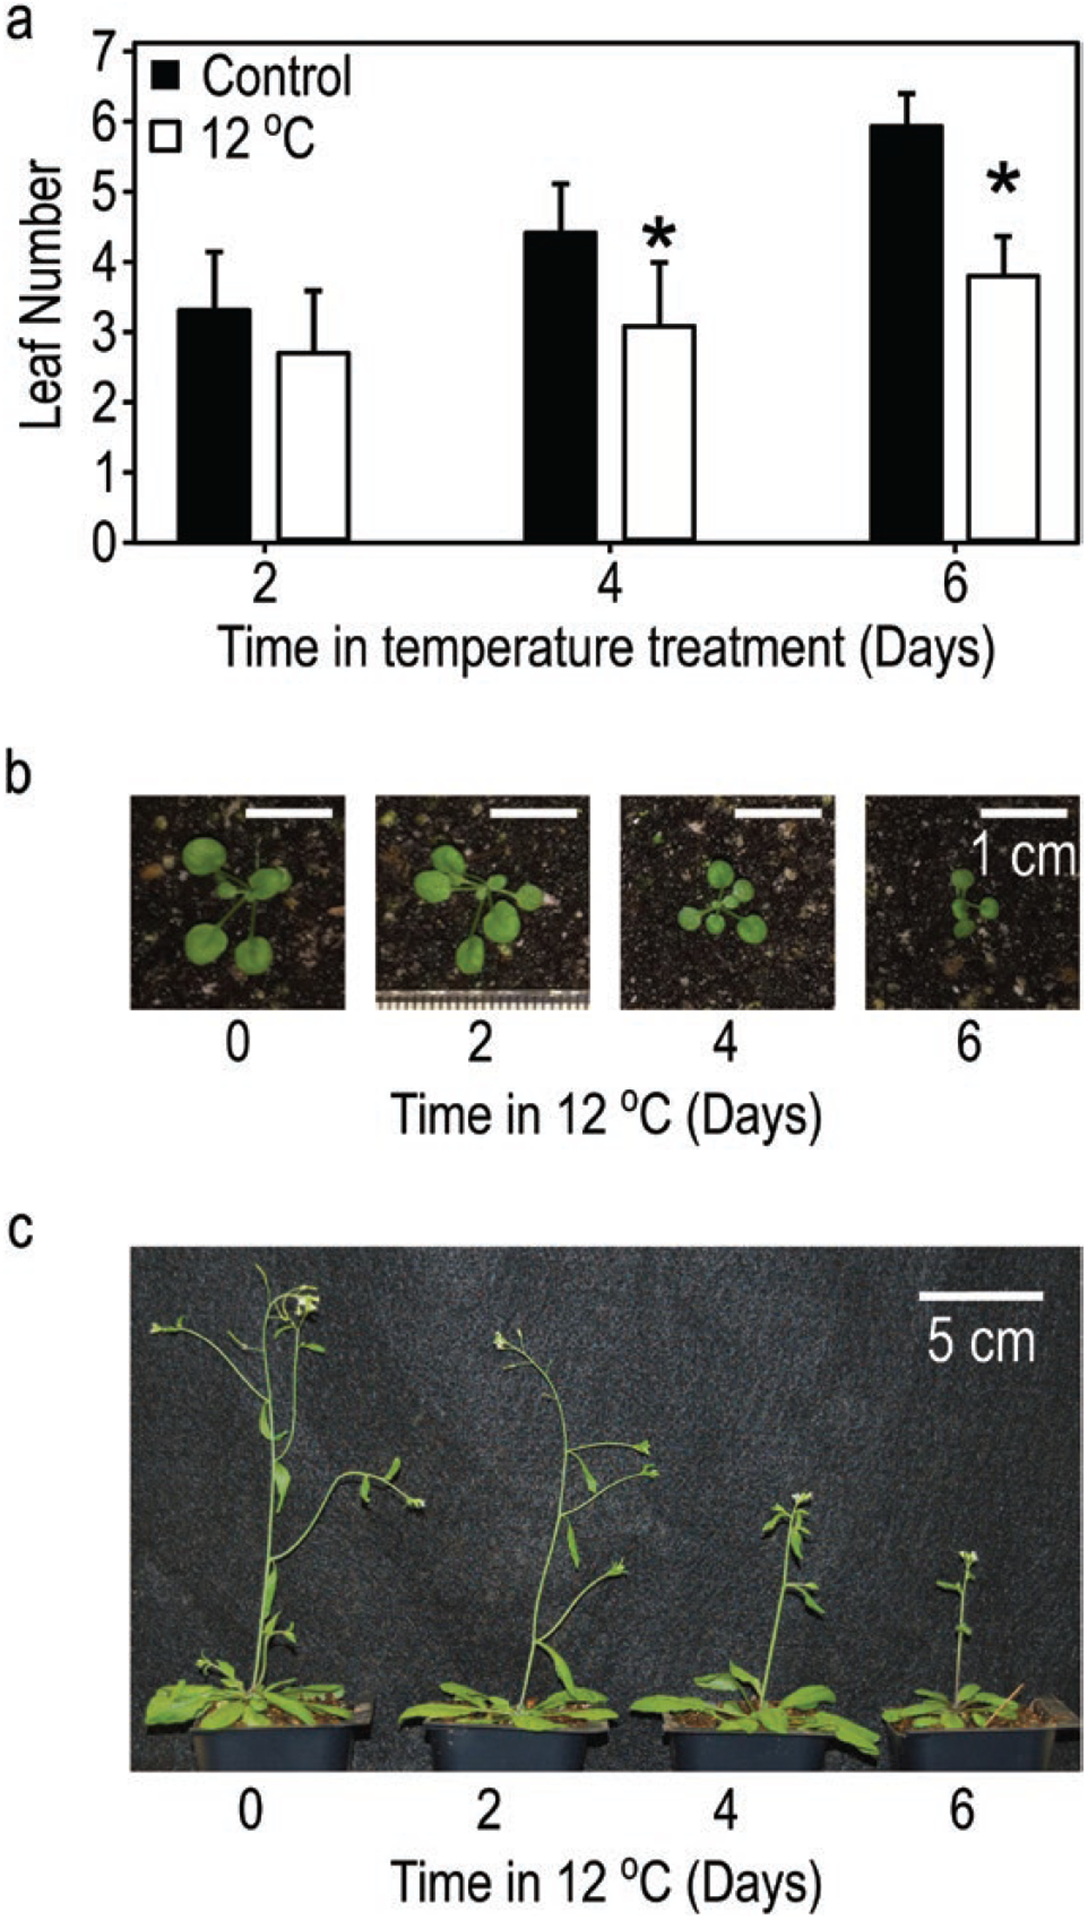
We assessed mechanistic temperature influence on flowering by incorporating temperature-responsive flowering mechanisms across developmental age into an existing model. Temperature influences the leaf production rate as well as expression of FLOWERING LOCUS T (FT), a photoperiodic flowering regulator that is expressed in leaves. The Arabidopsis Framework Model incorporated temperature influence on leaf growth but ignored the consequences of leaf growth on and direct temperature influence of FT expression. We measured FT production in differently aged leaves and modified the model, adding mechanistic temperature influence on FT transcription, and causing whole-plant FT to accumulate with leaf growth. Our simulations suggest that in long days, the developmental stage (leaf number) at which the reproductive transition occurs is influenced by day length and temperature through FT, while temperature influences the rate of leaf production and the time (in days) the transition occurs. Further, we demonstrate that FT is mainly produced in the first 10 leaves in the Columbia (Col-0) accession, and that FT accumulation alone cannot explain flowering in conditions in which flowering is delayed. Our simulations supported our hypotheses that: (i) temperature regulation of FT, accumulated with leaf growth, is a component of thermal time, and (ii) incorporating mechanistic temperature regulation of FT can improve model predictions when temperatures change over time.
Keywords: Arabidopsis; Arabidopsis thaliana; FT; Framework Model; crop simulation model; flowering time; mathematical model; phenology; photoperiodic flowering; thermal time.
Conflict of interest statement
Conflict of Interest None declared.
Figures
Similar articles
-
FE, a phloem-specific Myb-related protein, promotes flowering through transcriptional activation of FLOWERING LOCUS T and FLOWERING LOCUS T INTERACTING PROTEIN 1.Plant J. 2015 Sep;83(6):1059-68. doi: 10.1111/tpj.12951. Plant J. 2015. PMID: 26239308
-
Photoperiodic and thermosensory pathways interact through CONSTANS to promote flowering at high temperature under short days.Plant J. 2016 Jun;86(5):426-40. doi: 10.1111/tpj.13183. Plant J. 2016. PMID: 27117775
-
The flowering integrator FT regulates SEPALLATA3 and FRUITFULL accumulation in Arabidopsis leaves.Plant Cell. 2005 Oct;17(10):2661-75. doi: 10.1105/tpc.105.035766. Epub 2005 Sep 9. Plant Cell. 2005. PMID: 16155177 Free PMC article.
-
Photoperiodic flowering in Arabidopsis: Multilayered regulatory mechanisms of CONSTANS and the florigen FLOWERING LOCUS T.Plant Commun. 2023 May 8;4(3):100552. doi: 10.1016/j.xplc.2023.100552. Epub 2023 Jan 20. Plant Commun. 2023. PMID: 36681863 Free PMC article. Review.
-
Mechanisms of Vernalization-Induced Flowering in Legumes.Int J Mol Sci. 2022 Aug 31;23(17):9889. doi: 10.3390/ijms23179889. Int J Mol Sci. 2022. PMID: 36077286 Free PMC article. Review.
Cited by
-
Developmental Plasticity at High Temperature.Plant Physiol. 2019 Oct;181(2):399-411. doi: 10.1104/pp.19.00652. Epub 2019 Jul 30. Plant Physiol. 2019. PMID: 31363006 Free PMC article. Review.
-
Oligosaccharide production and signaling correlate with delayed flowering in an Arabidopsis genotype grown and selected in high [CO2].PLoS One. 2023 Dec 28;18(12):e0287943. doi: 10.1371/journal.pone.0287943. eCollection 2023. PLoS One. 2023. PMID: 38153952 Free PMC article.
-
Crop photoperiodism model 2.0 for the flowering time of sorghum and rice that includes daily changes in sunrise and sunset times and temperature acclimation.Ann Bot. 2021 Jul 28;128(1):97-113. doi: 10.1093/aob/mcab048. Ann Bot. 2021. PMID: 33821947 Free PMC article.
-
Two Loci, RiAF3 and RiAF4, Contribute to the Annual-Fruiting Trait in Rubus.Front Plant Sci. 2019 Oct 25;10:1341. doi: 10.3389/fpls.2019.01341. eCollection 2019. Front Plant Sci. 2019. PMID: 31708950 Free PMC article.
-
Abundant clock proteins point to missing molecular regulation in the plant circadian clock.Mol Syst Biol. 2025 Apr;21(4):361-389. doi: 10.1038/s44320-025-00086-5. Epub 2025 Feb 20. Mol Syst Biol. 2025. PMID: 39979593 Free PMC article.
References
-
- Abe M, Kobayashi Y, Yamamoto S, Daimon Y, Yamaguchi A, Ikeda Y, Ichinoki H, Notaguchi M, Goto K, Araki T. 2005. FD, a bZIP protein mediating signals from the floral pathway integrator FT at the shoot apex. Science 309:1052–1056. - PubMed
-
- Amasino R 2010. Seasonal and developmental timing of flowering. The Plant Journal 61:1001–1013. - PubMed
-
- Asseng S, Ewert F, Rosenzweig C, Jones JW, Hatfield JL, Ruane AC, Boote KJ, Thorburn PJ, Rötter RP, Cammarano D, Brisson N, Basso B, Martre P, Aggarwal PK, Angulo C, Bertuzzi P, Biernath C, Challinor AJ, Doltra J, Gayler S, Goldberg R, Grant R, Heng L, Hooker J, Hunt LA, Ingwersen J, Izaurralde RC, Kersebaum KC, Müller C, Naresh Kumar S, Nendel C, O’Leary G, Olesen JE, Osborne TM, Palosuo T, Priesack E, Ripoche D, Semenov MA, Shcherbak I, Steduto P, Stöckle C, Stratonovitch P, Streck T, Supit I, Tao F, Travasso M, Waha K, Wallach D, White JW, Williams JR, Wolf J. 2013. Uncertainty in simulating wheat yields under climate change. Nature Climate Change 3:827–832.
-
- Blázquez MA, Ahn JH, Weigel D. 2003. A thermosensory pathway controlling flowering time in Arabidopsis thaliana. Nature Genetics 33:168–171. - PubMed
-
- Boote KJ, Jones JW, White JW, Asseng S, Lizaso JI. 2013. Putting mechanisms into crop production models. Plant, Cell & Environment 36:1658–1672. - PubMed
Grants and funding
LinkOut - more resources
Full Text Sources
Molecular Biology Databases