[Preprint]. 2022 Sep 30:2022.09.30.509852.
doi: 10.1101/2022.09.30.509852.

Maturation of SARS-CoV-2 Spike-specific memory B cells drives resilience to viral escape

Affiliations

Maturation of SARS-CoV-2 Spike-specific memory B cells drives resilience to viral escape

Roberta Marzi et al. bioRxiv. .

Update in

  • Maturation of SARS-CoV-2 Spike-specific memory B cells drives resilience to viral escape.
    Marzi R, Bassi J, Silacci-Fregni C, Bartha I, Muoio F, Culap K, Sprugasci N, Lombardo G, Saliba C, Cameroni E, Cassotta A, Low JS, Walls AC, McCallum M, Tortorici MA, Bowen JE, Dellota EA Jr, Dillen JR, Czudnochowski N, Pertusini L, Terrot T, Lepori V, Tarkowski M, Riva A, Biggiogero M, Franzetti-Pellanda A, Garzoni C, Ferrari P, Ceschi A, Giannini O, Havenar-Daughton C, Telenti A, Arvin A, Virgin HW, Sallusto F, Veesler D, Lanzavecchia A, Corti D, Piccoli L. Marzi R, et al. iScience. 2023 Jan 20;26(1):105726. doi: 10.1016/j.isci.2022.105726. Epub 2022 Dec 5. iScience. 2023. PMID: 36507220 Free PMC article.

Abstract

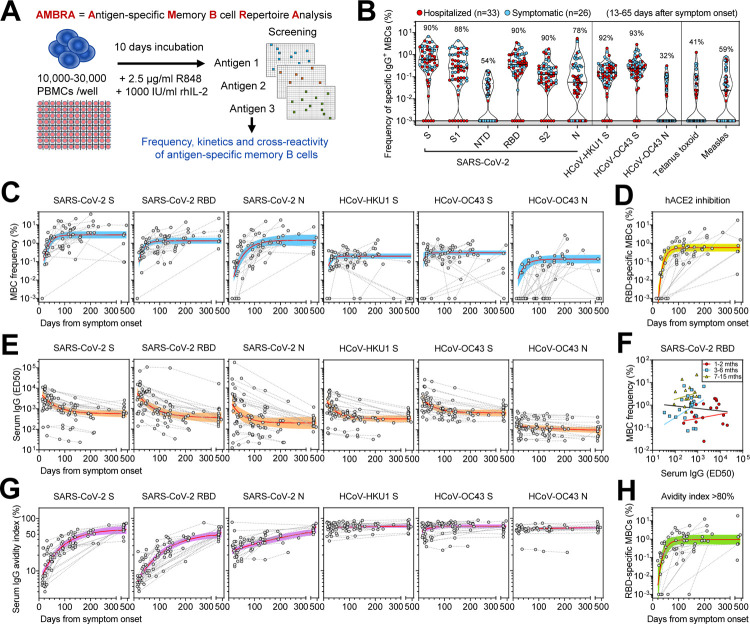
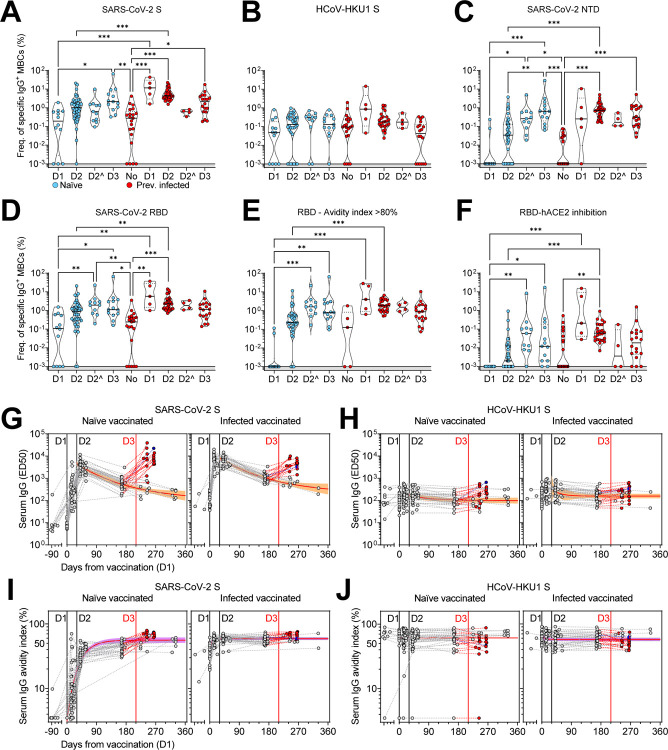
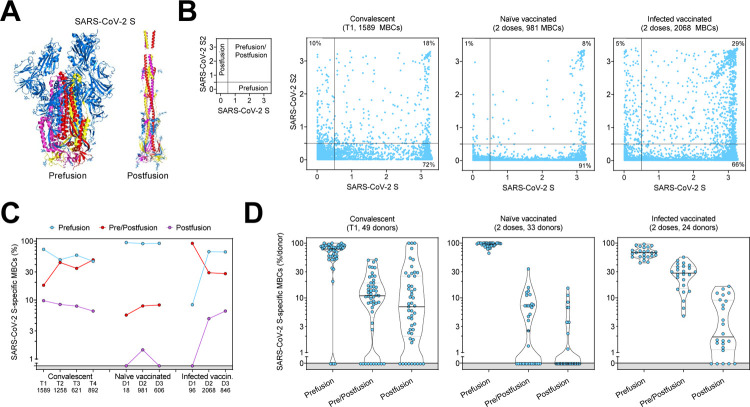
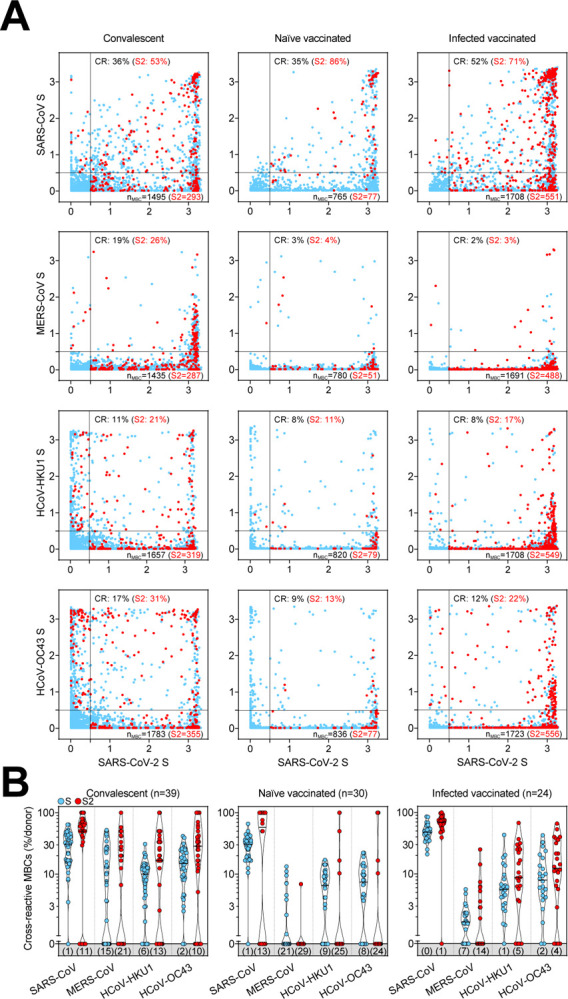
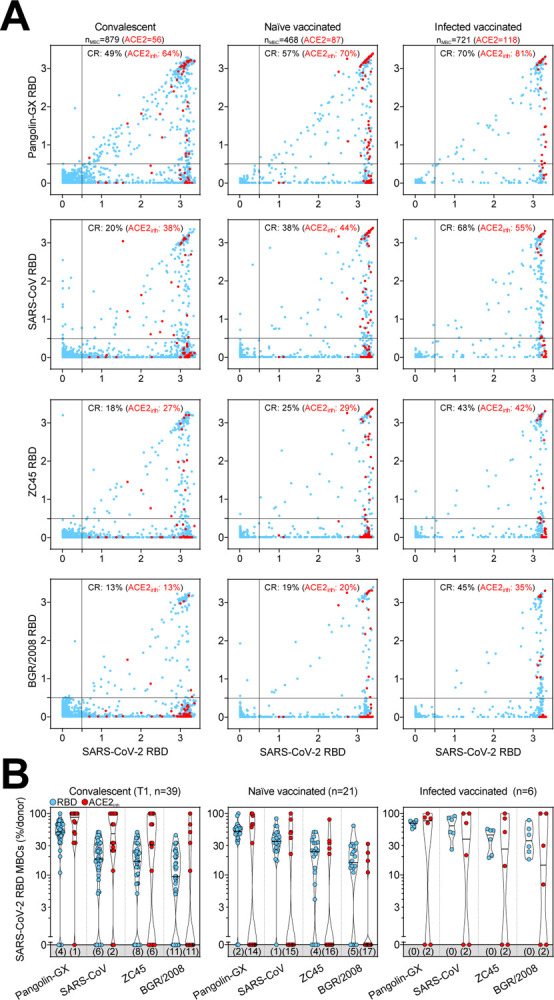
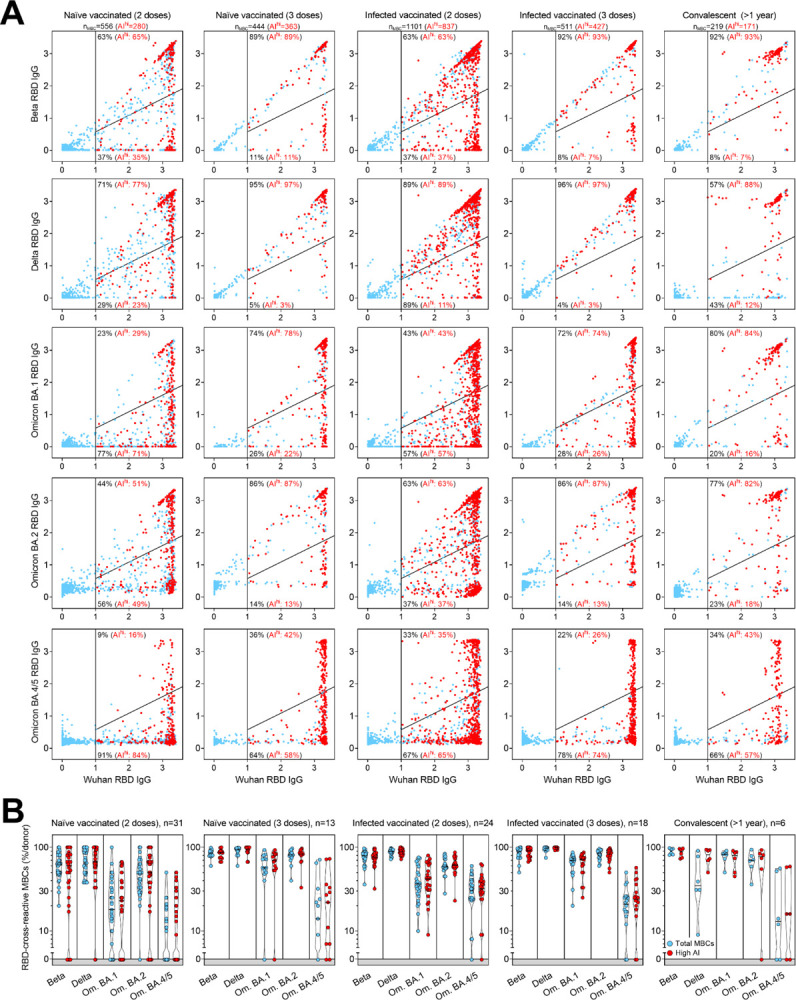
Memory B cells (MBCs) generate rapid antibody responses upon secondary encounter with a pathogen. Here, we investigated the kinetics, avidity and cross-reactivity of serum antibodies and MBCs in 155 SARS-CoV-2 infected and vaccinated individuals over a 16-month timeframe. SARS-CoV-2-specific MBCs and serum antibodies reached steady-state titers with comparable kinetics in infected and vaccinated individuals. Whereas MBCs of infected individuals targeted both pre- and postfusion Spike (S), most vaccine-elicited MBCs were specific for prefusion S, consistent with the use of prefusion-stabilized S in mRNA vaccines. Furthermore, a large fraction of MBCs recognizing postfusion S cross-reacted with human betacoronaviruses. The avidity of MBC-derived and serum antibodies increased over time resulting in enhanced resilience to viral escape by SARS-CoV-2 variants, including Omicron BA.1 and BA.2 sub-lineages, albeit only partially for BA.4 and BA.5 sublineages. Overall, the maturation of high-affinity and broadly-reactive MBCs provides the basis for effective recall responses to future SARS-CoV-2 variants.


Figures

Figure 1.
Figure 1.. Early response, RBD immunodominance, kinetics and affinity maturation of memory B cells primed by Wuhan SARS-CoV-2
(A) Scheme of the AMBRA method used in this study. PBMC, peripheral blood mononuclear cells. R848, agonist of Toll-like receptors 7 and 8. rhIL2, recombinant human interleukin 2. (B) Frequency of SARS-CoV-2-specific MBCs isolated between 13 and 65 days after symptom onset from n = 59 donors (33 hospitalized, red, and 26 symptomatic, blue) after the analysis of 5,664 MBC cultures. Shown is the reactivity to antigens of SARS-CoV-2 and other betacoronaviruses (HCoV-HKU1 and HCoV-OC43): Spike (S), S1 domain, N-terminal domain (NTD), receptor-binding domain (RBD), S2 domain, Nucleoprotein (N). Reactivities to Tetanus toxoid and to Measles virus (lysate) are included as controls. Median and quartiles are shown as plain and dotted lines, respectively. Percentages of donors with detectable specific MBCs are indicated above each set of data. (C) Frequency of MBCs specific for SARS-CoV-2 S, RBD and N, HCoV-HKU1 S, HCoV-OC43 S and N from n = 23 donors followed-up up to 469 days after symptom onset. Frequencies were obtained from the analysis of 6,336 MBC cultures (66 samples, minimum 2 samples per donor). Black dotted lines connect samples from the same donor. A one-phase association kinetics model (red line) was calculated from all the non-null values of each sample. The area within 95% confidence bands is shown in blue. (D) Frequency of SARS-CoV-2 RBD-specific MBC producing antibodies showing inhibition of RBD binding to ACE2 from n = 23 donors. A one-phase association kinetics model (red line) was calculated from all the non-null values of each sample and the area within 95% confidence bands is shown in yellow. (E) Serum IgG ED50 titers to SARS-CoV-2 S, RBD and N, HCoV-HKU1 S, HCoV-OC43 S and N of samples collected from 29 donors analyzed up to 469 days after symptom onset. A one-phase decay kinetics model (red line) was calculated from all the non-null values of each sample and the area within 95% confidence bands is shown in orange. (F) Correlation analysis between frequency of SARS-CoV-2 RBD-specific MBCs and serum RBD-specific IgG titers of n = 56 samples from n = 18 donors collected at different time points. All samples (black line): Spearman r = −0.102 (95% confidence interval −0.363 to 0.173; non-significant P = 0.45). Samples at 1–2 months (n = 18, red line): Spearman r = 0.112 (95% confidence interval −0.387 to 0.561; non-significant P = 0.66). Samples at 3–6 months (n = 23, blue line): Spearman r = 0.214 (95% confidence interval −0.229 to 0.584; non-significant P = 0.33). Samples at 7–15 months (n = 15, yellow line): Spearman r = 0.221 (95% confidence interval −0.343 to 0.668; non-significant P = 0.43). (G) Serum IgG avidity indexes to SARS-CoV-2 S, RBD and N, HCoV-HKU1 S, HCoV-OC43 S and N of samples collected from 29 donors analyzed up to 469 days after symptom onset. A one-phase association kinetics model (red line) was calculated from all the non-null values of each sample and the area within 95% confidence bands is shown in violet. (H) Frequency of SARS-CoV-2 RBD-specific B cells with an avidity index greater than 80%. A one-phase association kinetics model (red line) was calculated from all the non-null values of each sample and the area within 95% confidence bands is shown in green.
Figure 2.
Figure 2.. Characterization of vaccine-induced MBC- and serum-derived antibody response in naïve and SARS-CoV-2 immune donors
(A-D) Frequency of MBCs specific for SARS-CoV-2 S (A), HCoV-HKU1 S (B), SARS-CoV-2 NTD (C) and RBD (D) of n = 12, 45 and 13 naïve donors and 5, 31, and 18 previously infected donors 10–35 days after the first (D1), the second (D2) and the third dose (D3) of Pfizer/BioNtech BNT162b2 mRNA vaccine, respectively. Shown are also 11 naïve and 4 immune donors whose MBCs were isolated 125–293 days after the second dose (D2^). Median frequencies are compared withing donor groups and between respective vaccine doses as well as to a group of n = 21 convalescent donors at 18–30 days after symptom onset. Significant differences are indicated as *** (p-value < 0.001); ** (p < 0.002), * (p < 0.033), ns (non-significant, p > 0.12). (E) Frequency of SARS-CoV-2 RBD-specific MBCs with an avidity index greater than 80%. (F) Frequency of SARS-CoV-2 RBD-specific MBCs inhibiting binding of RBD to ACE2. (G-H) Serum IgG ED50 titers to SARS-CoV-2 S (G) and HCoV-HKU1 S (H) of samples collected from n = 47 naïve (left) and 32 immune donors (right) 10–35 days after the first (D1), the second (D2) and the third dose (D3) of Pfizer/BioNtech BNT162b2 mRNA vaccine, respectively. A one-phase decay kinetics model (red line) was calculated from all the non-null values of each sample and the area within 95% confidence bands is shown in orange. 37 samples collected from individuals who received a third dose (red) or had a second SARS-CoV-2 infection (blue) were excluded from the decay analysis. (I-J) Serum IgG avidity indexes to SARS-CoV-2 S (I) and HCoV-HKU1 S (J) of the same samples shown in panels G-H. A one-phase association kinetics model (red line) was calculated from all the non-null values of each sample and the area within 95% confidence bands is shown in violet.
Figure 3.
Figure 3.. Comparison of the prefusion and postfusion S-specific MBC responses after vaccination or natural infection
(A) Structural representation of SARS-CoV-2 S in its prefusion and postfusion conformation (adapted from PBD 7tat and 7e9t). The three S2 domains that are maintained in both conformations are colored in red, yellow and pink. (B) MBC cross-reactivity between SARS-CoV-2 S (prefusion S) and S2 (postfusion S). Shown are average OD values as measured by ELISA with blank subtracted from n = 2 replicates of 1589, 981 and 2068 MBC cultures analyzed from 49 convalescent, 33 naïve and 24 infected vaccinated donors. Cumulative fraction of MBCs reactive to either prefusion or postfusion S or both is indicated as percentage in the respective quadrant. The small panel on the left describes the distribution of prefusion and/or postfusion S-specific MBCs in the different quadrants. (C) Cumulative fraction of S-specific MBCs reactive to prefusion and/or postfusion S at different timepoints after natural infection (T1, T2, T3 and T4) or vaccine doses (D1, D2, D3). (D) Individual fractions of S-specific MBCs reactive to prefusion and/or postfusion S in 49 convalescent, 33 naïve and 24 infected vaccinated donors.
Figure 4.
Figure 4.. Cross-reactivity to betacoronaviruses of MBCs primed by SARS-CoV-2 infection and/or vaccination
(A) Cumulative MBC cross-reactivity between SARS-CoV-2 S and the four betacoronaviruses SARS-CoV, MERS-CoV, HCoV-HKU1 and HCoV-OC43. Shown are average OD values as measured by ELISA with blank subtracted from n = 2 replicates of 3744, 2880 and 2304 MBC cultures analyzed from 39 convalescent, 30 naïve and 24 infected donors after two vaccine doses. S2-specific MBCs are shown in red. Numbers of S- and S2-specific MBCs are indicated in the bottom-right quadrants of each panel. Cumulative fractions of S- and S2-cross-reactive (CR) MBCs are indicated as percentage in the top-right quadrant. (B) Individual fractions of SARS-CoV-2 S-specific MBCs that cross-react with the four betacoronaviruses in convalescent and vaccinated donors. Numbers in brackets indicate the donors with MBCs showing no cross-reactivity for the respective betacoronavirus S.
Figure 5.
Figure 5.. Cross-reactivity to sarbecoviruses of MBCs primed by SARS-CoV-2 infection and/or vaccination
(A) Cumulative MBC cross-reactivity between SARS-CoV-2 RBD and four sarbecoviruses representative of clades 1a (SARS-CoV), 1b (Pangolin Guangxi), 2 (ZC45) and 3 (BM48–31/BGR/2008). Shown are average OD values as measured by ELISA with blank subtracted from n = 2 replicates of 3744, 2016 and 576 MBC cultures analyzed from 39 convalescent donors at two different timepoints and from 21 naïve and 6 infected donors after receiving two vaccine doses. RBD-specific MBCs showing inhibition of binding to ACE2 are shown in red. Cumulative fractions of total and ACE2-inhibiting RBD-cross-reactive (CR) MBCs are indicated as percentage in the top-right quadrant. (B) Individual fractions of SARS-CoV-2 RBD-specific MBCs that cross-react with the four representative sarbecoviruses in convalescent and vaccinated donors. Numbers in brackets indicate the donors with MBCs showing no cross-reactivity for the respective sarbecovirus RBD.
Figure 6.
Figure 6.. Resilience to viral escape of VOC by high-avidity MBCs primed by SARS-CoV-2 infection and/or vaccination
(A) Cumulative MBC cross-reactivity between RBD from Wuhan SARS-CoV-2 and Beta, Delta, Omicron BA.1, BA.2 and BA.4/5 VOC. Shown are average OD values as measured by ELISA with blank subtracted from n = 2 replicates of 2976, 1248, 2304, 1728 and 576 MBC cultures analyzed from 31 and 13 naïve donors, 24 and 18 infected donors after receiving two and three vaccine doses and from 6 convalescent donors at 376–469 days from symptom onset. RBD-specific MBCs showing high avidity index (AI>80%) are shown in red. Numbers of total and high-avidity RBD-specific MBCs are indicated in the top-left quadrants. Cumulative fractions of total and high-avidity RBD-specific MBCs maintaining or losing binding to the VOC RBD are indicated as percentage in the top-right and bottom-right quadrants. (B) Individual fractions of total and high-avidity SARS-CoV-2 RBD-cross-reactive MBCs that maintain binding with the RBDs of different VOC in convalescent and vaccinated donors. Numbers on top indicate the donors analyzed for the different VOC.

References

    1. Achiron A., Gurevich M., Falb R., Dreyer-Alster S., Sonis P., and Mandel M. (2021). SARS-COV-2 antibody dynamics and B-cell memory response over-time in COVID-19 convalescent subjects. Clin Microbiol Infect. 10.1016/j.cmi.2021.05.008. - DOI - PMC - PubMed
    1. Bowen J.E., Addetia A., Dang H.V., Stewart C., Brown J.T., Sharkey W.K., Sprouse K.R., Walls A.C., Mazzitelli I.G., Logue J.K., et al. (2022a). Omicron spike function and neutralizing activity elicited by a comprehensive panel of vaccines. Science, eabq0203. 10.1126/science.abq0203. - DOI - PMC - PubMed
    1. Bowen J.E., Sprouse K.R., Walls A.C., Mazzitelli I.G., Logue J.K., Franko N.M., Ahmed K., Shariq A., Cameroni E., Gori A., et al. (2022b). Omicron BA.1 and BA.2 neutralizing activity elicited by a comprehensive panel of human vaccines. bioRxiv, 2022.2003.2015.484542. 10.1101/2022.03.15.484542. - DOI - PubMed
    1. Bowen J.E., Walls A.C., Joshi A., Sprouse K.R., Stewart C., Tortorici M.A., Franko N.M., Logue J.K., Mazzitelli I.G., Tiles S.W., et al. (2021). SARS-CoV-2 spike conformation determines plasma neutralizing activity. bioRxiv, 2021.2012.2019.473391. 10.1101/2021.12.19.473391. - DOI - PMC - PubMed
    1. Cameroni E., Bowen J.E., Rosen L.E., Saliba C., Zepeda S.K., Culap K., Pinto D., VanBlargan L.A., De Marco A., di Iulio J., et al. (2022). Broadly neutralizing antibodies overcome SARS-CoV-2 Omicron antigenic shift. Nature 602, 664–670. 10.1038/s41586-021-04386-2. - DOI - PMC - PubMed

Publication types