. 2022 Sep 20:13:995974.
doi: 10.3389/fimmu.2022.995974. eCollection 2022.

Identification of immune-related endoplasmic reticulum stress genes in sepsis using bioinformatics and machine learning

Affiliations

Identification of immune-related endoplasmic reticulum stress genes in sepsis using bioinformatics and machine learning

Ting Gong et al. Front Immunol. .

Abstract

Background: Sepsis-induced apoptosis of immune cells leads to widespread depletion of key immune effector cells. Endoplasmic reticulum (ER) stress has been implicated in the apoptotic pathway, although little is known regarding its role in sepsis-related immune cell apoptosis. The aim of this study was to develop an ER stress-related prognostic and diagnostic signature for sepsis through bioinformatics and machine learning algorithms on the basis of the differentially expressed genes (DEGs) between healthy controls and sepsis patients.

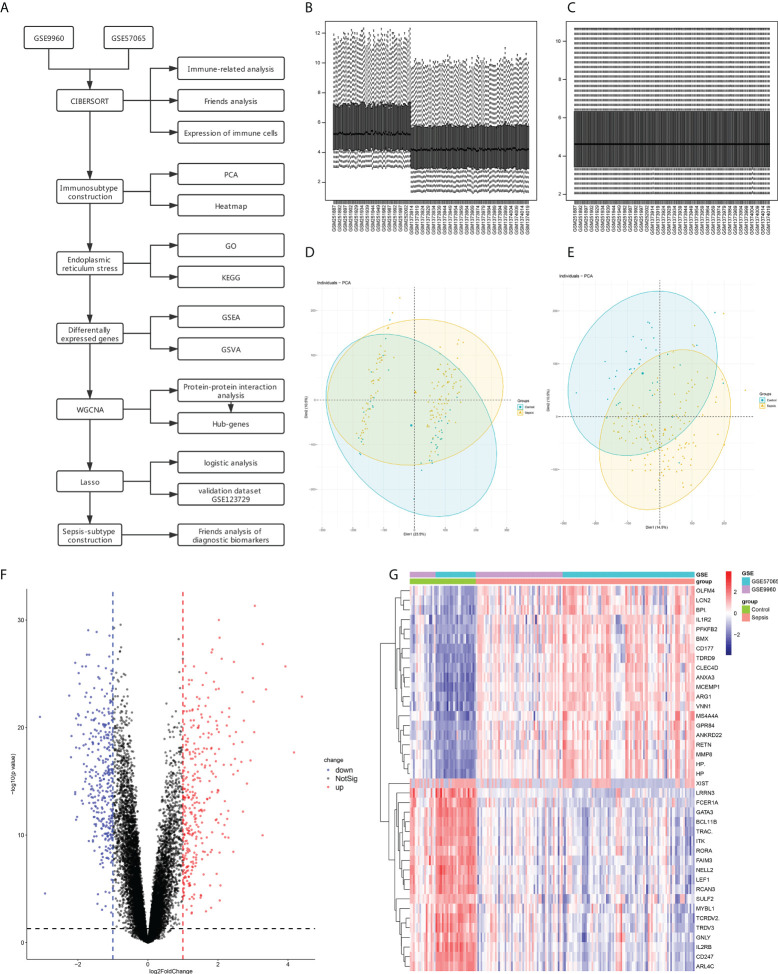
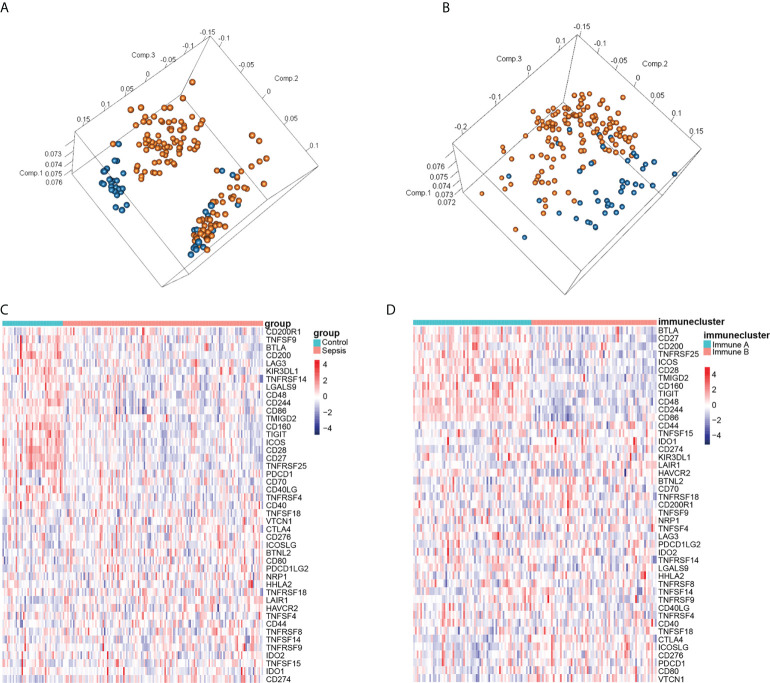
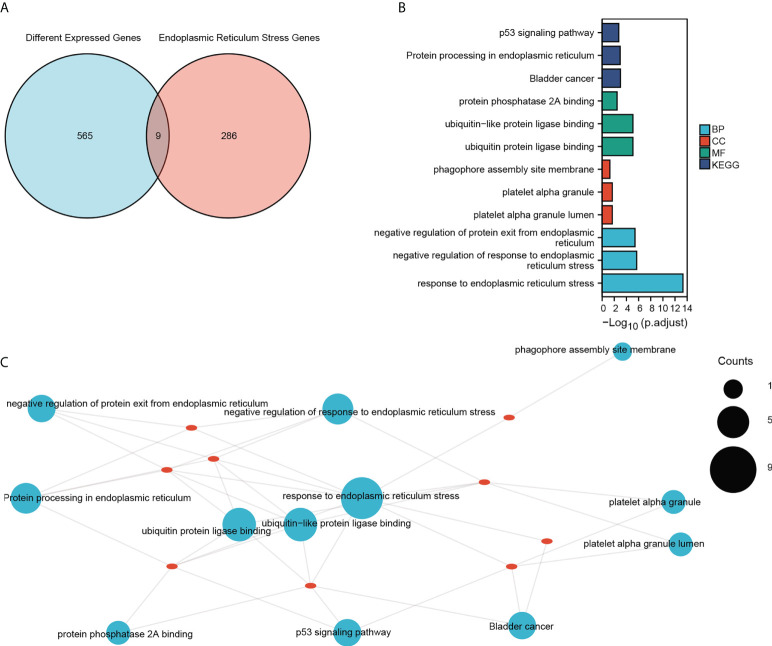
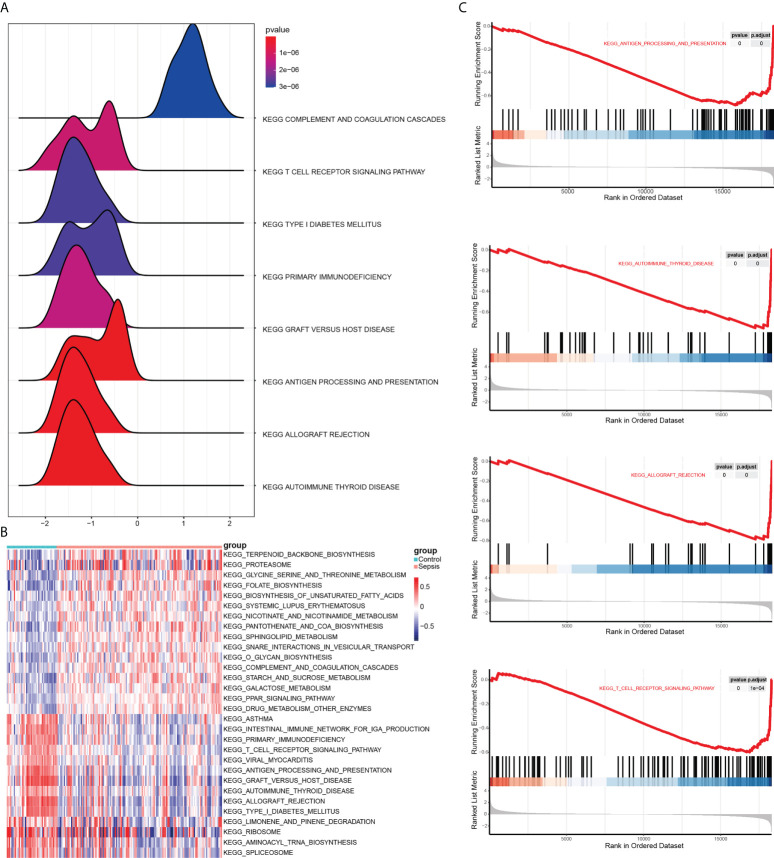
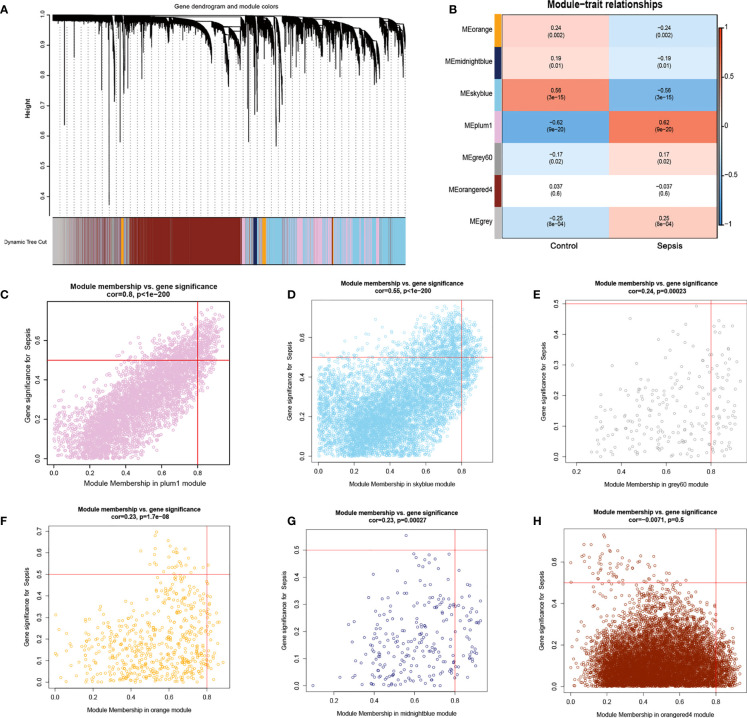
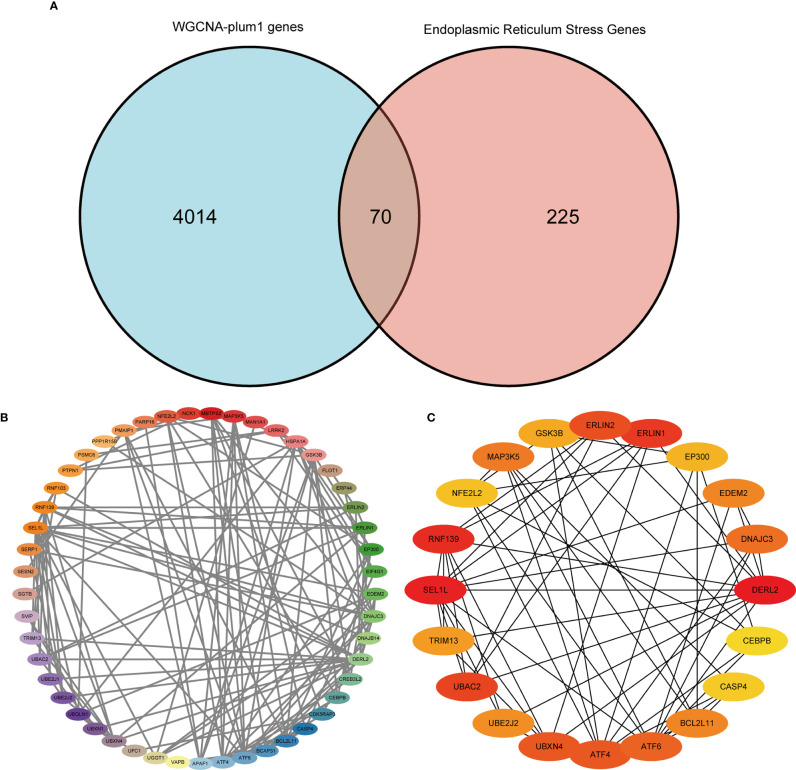
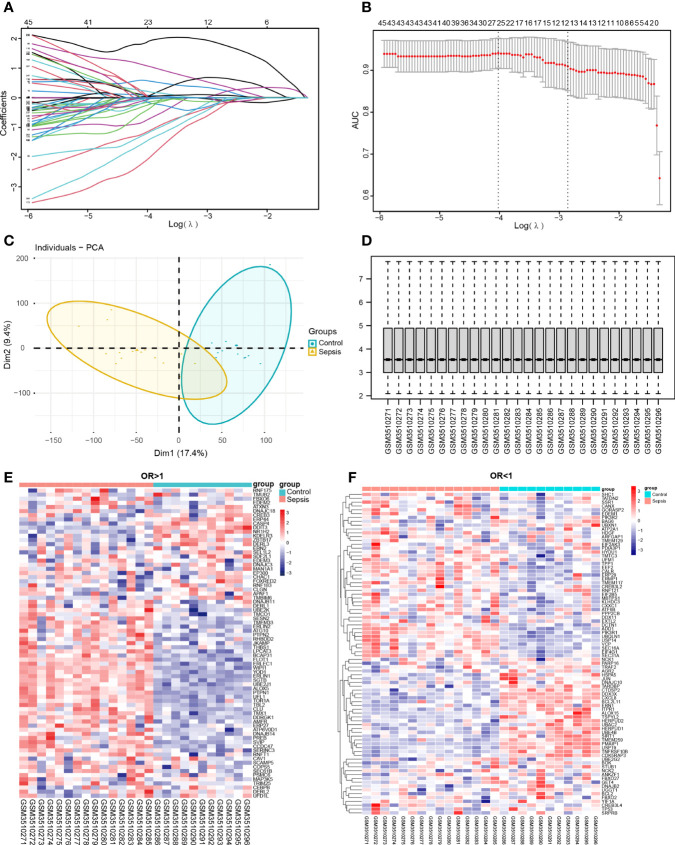
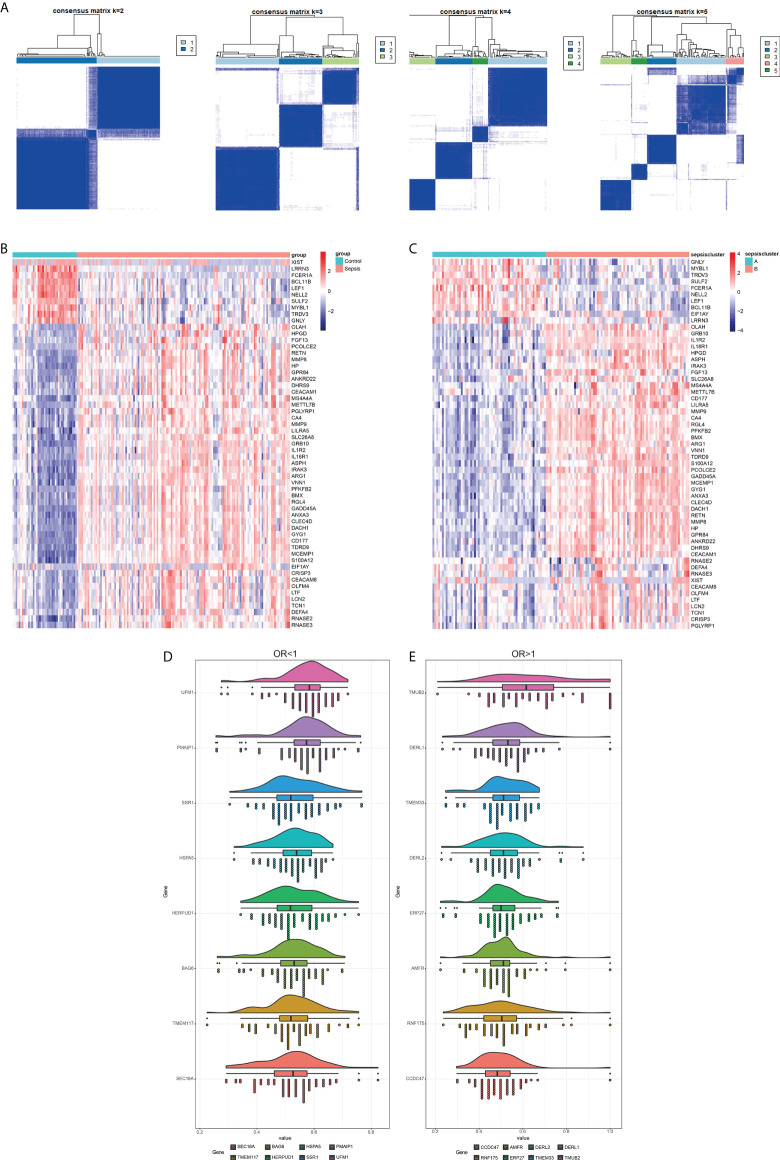
Methods: The transcriptomic datasets that include gene expression profiles of sepsis patients and healthy controls were downloaded from the GEO database. The immune-related endoplasmic reticulum stress hub genes associated with sepsis patients were identified using the new comprehensive machine learning algorithm and bioinformatics analysis which includes functional enrichment analyses, consensus clustering, weighted gene coexpression network analysis (WGCNA), and protein-protein interaction (PPI) network construction. Next, the diagnostic model was established by logistic regression and the molecular subtypes of sepsis were obtained based on the significant DEGs. Finally, the potential diagnostic markers of sepsis were screened among the significant DEGs, and validated in multiple datasets.

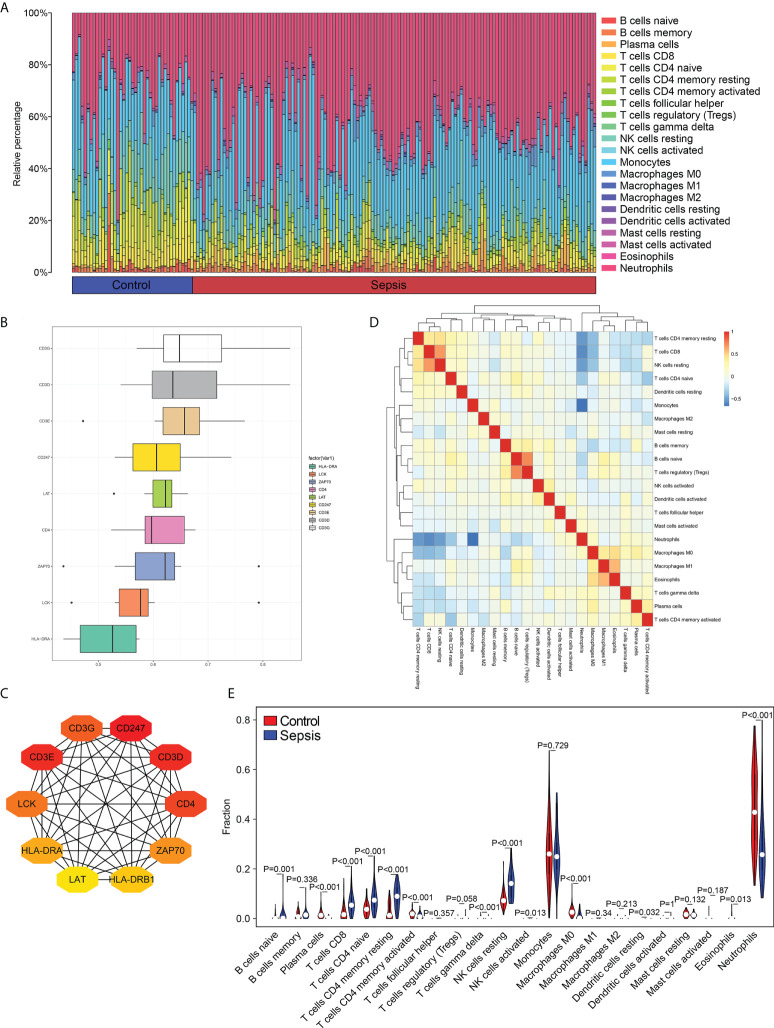
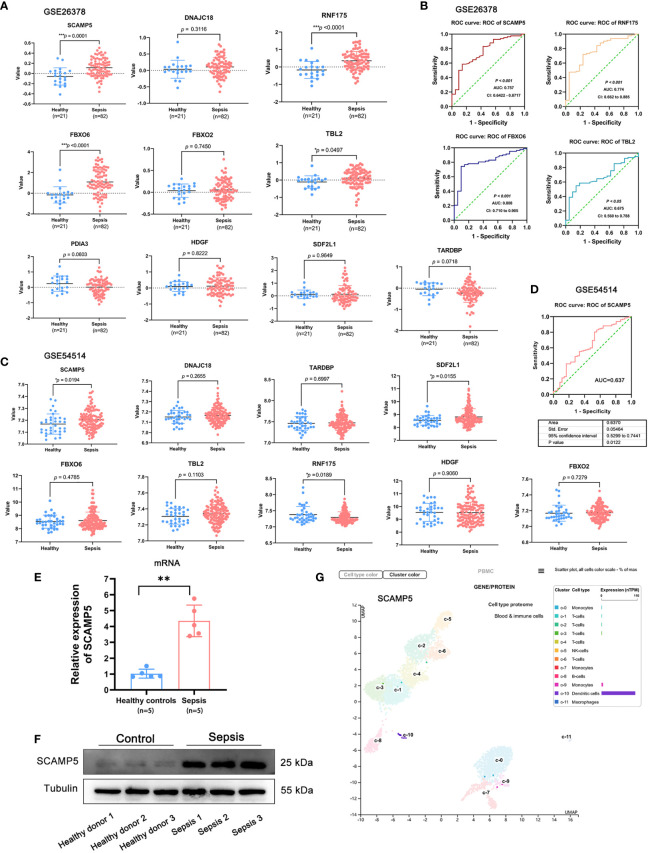
Results: Significant differences in the type and abundance of infiltrating immune cell populations were observed between the healthy control and sepsis patients. The immune-related ER stress genes achieved strong stability and high accuracy in predicting sepsis patients. 10 genes were screened as potential diagnostic markers for sepsis among the significant DEGs, and were further validated in multiple datasets. In addition, higher expression levels of SCAMP5 mRNA and protein were observed in PBMCs isolated from sepsis patients than healthy donors (n = 5).

Conclusions: We established a stable and accurate signature to evaluate the diagnosis of sepsis based on the machine learning algorithms and bioinformatics. SCAMP5 was preliminarily identified as a diagnostic marker of sepsis that may affect its progression by regulating ER stress.

Keywords: SCAMP5; endoplasmic reticulum stress; immunity; machine learning; sepsis.


Conflict of interest statement

The authors declare that the research was conducted in the absence of any commercial or financial relationships that could be construed as a potential conflict of interest.

Figures

Figure 1
Figure 1
Data Preprocessing and identification of differentially expressed genes (DEGs). (A) Flow chart for gene set analyses. (B) Box line diagram of the merged dataset before correction. (C) Box line diagram of the combined dataset after correction. (D) PCA for sepsis and healthy control samples before batch correction with ComBat. (E) PCA for sepsis and healthy control samples after batch correction with ComBat. (F) Volcano plot showing DEGs between sepsis and control samples. (G) Heatmap showing the top 20 up- and down-regulated genes.
Figure 2
Figure 2
Distribution of immune cell subtypes in the merged dataset. (A) Bar plot showing percentage infiltration of 22 immune cells in each sample. (B) The top 10 hub genes according to Friends analysis. (C) The PPI network shows the interactions of the top10 genes. (D) Correlation heatmap of 22 immune cell types. (E) Violin plot showing differential infiltration of the 22 immune cell populations.
Figure 3
Figure 3
Identification of immune subtypes in sepsis. (A) PCA according to the subgroups of sepsis and healthy control samples. (B) PCA according to immunophenotyping. (C) Heatmap of immune infiltration-related genes in the normal and septic groups. (D) Heatmap of immune infiltration-related genes according to immunophenotyping. Red and blue squares indicate activation and suppression, respectively.
Figure 4
Figure 4
GO and KEGG enrichment analysis. (A) Venn diagram showing the intersection of DEGs and ER stress-related genes in the combined dataset. (B) GO functional enrichment analysis of the intersecting genes with the top three of BP, CC and MF terms and KEGG pathways. The horizontal coordinate shows -log(p.adjust) values and the vertical coordinate shows GO terms. (C) The enrichment results are displayed on the network, and the node size represents the number of genes enriched. The red dots represent the nine genes that were enriched.
Figure 5
Figure 5
Results of GSEA and GSVA. (A) Mountain range plot showing the GSEA results of the merged dataset. Horizontal coordinate shows the gene ratio, vertical coordinate show the KEGG pathways, and the color indicates P-value. (B) Heat map showing the results of GSVA on GSEA enrichment data. Red and blue indicate activation and suppression, respectively. (C) The top 5 items of the GSEA.
Figure 6
Figure 6
Results of WGCNA. (A) Cluster analysis of the combined dataset. The different module clusters are color-coded. (B) Correlation between the different modules in the normal and sepsis groups. (C–H), Scatter diagrams for module membership vs. gene significance of sepsis. (C) The plum1 modules with the highest correlation. (D) The correlation between the skyblue module and the genes.(E) Display of the correlation between the grey60 module and the genes. (F) Display of the correlation between the orange module and the genes. (G) Display of the correlation between the midnightblue module and the genes. (H) Display of the correlation between the orangered4 module and the genes.
Figure 7
Figure 7
Protein-protein interaction (PPI) network. (A) Venn diagram showing the intersection of the most significantly correlated genes obtained by WGCNA with ER stress-related genes. (B) PPI network of the 70 intersecting genes. (C) Top 20 hub genes in the PPI network.
Figure 8
Figure 8
Screening for diagnostic markers. (A, B) Lasso analysis of the combined dataset. (C, D) PCA plot and box plot of the validation set GSE123729 data after correction. (E, F) Heat map showing differential expression of diagnostic markers in the validation set obtained by one-way logistic regression analysis. Red indicates up-regulation, blue indicates down-regulation, and darker colors indicate a larger fold change.
Figure 9
Figure 9
Identification of sepsis subtypes and diagnostic markers. (A) The number of genotype clusters in the sepsis dataset. (B) Heat map of diagnostic genes based on control and sepsis groups. (C) Heat map of diagnostic genes based on sepsis subtype. Red indicates activation and blue indicates inhibition. (D) Diagnostic markers with OR less than 1. (E) Diagnostic markers with OR more significant than 1.
Figure 10
Figure 10
SCAMP5 is highly expressed in patients with sepsis and has significant diagnostic value. (A) Expression of hub genes in the control and sepsis samples in GSE26378. SCAMP5, RNF175, FBXO6 and TBL2 were significantly up-regulated in the sepsis patients (P < 0.05 by the two-sided t test. (B) ROC curve showing predictive value of SCAMP5 for sepsis in GSE26378 with AUC = 0.757. (C) Expression of hub genes in the control and sepsis samples in GSE54514. SCAMP5 and SDE2L1 were significantly up-regulated in the sepsis patients (*P < 0.05 by the two-sided t test). (D) ROC curve showing predictive value of SCAMP5 for sepsis in GSE54514 with AUC = 0.637. (E) SCAMP5 mRNA levels in the PBMCs from healthy controls and sepsis patients as determined by qRT-PCR. Mean ± SD (n = 5), **P < 0.01. (F) SCAMP5 protein levels in the PBMCs from healthy controls and sepsis patients. (G) Single-cell sequencing database results showing that SCAMP5 is expressed in the dendritic cells.

Similar articles

Cited by

References

    1. Hsu CY, Tsai YH, Lin CY, Chang YC, Chen HC, Chang YP, et al. . Application of a 72 h national early warning score and incorporation with sequential organ failure assessment for predicting sepsis outcomes and risk stratification in an intensive care unit: A derivation and validation cohort study. J Pers Med (2021) 11(9):910–24. doi: 10.3390/jpm11090910 - DOI - PMC - PubMed
    1. Rudd KE, Johnson SC, Agesa KM, Shackelford KA, Tsoi D, Kievlan DR, et al. . Global, regional, and national sepsis incidence and mortality, 1990-2017: Analysis for the global burden of disease study. Lancet (London England). (2020) 395(10219):200–11. doi: 10.1016/s0140-6736(19)32989-7 - DOI - PMC - PubMed
    1. Li H, Liu L, Zhang D, Xu J, Dai H, Tang N, et al. . SARS-CoV-2 and viral sepsis: observations and hypotheses. Lancet (London England) (2020) 395(10235):1517–20. doi: 10.1016/s0140-6736(20)30920-x - DOI - PMC - PubMed
    1. Wang Y, Zhu K, Dai R, Li R, Li M, Lv X, et al. . Specific interleukin-1 inhibitors, specific interleukin-6 inhibitors, and GM-CSF blockades for COVID-19 (at the edge of sepsis): A systematic review. Front Pharmacol (2021) 12:804250. doi: 10.3389/fphar.2021.804250 - DOI - PMC - PubMed
    1. Bosmann M, Ward PA. The inflammatory response in sepsis. Trends Immunol (2013) 34(3):129–36. doi: 10.1016/j.it.2012.09.004 - DOI - PMC - PubMed

Publication types