. 2022 Oct 1;12(10):e9358.
doi: 10.1002/ece3.9358. eCollection 2022 Oct.

Focal vs. fecal: Seasonal variation in the diet of wild vervet monkeys from observational and DNA metabarcoding data

Affiliations

Focal vs. fecal: Seasonal variation in the diet of wild vervet monkeys from observational and DNA metabarcoding data

Loïc Brun et al. Ecol Evol. .

Abstract

Assessing the diet of wild animals reveals valuable information about their ecology and trophic relationships that may help elucidate dynamic interactions in ecosystems and forecast responses to environmental changes. Advances in molecular biology provide valuable research tools in this field. However, comparative empirical research is still required to highlight strengths and potential biases of different approaches. Therefore, this study compares environmental DNA and observational methods for the same study population and sampling duration. We employed DNA metabarcoding assays targeting plant and arthropod diet items in 823 fecal samples collected over 12 months in a wild population of an omnivorous primate, the vervet monkey (Chlorocebus pygerythrus). DNA metabarcoding data were subsequently compared to direct observations. We observed the same seasonal patterns of plant consumption with both methods; however, DNA metabarcoding showed considerably greater taxonomic coverage and resolution compared to observations, mostly due to the construction of a local plant DNA database. We found a strong effect of season on variation in plant consumption largely shaped by the dry and wet seasons. The seasonal effect on arthropod consumption was weaker, but feeding on arthropods was more frequent in spring and summer, showing overall that vervets adapt their diet according to available resources. The DNA metabarcoding assay outperformed also direct observations of arthropod consumption in both taxonomic coverage and resolution. Combining traditional techniques and DNA metabarcoding data can therefore not only provide enhanced assessments of complex diets and trophic interactions to the benefit of wildlife conservationists and managers but also opens new perspectives for behavioral ecologists studying whether diet variation in social species is induced by environmental differences or might reflect selective foraging behaviors.

Keywords: DNA metabarcoding; diet estimation; environmental DNA; method comparison; primates; seasonal variation.


Conflict of interest statement

The authors note that PT is co‐inventor of a patent related to the Sper01 primers and the use of the P6 loop of the chloroplast trnL (UAA) intron for plant identification using degraded template DNA. This patent only restricts commercial applications and has no impact on the use of this locus by academic researchers.

Figures

FIGURE 1
FIGURE 1
Juvenile vervet monkey (Chlorocebus pygerythrus) feeding on fruits of Ziziphus mucronata. © Michael Henshall.
FIGURE 2
FIGURE 2
The map indicates the sampling locations of the 823 fecal samples of 130 individuals in the Inkawu Vervet Project, South Africa. The different groups are represented by different colored dots: Ankhase: purple (n = 146), Baie Dankie: yellow (n = 212), Kubu: red (n = 224), Noha: blue (n = 241).
FIGURE 3
FIGURE 3
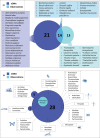
Venn diagrams. (a) Between consumed plant items at the taxonomic level of species detected by observation and eDNA. Plant species beginning with an asterisk (*) correspond to species for which the sequences amplified by the Sper01 metabarcode were identical between species as shown in Table S1. (b) Between arthropods detected by observation and eDNA. For eDNA data, the family level is included, whereas observations were limited to the order level for orthopterans and the infraorder level for termites. The two bubbles on the left side of the diagram indicate the families detected by eDNA that compose these two taxonomic groups. The category “undetermined insects” is not included for observations (see text). Rectangles separate the different orders illustrated by icons.
FIGURE 4
FIGURE 4
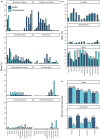
(a) Monthly comparison of DNA metabarcoding and observational data for the most frequent species in the focal dataset (>350 observations), with the exception of those that had identical metabarcodes and matched several species in the focal dataset. The observed plant V. tortilis corresponds to V. tortilis/sieberiana in the DNA metabarcoding dataset. Metabarcoding data are represented by the mean RRA and observational data by the mean count, both in percent. (b) Monthly comparison of DNA metabarcoding and observational data for “termites” (RRA of Hodotermitidae and Termitidae combined), “grasshoppers” (RRA of all detected families belonging to the order Orthoptera), and “others” (RRA of all remaining items). Metabarcoding data are represented by the mean RRA and observational data by the mean count, both in percent. (c) Shannon diversity index per season for observations and eDNA. There was no significant difference in diversity between methods (Hutcheson t test). Numbers on the bars indicate numbers of different observed/detected items per season. For plants, the included items are all observed/detected species and genera. For arthropods, the Shannon diversity was measured at family level for the metabarcoding data and for observational data based on the three categories (b).
FIGURE 5
FIGURE 5
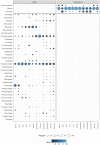
Mean RRA of plants genera and species in fecal samples per month (left) and mean of observations in focal follows per month (right). Note that the obtained sequence for Euphorbia is different from E. ingens and E. tirucalli. Also, E. crispa and E. undulata were identified to species level in the field but have identical sequences, the same is true for V. nilotica and C. decapetala; therefore, both entries for observations were kept but only one for eDNA. Several names in one line indicate identical sequences as well (on the left), but only one observed genus/species (on the right).
FIGURE 6
FIGURE 6
Principal coordinates analyses (PCoA) based on (a) relative read abundances (RRA) of consumed plants detected in fecal samples (n = 823) and (b) observational plant data of focal follow transformed to relative abundances per individual/season (n = 279). In brackets the relative Eigenvalues in percent.
FIGURE 7
FIGURE 7
Mean RRA of arthropod families in fecal samples per month (left) and mean of observations in focal follows per month (right). The category “others” includes all insect observations that were neither identified as grasshoppers nor as termites. The families in the order Orthoptera (“grasshoppers”) are Acrididae, Gryllacrididae, Gryllidae, Pamphagidae, and Tettigoniidae. The families in the order Blattodea (equivalent to “termites”) are Hodotermitidae and Termitidae.

References

    1. Altmann, J. (1974). Observational study of behavior: Sampling methods. Behaviour, 49, 227–267. 10.1163/156853974X00534 - DOI - PubMed
    1. Arrizabalaga‐Escudero, A. , Clare, E. L. , Salsamendi, E. , Alberdi, A. , Garin, I. , Aihartza, J. , & Goiti, U. (2018). Assessing niche partitioning of co‐occurring sibling bat species by DNA metabarcoding. Molecular Ecology, 27, 1273–1283. 10.1111/mec.14508 - DOI - PubMed
    1. Arseneau‐Robar, T. J. M. , Taucher, A. L. , Schnider, A. B. , van Schaik, C. P. , & Willems, E. P. (2017). Intra‐ and interindividual differences in the costs and benefits of intergroup aggression in female vervet monkeys. Animal Behaviour, 123, 129–137. 10.1016/j.anbehav.2016.10.034 - DOI
    1. Barrett, A. (2005). Foraging ecology of the vervet monkey (Chlorocebus aethiops) in mixed lowveld bushveld and sour lowveld bushveld of the blydeberg conservancy, Northern Province, South Africa. University of South Africa.
    1. Barrett, A. (2009). Spatial and temporal patterns in resource dispersion and the structure of range use and co‐existence in a social omnivore Chlorocebus aethiops. Ph.D Dissertation. University of South Africa.

LinkOut - more resources