. 2022 Aug 30;5(3):e1222.
doi: 10.1002/jsp2.1222. eCollection 2022 Sep.

Two- and three-dimensional in vitro nucleus pulposus cultures: An in silico analysis of local nutrient microenvironments

Affiliations

Two- and three-dimensional in vitro nucleus pulposus cultures: An in silico analysis of local nutrient microenvironments

Emily E McDonnell et al. JOR Spine. .

Abstract

Background: It is well established that the unique biochemical microenvironment of the intervertebral disc plays a predominant role in cell viability and biosynthesis. However, unless the effect of microenvironmental conditions is primary to a study objective, in vitro culture parameters that are critical for reproducibility are both varied and not routinely reported.

Aims: This work aims to investigate the local microenvironments of commonly used culture configurations, highlighting physiological relevance, potential discrepancies, and elucidating possible heterogeneity across the research field.

Materials and methods: This work uses nutrient-transport in silico models to reflect on the effect of often underappreciated parameters, such as culture geometry and diffusional distance (vessel, media volume, construct size), seeding density, and external boundary conditions on the local microenvironment of two-dimensional (2D) and three-dimensional (3D) in vitro culture systems.

Results: We elucidate important discrepancies between the external boundary conditions such as the incubator level or media concentrations and the actual local cellular concentrations. Oxygen concentration and cell seeding density were found to be highly influential parameters and require utmost consideration when utilizing 3D culture systems.

Discussion: This work highlights that large variations in the local nutrient microenvironment can easily be established without consideration of several key parameters. Without careful deliberation of the microenvironment within each specific and unique system, there is the potential to confound in vitro results leading to heterogeneous results across the research field in terms of biosynthesis and matrix composition.

Conclusion: Overall, this calls for a greater appreciation of key parameters when designing in vitro experiments. Better harmony and standardization of physiologically relevant local microenvironments are needed to push toward reproducibility and successful translation of findings across the research field.

Keywords: cell culture; glucose; in silico; microenvironment; oxygen; pH.


Conflict of interest statement

The authors declare no conflict of interest.

Figures
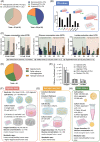
FIGURE 1
FIGURE 1
(A) The most used glucose concentrations and incubator oxygen levels across 55 reviewed studies. (B) The frequency of culture vessel used across these studies for 2D NP cell expansion and culture. (C) Compiled metabolic rates gathered from the literature and graphed according to glucose concentration and external oxygen concentration. (D) Most commonly used 3D culture system for NP cells across 42 studies. (E) Effective diffusion coefficients for oxygen, glucose, and lactate through several relevant hydrogels at 37°C. (F–H) Most common configurations (geometrical dimensions, cell density, boundary concentrations, and culture vessels) for alginate beads, cylindrical hydrogel constructs, and pellet culture
FIGURE 2
FIGURE 2
(A) The volume/volume ratio of oxygen to other gases in an incubator is decreased compared with that of dry air in a room. Values are shown for sea level. (B) As a result, the relative gas concentration in a normoxia (NX), physioxia (PX), or hypoxia (HX) incubator, with the addition of 5% CO2 and 75% humidity, are lower than the conventional concentrations often cited. These incubator oxygen levels can then be converted to the concentration of dissolved oxygen by using an oxygen solubility coefficient in culture media at 37°C. (C) A temporal analysis of the oxygen concentration at the cell surface for cells proliferating over a 7‐day period in either an NX, PX or HX incubator. Solid line indicates a lower animal/healthy human metabolism, dashed lines indicate a higher degenerated phenotype. (D) Glucose concentration of the media at 80% confluency for both low (5.5 mM) and high (25 mM) glucose media in a NX, PX, and HX incubator. (E) pH concentration of the media at 80% confluency in a NX, PX, and HX incubator.
FIGURE 3
FIGURE 3
Investigating the effect of three different seeding densities on the oxygen concentration in a single 30 μl alginate bead in 2 ml of low glucose (LG) or high glucose (HG) media (24‐well) at normoxia (NX), physioxia (PX), and hypoxia (HX). (A) Oxygen contour plots for lower animal/healthy human metabolism. (B) Oxygen contour plots for a higher degenerated phenotype. (C) Minimum oxygen concentrations in the alginate bead at steady state for the different seeding densities, metabolic rates, and nutrient conditions.
FIGURE 4
FIGURE 4
(A) Contour plots showing the glucose concentration in a single alginate bead of different seeding densities in low glucose (LG) and high glucose (HG) media, just prior to a media exchange, at normoxia (NX), physioxia (PX), and hypoxia (HX). (B) Corresponding minimum glucose concentrations within the alginate bead prior to media exchange. (C) Contour plots showing the pH level in a single alginate bead of different seeding densities in LG and HG media, just prior to a media exchange, at NX, PX, and HX. (D) Corresponding minimum pH levels within the alginate bead prior to media exchange.
FIGURE 5
FIGURE 5
Investigating the effect of multiple alginate beads (4 or 10 beads of 4 million cells/ml) in a single culture vessel (12‐well). (A) Contour plots showing the glucose concentration in a transverse plane through the center of the beads in low glucose (LG) and high glucose (HG) media, just prior to a media exchange, at normoxia (NX), physioxia (PX), and hypoxia (HX). (B) Transient analysis of the minimum glucose concentration within an arbitrary bead within the 4 or 10 bead configurations up until the media exchange, for both LG and HG media. (C) Contour plots showing the pH in a transverse plane through the center of the beads in LG and HG media, just prior to a media exchange, at NX, PX, and HX. (D) Transient analysis of the minimum pH level within an arbitrary bead within the 4 or 10 bead configurations up until the media exchange, for both LG and HG media.
FIGURE 6
FIGURE 6
(A) Oxygen gradients through a quadrant of a cylindrical construct (radius: 2.5 mm, height: 3 mm, or 1.5 mm) containing a seeding density of either 4 or 20 million cells/ml and cultured at normoxia, physioxia or hypoxia. Cells are assumed to have the lower animal metabolic rates. (B) Corresponding axial profile of oxygen through the constructs. As indicated, the axial profile runs from the top surface of the hydrogel to the base at the bottom of the culture plate and is normalized to account for investigating two different construct heights.
FIGURE 7
FIGURE 7
Transient analysis of glucose concentration and pH values within a cylindrical construct (radius: 2.5 mm, height: 3 mm, or 1.5 mm) containing a seeding density of either 4 or 20 million cells/ml with a media exchange performed at the midpoint. The graph represents the average values within the hydrogel and the inset contour plot represents the gradient just prior to media refresh. (A) Glucose concentrations and (B) pH values under low glucose (5.5 mM) media. (C) Glucose concentrations and (D) pH values under high glucose (25 mM) media.
FIGURE 8
FIGURE 8
(A) Contour plots of oxygen, glucose and pH gradients through the culture media and cell aggregate of a 250 000‐cell pellet in 1 ml (Eppendorf) or 200 μl (96‐well) of media and a 35 000‐cell microaggregate in 50 μl (96‐well) of media. The presented values are predicted just prior to media refresh, under a twice weekly feeding regime. (B) Corresponding values for the average concentration of oxygen, glucose, and pH in the media and the cell aggregate prior to a media exchange in each of the three culture configurations.

References

    1. Buckley CT, Hoyland JA, Fujii K, Pandit A, Iatridis JC, Grad S. Critical aspects and challenges for intervertebral disc repair and regeneration‐harnessing advances in tissue engineering. JOR Spine. 2018;1:e1029. doi:10.1002/jsp2.1029 - DOI - PMC - PubMed
    1. Farhang N, Silverman LI, Bowles RD. Improving cell therapy survival and anabolism in harsh musculoskeletal disease environments. Tissue Eng ‐ Part B Rev. 2020;26(4):348‐366. doi:10.1089/ten.teb.2019.0324 - DOI - PubMed
    1. Guerrero J, Häckel S, Croft A, Hoppe S, Albers C, Gantenbein B. The nucleus pulposus microenvironment in the intervertebral disc: the fountain of youth? Eur Cells Mater. 2021;41:707‐738. doi:10.22203/ecm.v041a46 - DOI - PubMed
    1. Grunhagen T, Shirazi‐Adl A, Fairbank JCT, Urban JPG. Intervertebral disk nutrition: a review of factors influencing concentrations of nutrients and metabolites. Orthop Clin North Am. 2011;42(4):465‐477. doi:10.1016/j.ocl.2011.07.010 - DOI - PubMed
    1. Ohshima H, Urban JPG. The effect of lactate and ph on proteoglycan and protein synthesis rates in the intervertebral disc. Spine (Phila Pa 1976). 1992;17(9):1079‐1082. doi:10.1097/00007632-199209000-00012 - DOI - PubMed