. 2022 Sep 14;2(9):100166.
doi: 10.1016/j.xgen.2022.100166. Epub 2022 Aug 4.

Functional inference of gene regulation using single-cell multi-omics

Affiliations

Functional inference of gene regulation using single-cell multi-omics

Vinay K Kartha et al. Cell Genom. .

Abstract

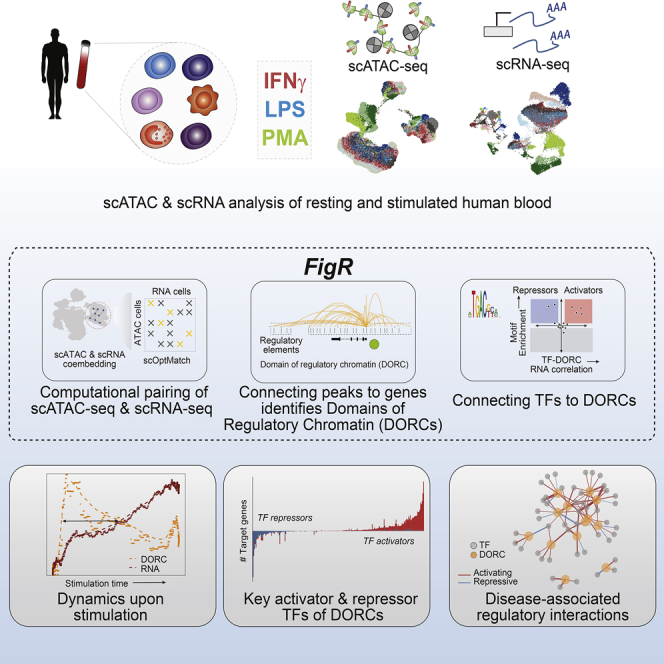
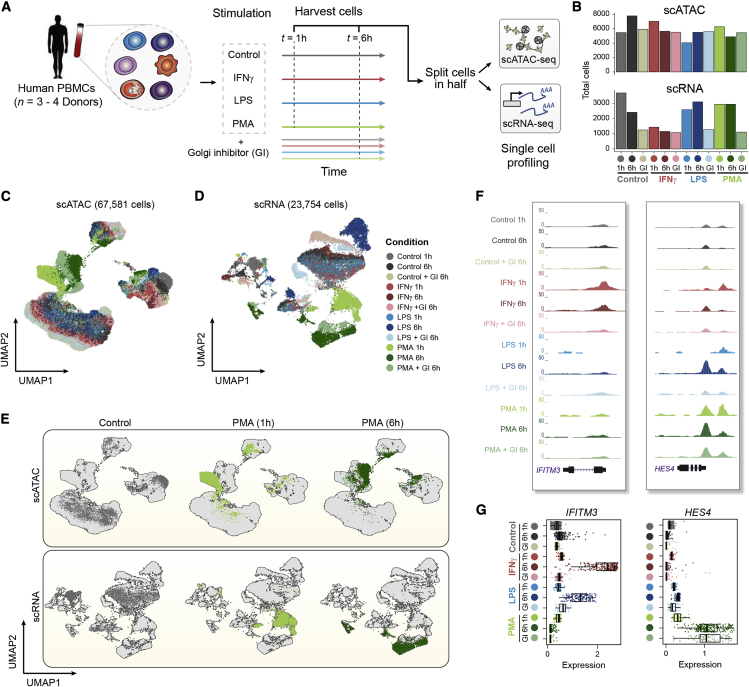
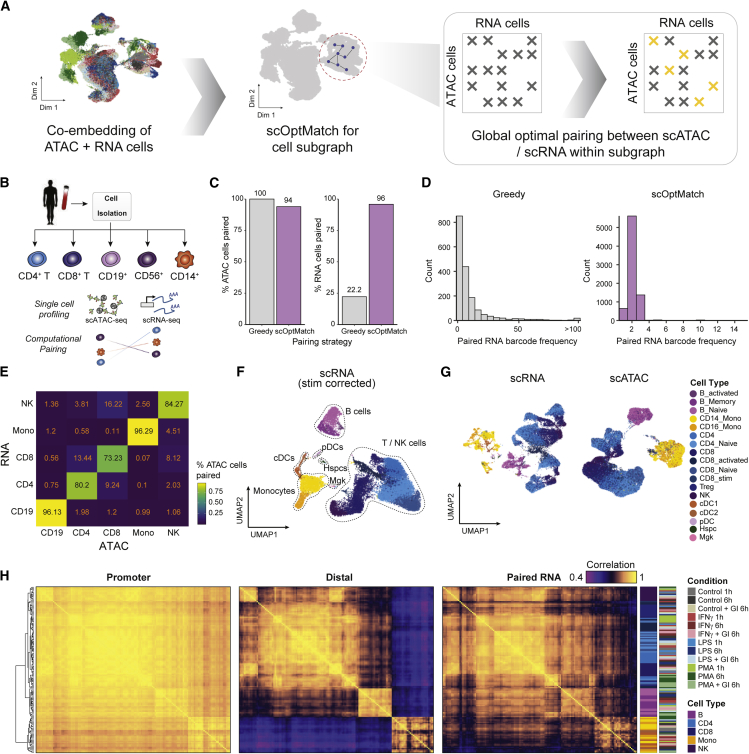
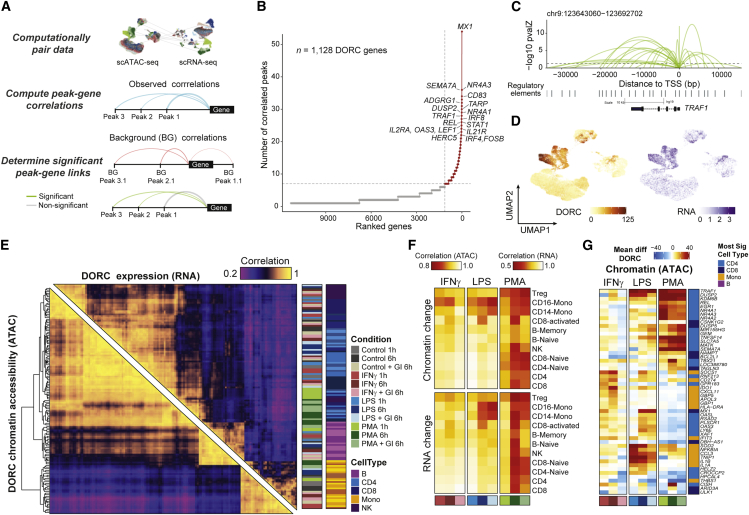
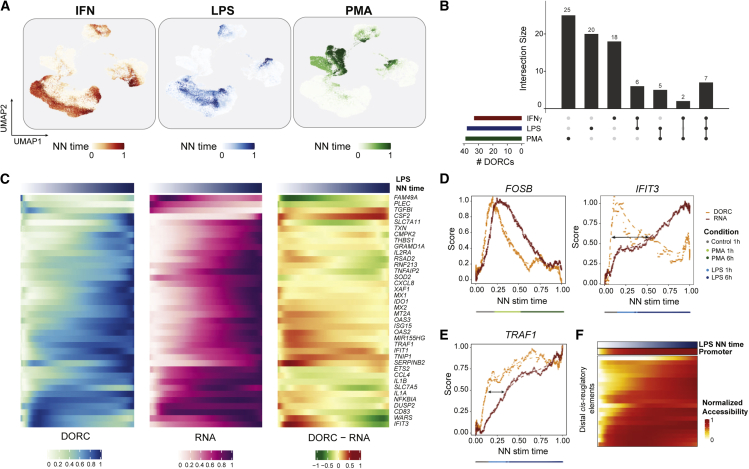
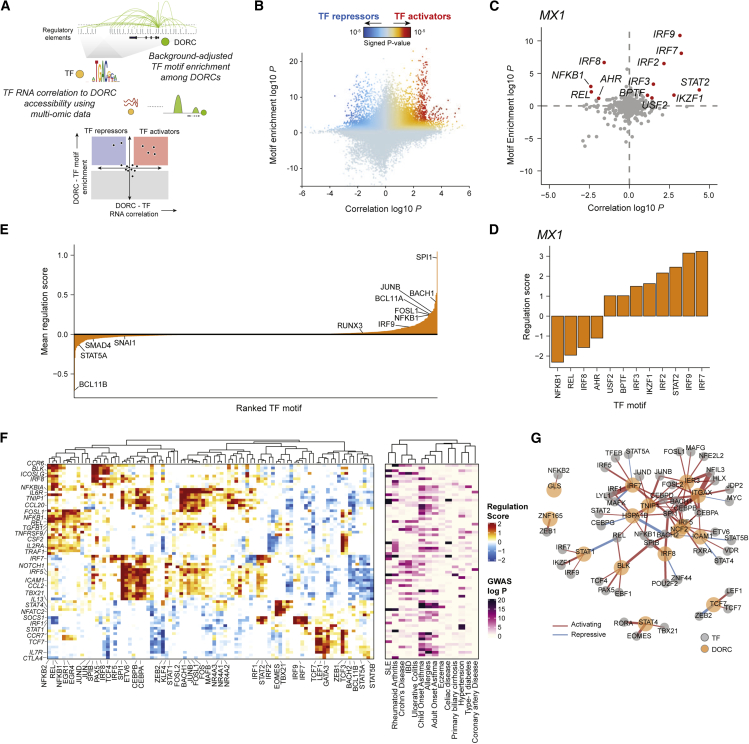
Cells require coordinated control over gene expression when responding to environmental stimuli. Here we apply scATAC-seq and single-cell RNA sequencing (scRNA-seq) in resting and stimulated human blood cells. Collectively, we generate ~91,000 single-cell profiles, allowing us to probe the cis-regulatory landscape of the immunological response across cell types, stimuli, and time. Advancing tools to integrate multi-omics data, we develop functional inference of gene regulation (FigR), a framework to computationally pair scA-TAC-seq with scRNA-seq cells, connect distal cis-regulatory elements to genes, and infer gene-regulatory networks (GRNs) to identify candidate transcription factor (TF) regulators. Utilizing these paired multi-omics data, we define domains of regulatory chromatin (DORCs) of immune stimulation and find that cells alter chromatin accessibility and gene expression at timescales of minutes. Construction of the stimulation GRN elucidates TF activity at disease-associated DORCs. Overall, FigR enables elucidation of regulatory interactions across single-cell data, providing new opportunities to understand the function of cells within tissues.


Conflict of interest statement

DECLARATION OF INTERESTS J.D.B. holds patents related to ATAC-seq and scATAC-seq and serves on the scientific advisory boards of CAMP4 Therapeutics, seqWell, and CelSee. J.G.C., Z.D.B., A.S.K., and R.L. are employees of Bio-Rad.

Figures

None
Graphical abstract
Figure 1
Figure 1
High-throughput single-cell epigenomic and transcriptional profiling of resting and stimulated human blood cells (A) Schematic highlighting design of stimulation experiment. Human peripheral blood mononuclear cells (PBMCs) were stimulated with DMSO control, lipopolysaccharide (LPS), interferon gamma (IFN-Ɣ), or phorbol myristate acetate (PMA) plus ionomycin for 1 or 6 h with or without a Golgi inhibitor (GI ) for the 6-h treatment condition. Cells were then split and profiled using scATAC-seq and scRNA-seq for each condition and time point considered. (B) Total number of cells profiled per condition passing quality control filtering for scATAC and scRNA-seq. (C) Uniform manifold approximation and projection (UMAP) of scATAC-seq cells based on latent semantic indexing (LSI) dimensionality reduction, with cells colored by treatment condition. (D) UMAP of scRNA-seq cells based on principal-component analysis (PCA) dimensionality reduction, with cells colored by treatment condition. (E) UMAPs of scATAC-seq cells (top) and scRNA-seq cells (bottom), highlighting individual conditions under control (6 h) and PMA (1 and 6 h) conditions. (F) Aggregate accessibility profiles for scATAC-seq monocyte cells around genes IFITM3 and HES4. (G) Distribution of single-cell expression levels based on the imputed scRNA-seq counts for stimulation-specific gene markers shown in (F) per condition for scRNA-seq monocyte cells.
Figure 2
Figure 2
Sparse kNN-based ATAC-RNA cell pairing allows optimal pairing and integration of scATAC-seq and scRNA-seq data (A) Schematic highlighting scOptMatch’s strategy for computational pairing of scATAC-seq and scRNA-seq cells based on geodesic distance kNNs (yellow x marks) within cluster subgraphs (gray x marks). (B) Schematic depicting experimental bead enrichment of specific immune cell types from human PBMCs. (C) Distribution of the number of instances of paired RNA cell barcode when using the greedy (left) versus scOptMatch method for the PBMC isolate dataset pairing. (D) Percentage of total scATAC and scRNA-seq cells paired using the two different pairing strategies. (E) Accuracy heatmap of scATAC-scRNA-seq pairing between PBMC isolate cell types, colored by percentage of scATAC-seq cells correctly paired with the corresponding scRNA-seq cell type. (F) UMAP of scRNA-seq stimulated cells shown in Figure 1D, with cells aligned across stimulus conditions to enable cell type annotation, colored by annotated cell type. (G) UMAP of un-aligned scRNA-seq cells (shown in Figure 1D) colored by annotated cell type (left) and scATAC-seq stimulated cells (shown in Figure 1C) colored by paired scRNA-seq cell annotations (right), enabling downstream data integration for stimulated scATAC- and scRNA-seq-profiled cells. (H) Pairwise Pearson correlation of aggregate single-cell chromatin accessibility profiles associated with gene promoters (left), distal from the promoter (center) and paired gene expression (right), aggregated by cell type and condition.
Figure 3
Figure 3
Integrative multi-omics analysis identifies key regulatory modules associated with stimulus response in single cells (A) Schematic of cis-regulatory analyses for identification of significant chromatin accessibility peak-gene associations using computationally paired scATAC-seq and scRNA-seq stimulation datasets. (B) Top hits based on the number of significant gene-peak correlations across all cell types and stimulus conditions. (C) Loop plots highlighting significant peak-gene associations for DORC TRAF1, determined using the approach outlined in (A). (D) UMAP of DORC accessibility scores (left) and paired RNA expression (right) for TRAF1. (E) Pairwise Pearson correlation of aggregate DORC accessibility scores and RNA expression of cells per condition per cell type across all DORCs, clustered using hierarchical clustering by DORC score correlations. (F) Global DORC accessibility (top) and gene expression (bottom) change displayed based on the Pearson correlation coefficient of the aggregate score across DORCs for each stimulation condition versus its corresponding control condition, shown per condition per cell type annotation. (G) Heatmap showing the mean difference in single-cell DORC accessibility for the union of the top 10 differential DORCs across conditions and cell types (n = 53 genes). The cell type color bar represents the cell group having the most significant change across all conditions for that assay.
Figure 4
Figure 4
Chromatin and gene expression dynamics with respect to stimulus response time (A) UMAP of scATAC cells colored by estimated NN stimulation (stim) time per stimulus condition. (B) UpSet plot highlighting overlap of monocyte-constrained DORC genes determined for the three different stimulus conditions. (C) Heatmaps highlighting smoothed normalized DORC accessibility, RNA expression, and residual (DORC-RNA) levels for DORC genes (n = 38) identified to be associated with LPS NN stimulation time in control (1 h) and stimulated (1 h/6 h) monocytes (n = 1,776 cells). (D) Chromatin (DORC) versus gene expression (RNA) dynamics of DORCs FOSB (left) and IFIT3 (right) with respect to smoothed PMA and LPS NN stim time, respectively, for control (1 h) and stimulated (1 h/6 h) monocytes (n = 2,002 cells for PMA + control, n = 2,601 cells for IFNƔ + control). A dotted line represents a LOESS fit to the values obtained from a sliding average of DORC accessibility or RNA expression levels (n = 100 cells per sliding window bin). The color bar indicates the most frequent (mode) cell condition within each bin. (E) Same as in (D) but for TRAF1 with respect to LPS-stimulated and control (1 h) monocytes. (F) Smoothed accessibility scores for individual cis-regulated elements correlated with TRAF1 expression in control and LPS-stimulated monocytes shown in (D), ordered by LPS NN stim time.
Figure 5
Figure 5
Design and application of FigR’s gene regulatory network (GRN) workflow to identify TF modulators of immune response DORCs (A) Schematic describing the FigR GRN workflow. (B) Scatterplot showing all DORC-to-TF associations, colored by the signed regulation score. (C) Candidate TF regulators of MX1. Highlighted points are TFs with abs(regulation score) ≥ 1 (−log10 scale), with all other TFs shown in gray. (D) Regulation scores (signed, −log10 scale) for the highlighted TFs in (C). (E) Mean regulation score (signed, −log10 scale) across all DORCs (n = 1,128) per TF (n = 870), highlighting select TF activators (right skewed) versus TF repressors (left skewed). (F) Heatmap of DORC regulation scores (left) for all significant TF-DORC enrichments for DORCs implicating GWAS variants (abs(regulation score) ≥ 1.5; n = 89 TFs, n = 73 DORCs). The corresponding minimum GWAS P (right; −log10 scale) for each DORC across all diseases considered is also shown. (G) TF-DORC network visualization for SLE GWAS SNP-implicated DORCs (orange nodes) and their associated TFs (gray nodes) from (F). Edges are scaled and colored by the signed regulation score.

References

    1. Medzhitov R., Horng T. Transcriptional control of the inflammatory response. Nat. Rev. Immunol. 2009;9:692–703. doi: 10.1038/nri2634. Available from. - DOI - PubMed
    1. Klemm S.L., Shipony Z., Greenleaf W.J. Chromatin accessibility and the regulatory epigenome. Nat. Rev. Genet. 2019;20:207–220. - PubMed
    1. Yosef N., Regev A. Writ large: genomic dissection of the effect of cellular environment on immune response. Science. 2016;354:64–68. - PMC - PubMed
    1. Fowler T., Sen R., Roy A.L. Regulation of primary response genes. Mol. Cell. 2011;44:348–360. - PMC - PubMed
    1. Busslinger M., Tarakhovsky A. Epigenetic control of immunity. Cold Spring Harb. Perspect. Biol. 2014;6 doi: 10.1101/cshperspect.a019307. Available from. - DOI - PMC - PubMed