. 2022 Sep 6;25(10):105081.
doi: 10.1016/j.isci.2022.105081. eCollection 2022 Oct 21.

Multiomic characterization and drug testing establish circulating tumor cells as an ex vivo tool for personalized medicine

Affiliations

Multiomic characterization and drug testing establish circulating tumor cells as an ex vivo tool for personalized medicine

Jia-Yang Chen et al. iScience. .

Abstract

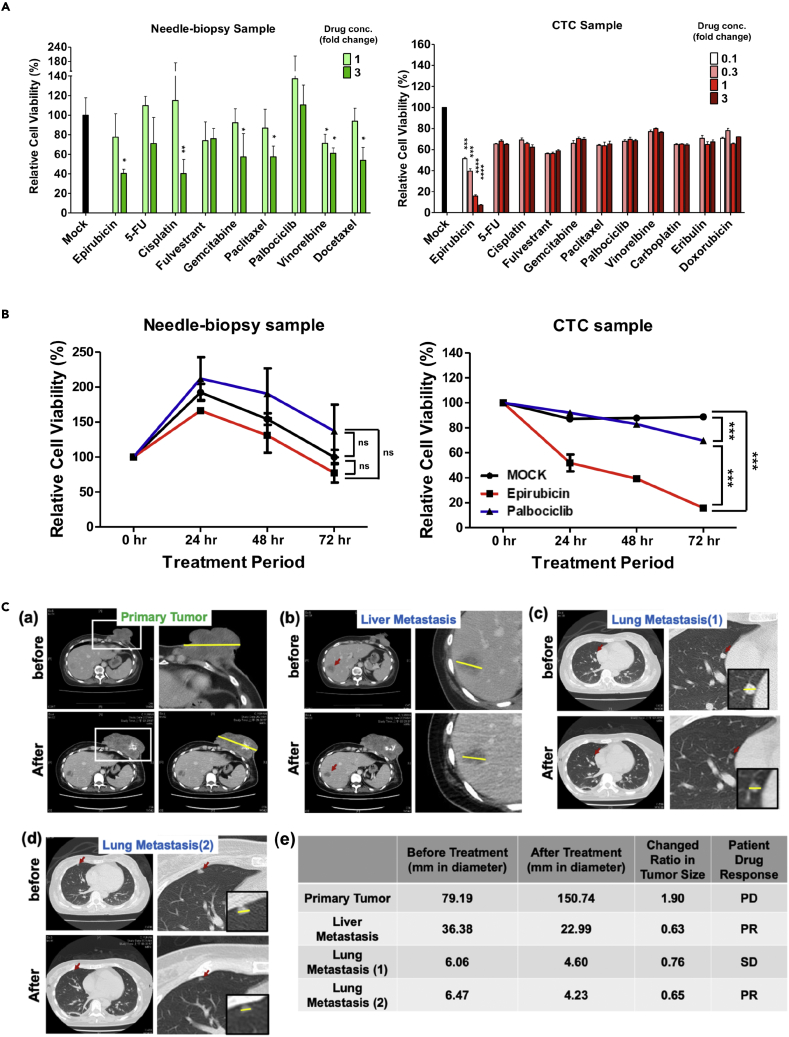
Matching the treatment to an individual patient's tumor state can increase therapeutic efficacy and reduce tumor recurrence. Circulating tumor cells (CTCs) derived from solid tumors are promising subjects for theragnostic analysis. To analyze how CTCs represent tumor states, we established cell lines from CTCs, primary and metastatic tumors from a mouse model and provided phenotypic and multiomic analyses of these cells. CTCs and metastatic cells, but not primary tumor cells, shared stochastic mutations and similar hypomethylation levels at transcription start sites. CTCs and metastatic tumor cells shared a hybrid epithelial/mesenchymal transcriptome state with reduced adhesive and enhanced mobilization characteristics. We tested anti-cancer drugs on tumor cells from a metastatic breast cancer patient. CTC responses mirrored the impact of drugs on metastatic rather than primary tumors. Our multiomic and clinical anti-cancer drug response results reveal that CTCs resemble metastatic tumors and establish CTCs as an ex vivo tool for personalized medicine.

Keywords: Cancer; Omics; Precision medicine; Transcriptomics.


Conflict of interest statement

Ying-Chih Chang is the founder and stockholder of Acrocyte Therapeutics Inc., New Taipei City, Taiwan. Other authors declare no conflicts of interest.

Figures

None
Graphical abstract
Figure 1
Figure 1
Establishment of primary, circulating and metastatic tumor cell lines (A) Workflow for establishment and characterization of primary, circulating and metastatic tumor cell lines from a metastatic mouse model. The process included three steps: (1) The 4T1-hHER2-Luc cancer cell line was inoculated into NSG mice to generate the first batch of orthotopic spontaneous metastatic xenografts. These mice were called “patient” models. (2) CTCs derived from the “patient” mice were inoculated and in vivo expanded in a second batch of NSG mice to generate CTC-derived “patient” xenografts, CTC-PDx. (3) Primary, circulating, and metastatic tumor cells from CTC-PDx mice were used to establish respective cell lines. Subsequent phenotypic assays and multiomic analyses including exome, DNA methylome, and transcriptome sequencing of the resulting cell lines was performed. (B) Isolation efficiency (mean ± SD) of 4T1-hHER2-Luc cancer cells by the LIPO platform without (Chip only) and with anti-mouse EpCAM antibody coating (Chip + Ab). (C) Images of 4T1-hHER2-Luc cells released from the LIPO platform tested using the LIVE/DEAD assay. The 4T1-hHER2-Luc cells captured and subsequently released from the LIPO platform were assessed for viability using the LIVE/DEAD assay. BF: bright field; Calcein AM: green (live marker); EthD-1: red (dead marker). (D) Representative immunostaining images of cells isolated from the blood of a CDx mouse using the LIPO platform were shown. Distinct classes of single CTCs, clustered CTCs, and white blood cells (WBC) were found. Green: anti-hHER2, Red: anti-mCD45, blue: DAPI. Scale bar: 10 μm. (E and F) The numbers of single CTCs (E) and clustered CTCs (F) isolated from 75 μL blood from CDx mice in weeks 1, 3, and 4 after inoculation. Numbers in parentheses indicate the number of mice tested. ∗p< 0.05, ∗∗p< 0.01, ∗∗∗p< 0.001 (Student’s ttest, mean ± SD).
Figure 2
Figure 2
Phenotypic characterization of the primary tumor, CTC, and metastatic tumor-derived sublines and the parental 4T1-hHER2-Luc cell line (A) Representative images of the parental 4T1-hHER2-Luc cell line (a), primary tumor-derived cell line 7-PRI (b), CTC-derived cell line 3-CTC (c), and metastasis-derived cell line 5-META (d). (B) Cell cycle distribution of the parental cell line, and the indicated sublines 12 h after the 50 ng/mL nocodazole treatment is shown on the left; the average cell cycle distribution from the primary (PRI), circulating (CTC), and metastatic (META) tumor sublines after nocodazole synchronization is shown on the right (mean ± SD). No significant difference was observed among sublines using Chi-square analysis.
Figure 3
Figure 3
Whole exome NGS sequencing results of the primary, circulating and tumor cell lines derived from CTC-PDx mice (A) Numbers of newly acquired genomic variants in each subline, and numbers of shared variants (intersect) among sublines. (B) A Circos plot summarizing genomic variant density and distribution of the indicated tumor cell lines. The order of cell lines from outer to inner is 3-META, 5-META, 7-META, 1-CTC, 3-CTC, 6-CTC, 5-PRI, 7-PRI and 8-PRI. The black/red dot represents sparse/dense genomic variants in the chromosome coordinates shown on the outermost area of the plot. (C) Concurrent mutation analyses between cell lines of the same lineage. The number in the intersection of two circles represents the number of common variants between the indicated cell lines. The percentage of overlap in No. 3, 4 and 7 lineages is 18.31%, 7.87%, and 1.74%, respectively. See extended data in Table S1.
Figure 4
Figure 4
Methylome sequencing analysis of cancer cell lines derived from CTC-PDx mice (A) The level and distribution of significant methylation (hypermethylation) and demethylation (hypomethylation) changes, relative to the parental cell line, for primary tumor (PRI)-, CTC- and Metastasis (META)-derived cell lines near the transcription start sites. Solid and dashed lines indicate hypomethylation and hypermethylation, respectively. (B) Numbers of significant methylation changes between parental cell line (control) and primary tumor (PRI), CTC, and metastasis (META)-derived cell lines are shown. (C) The relative methylation level of 76 specific CpG islands in primary tumor (PRI)-, CTC- and metastasis (META)-derived cell lines is shown. The 76 CpG island sites, which were only significantly different when comparing primary tumor and CTC lines, but not primary and tumor-metastasis lines, are arranged along the X axis. Average methylation changes relative to the parental cell for the 76 CpG islands are shown on the Y axis. A negative methylation value indicates lower methylation than the parental line. See extended data in Table S2.
Figure 5
Figure 5
Results of RNA sequencing analysis and downstream validation of the 4T1-derived cancer cell lines (A) (a) Multi-dimensional scaling (MDS) plot of nine sublines derived from the CTC-PDx mice compared to the 4T1 cell line, and pancreatic, lung, and colon tumor cell lines is shown on the left. A zoomed-in view of colon and breast tumor cell line clusters was shown on the right. Data for the 4T1 cell line (Breast Cancer) was obtained from the link: https://www.ebi.ac.uk/ena/browser/view/ERR454052; CT26 (Colon Cancer): https://www.ebi.ac.uk/ena/data/view/SRX5833199; MC38 (Colon Cancer): https://www.ebi.ac.uk/ena/data/view/SRX5833178;A-8 (Pancreatic Cancer) https://www.ebi.ac.uk/ena/data/view/SRX7114429; K14-L (Lung tumor): https://www.ebi.ac.uk/ena/data/view/SRX4606402; K14-H (Lung tumor): https://www.ebi.ac.uk/ena/data/view/SRX4606404. (b-c) MDS plots of META and PRI or CTC sublines from same lineage based on TPM values in RNA-seq results (b), or TPM of EMT-related genes (c). (B) Hierarchical clustering analysis of primary, circulating and metastatic tumor-derived sublines. Differentially expressed genes (DE-Gs) based on the comparison between PRI, CTC and META cell lines using Padj<0.05 threshold were used to generate heatmap. The heatmap was generated using ClustVis (https://biit.cs.ut.ee/clustvis/). The clustering distance is calculated with correlation and average methods between cell lines (column) and genes (rows). (C) The EMT score analysis of all sublines. The average EMT scores of PRI, CTC, and META-derived sublines and individual sublines were shown. An EMT score closer to 1.0 represent more mesenchymal-like (Mes) characteristic, whereas an EMT score closer to −1.0 represent more epithelial-like (Epi) characteristic. (D and E) Tables showing the TPM values of selected epithelial markers (D, green color) and mesenchymal markers (E, blue color) in the indicated cell lines derived from CTC-PDx mice based on DESeq2 analysis of RNAseq data (mean ± SD; ∗: p< 0.05, ∗∗: p< 0.01, for PRI versus CTC or META; #: p< 0.05, ##: p< 0.01 for CTC versus META based on DESeq2 analysis and validated using qRT-PCR shown in Figure S8B). See extended data in Tables S3, S4, and S5.
Figure 6
Figure 6
Anti-cancer drug response of human patient-derived cultures (A) Cell viability tests using needle biopsy and CTC cultures treated with different anti-cancer drugs. Needle-biopsy (left) and CTC (right) spheroid cultures were treated with the indicated anti-cancer drugs at a dose of 0.1, 0.3, 1 or 3 Cmax, and the relative cell viability of each treatment was measured 72 h after drug treatment. Relative cell viability was calculated by comparing the absolute luminescence intensity before (at time 0) and after (72 h) drug treatment and was used to determine the effectiveness of the chemotherapeutic drug. ∗p<0.05, ∗∗p<0.01, ∗∗∗p<0.001 and ∗∗∗∗p<0.0001 denotes statistical significance comparing to Mock group (negative control, 0.5 % DMSO treatment) using Student’s ttest. Results are mean ± SEM (n = 3). (B) A time-course of epirubicin and palbociclib effects on needle biopsy (left) and CTC (right) cultures. Relative cell viability of CTC-derived spheroids, compared to Mock and palbociclib treatment at a dose of 1 Cmax and at the indicated time points. Results are mean ± SEM (n = 3). ∗p<0.0001 (two-way ANOVA).ns: no significant difference. (C) (a-d) CT images of the breast cancer patient before and after combinatorial treatment with epirubicin. (a) The CT images of the primary tumor before (upper) and after (lower) the treatment. The primary tumor is indicated by a white rectangle. The upper right figure is an enlargement of the upper left image. The tumor size (measured in length) is indicated by the yellow line. (b-d) CT images of liver metastasis (b), lung metastasis 1 (c), and lung metastasis 2 (d) before (upper) and after (lower) the treatment. An enlarged image of the metastasis is shown on the right, and the further enlarged image is shown in the black box. The metastatic tumor is indicated by the red arrow, and the size by the yellow line. (e) The disease tracking record and treatment response of the breast cancer patient. Tumor size before and after treatment was measured in mm as indicated by the yellow line shown in (a-d). Response rate was measured as size after treatment divided by size before treatment. Patient drug response is indicated as PD for progressive disease (>120%); SD, stable disease (<30%); PR, partial response (>30%).
Figure 7
Figure 7
Summary of the qualitative characteristics of primary tumor, CTC, and metastatic tumor-derived sublines As tumor metastasis progress, cells demonstrate reduced adhesion, increased migration/invasion, increased hypomethylation near transcription start sites (TSSs) and enhanced mesenchymal/reduced epithelial gene expression.-, + and ++ indicate very low, medium and high activity, respectively, and the activity increase accordingly to the number of symbol. The bigger the E and M size the stronger epithelial and mesenchymal characteristics, respectively, are. Bigger Hypo means more hypomethylation near TSSs.

References

    1. Aceto N., Bardia A., Miyamoto D.T., Donaldson M.C., Wittner B.S., Spencer J.A., Yu M., Pely A., Engstrom A., Zhu H., et al. Circulating tumor cell clusters are oligoclonal precursors of breast cancer metastasis. Cell. 2014;15:1110–1122. doi: 10.1016/j.cell.2014.07.013. - DOI - PMC - PubMed
    1. Aceto N., Toner M., Maheswaran S., Haber D.A. En route to metastasis: circulating tumor cell clusters and epithelial-to-mesenchymal transition. Trends Cancer. 2015;1:44–52. - PubMed
    1. Akalin A., Kormaksson M., Li S., Garrett-Bakelman F.E., Figueroa M.E., Melnick A., Mason C.E. methylKit: a comprehensive R package for the analysis of genome-wide DNA methylation profiles. Genome Biol. 2012;13:R87. doi: 10.1186/gb-2012-13-10-r87. - DOI - PMC - PubMed
    1. Bidard F.C., Jacot W., Kiavue N., Dureau S., Kadi A., Brain E., Bachelot T., Bourgeois H., Gonçalves A., Ladoire S., et al. Efficacy of circulating tumor cell count-driven vs clinician-driven first-line therapy choice in hormone receptor-positive, ERBB2-negative metastatic breast cancer: the STIC CTC randomized clinical trial. JAMA Oncol. 2021;7:34–41. doi: 10.1001/jamaoncol.2020.5660. - DOI - PMC - PubMed
    1. Birkbak N.J., McGranahan N. Cancer genome evolutionary trajectories in metastasis. Cancer Cell. 2020;37:8–19. doi: 10.1016/j.ccell.2019.12.004. - DOI - PubMed