. 2022 Aug 8:11:121-131.
doi: 10.1016/j.aninu.2022.07.010. eCollection 2022 Dec.

The mechanistic target of rapamycin complex 1 pathway involved in hepatic gluconeogenesis through peroxisome-proliferator-activated receptor γ coactivator-1 α

Affiliations

The mechanistic target of rapamycin complex 1 pathway involved in hepatic gluconeogenesis through peroxisome-proliferator-activated receptor γ coactivator-1 α

Guoyan Wang et al. Anim Nutr. .

Abstract

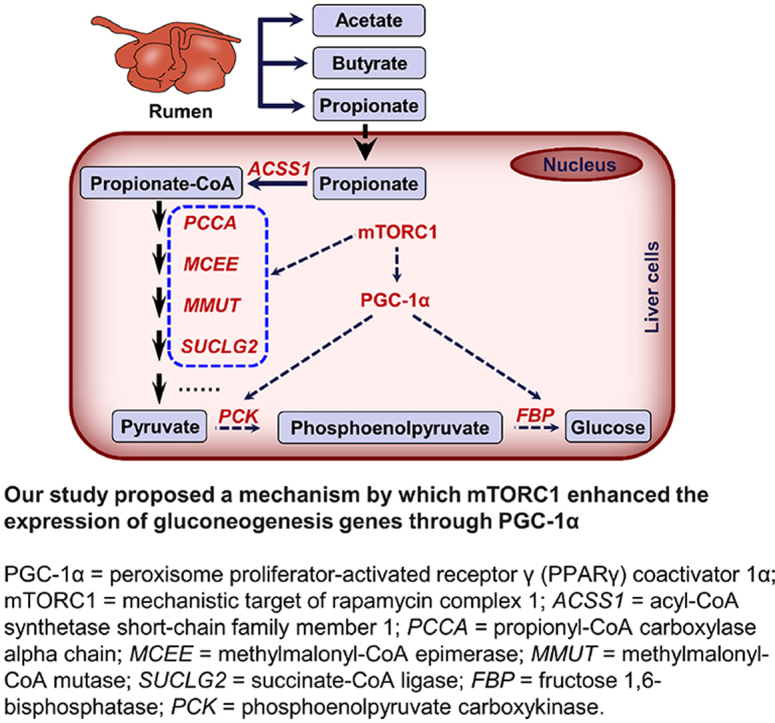
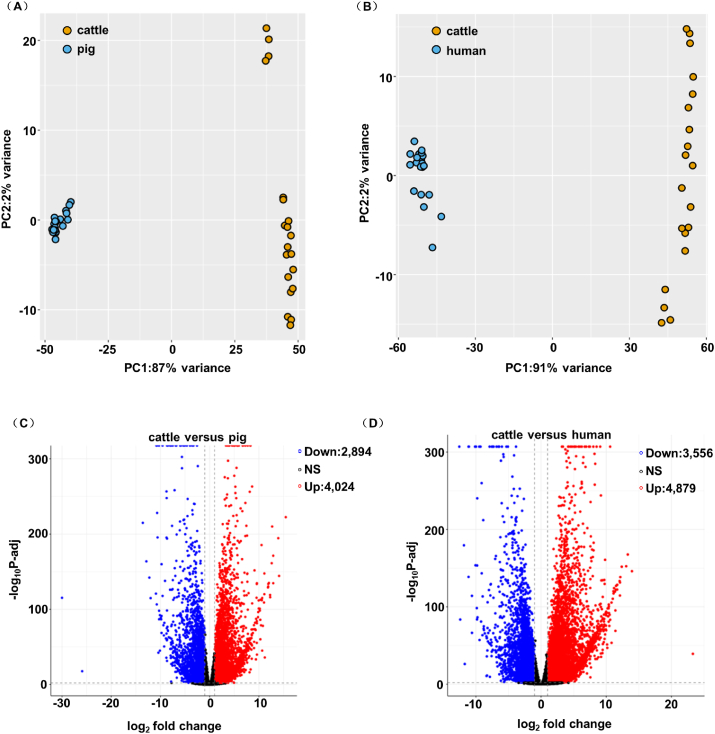
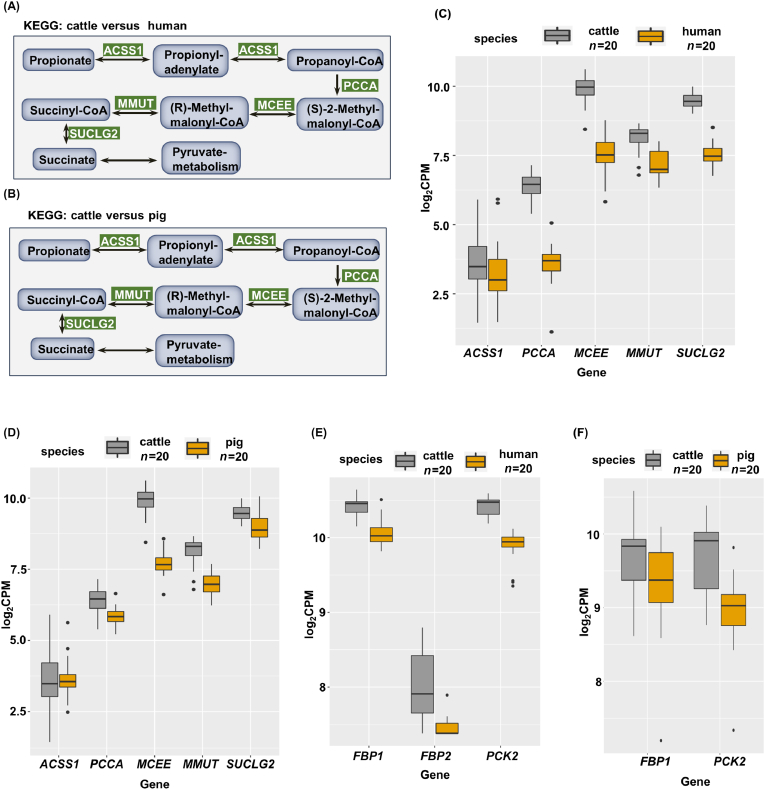
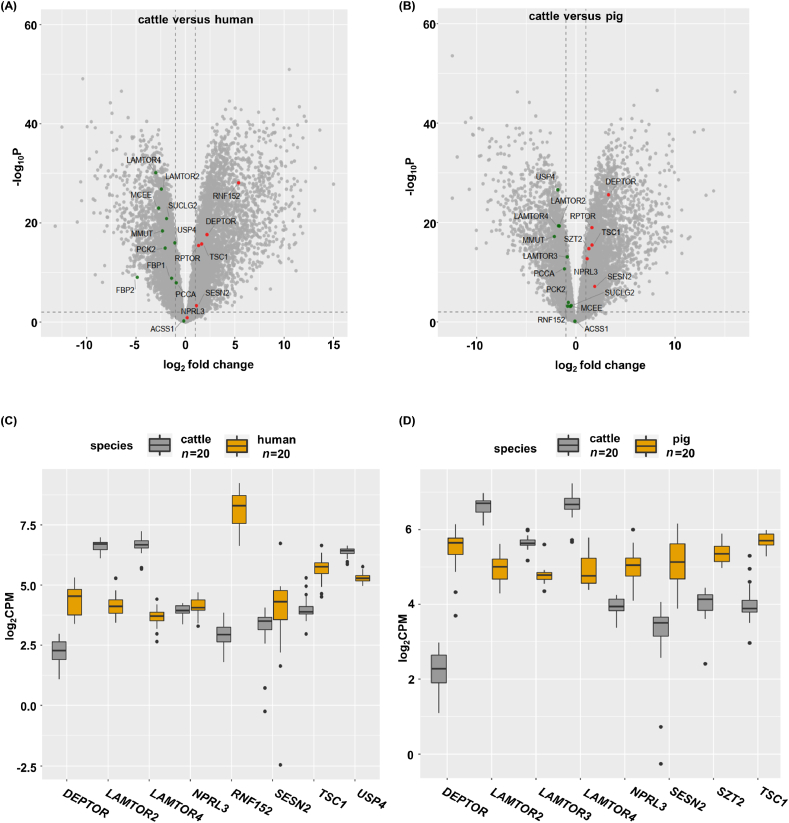
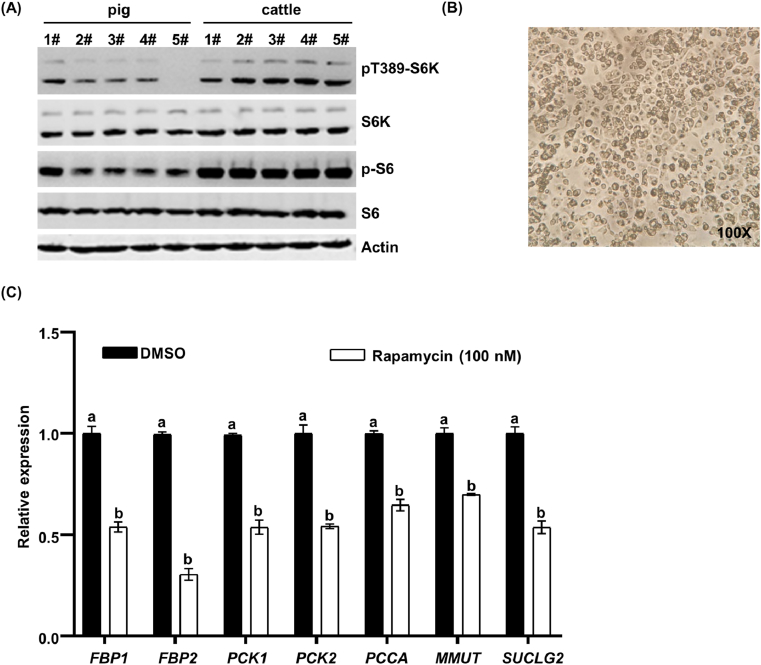
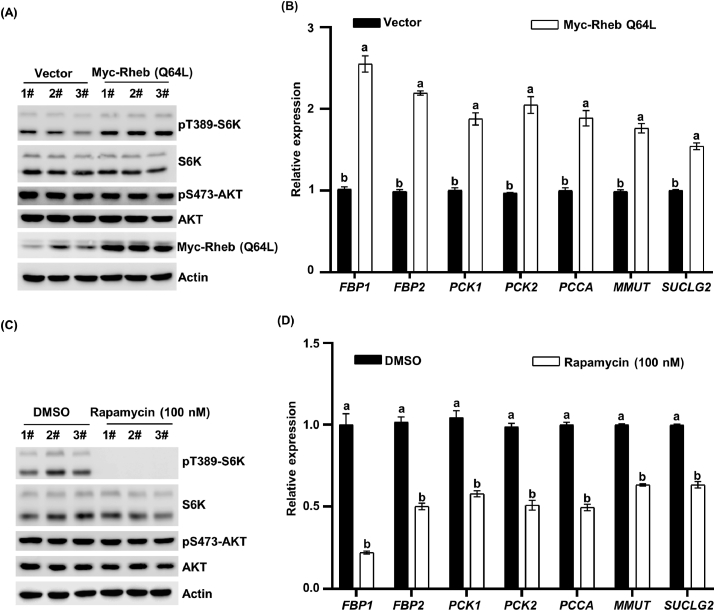
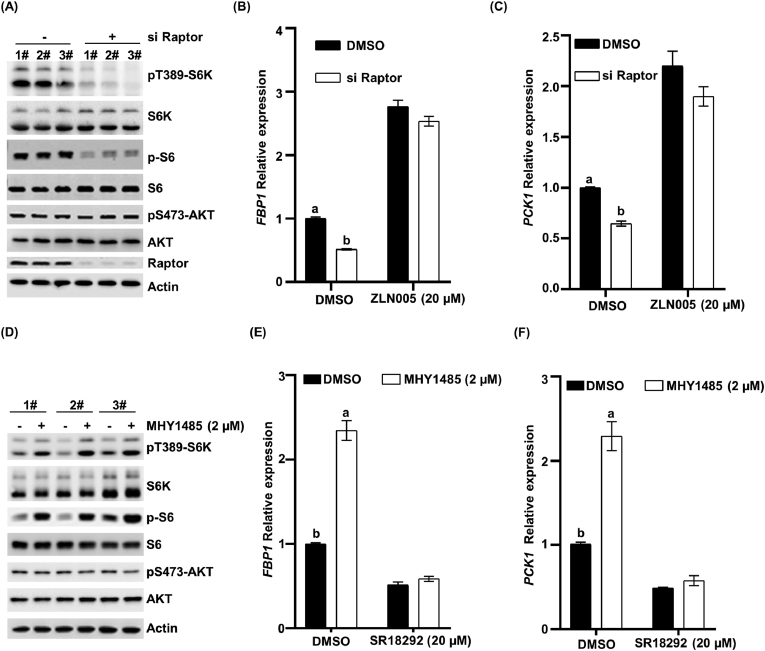
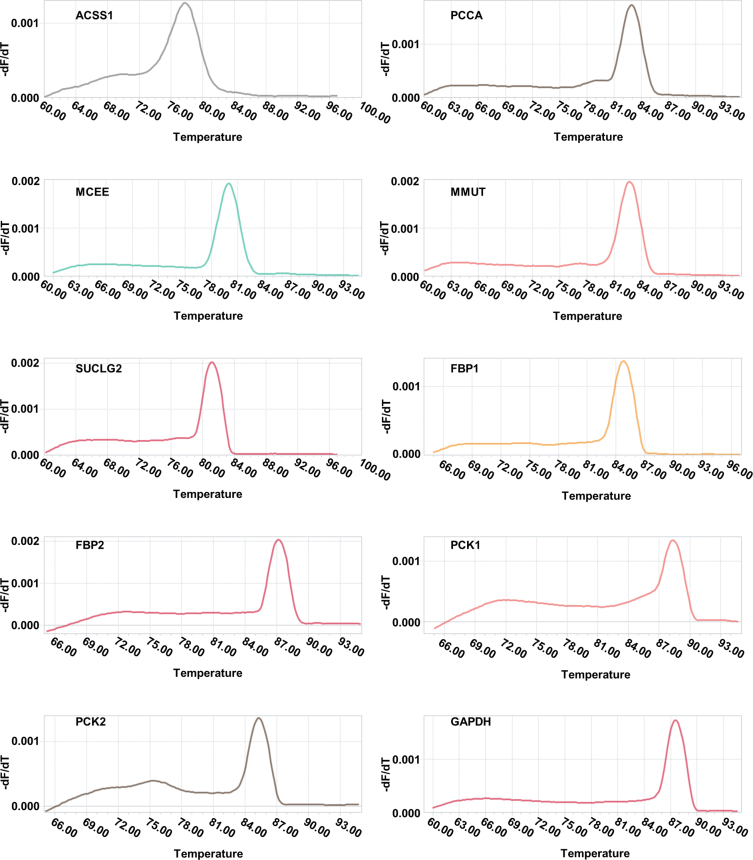
Cattle can efficiently perform de novo generation of glucose through hepatic gluconeogenesis to meet post-weaning glucose demand. Substantial evidence points to cattle and non-ruminant animals being characterized by phylogenetic features in terms of their differing capacity for hepatic gluconeogenesis, a process that is highly efficient in cattle yet the underlying mechanism remains unclear. Here we used a variety of transcriptome data, as well as tissue and cell-based methods to uncover the mechanisms of high-efficiency hepatic gluconeogenesis in cattle. We showed that cattle can efficiently convert propionate into pyruvate, at least partly, via high expression of acyl-CoA synthetase short-chain family member 1 (ACSS1), propionyl-CoA carboxylase alpha chain (PCCA), methylmalonyl-CoA epimerase (MCEE), methylmalonyl-CoA mutase (MMUT), and succinate-CoA ligase (SUCLG2) genes in the liver (P < 0.01). Moreover, higher expression of the rate-limiting enzymes of gluconeogenesis, such as phosphoenolpyruvate carboxykinase (PCK) and fructose 1,6-bisphosphatase (FBP), ensures the efficient operation of hepatic gluconeogenesis in cattle (P < 0.01). Mechanistically, we found that cattle liver exhibits highly active mechanistic target of rapamycin complex 1 (mTORC1), and the expressions of PCCA, MMUT, SUCLG2, PCK, and FBP genes are regulated by the activation of mTORC1 (P < 0.001). Finally, our results showed that mTORC1 promotes hepatic gluconeogenesis in a peroxisome proliferator-activated receptor γ coactivator 1α (PGC-1α) dependent manner. Collectively, our results not only revealed an important mechanism responsible for the quantitative differences in the efficiency of hepatic gluconeogenesis in cattle versus non-ruminant animals, but also established that mTORC1 is indeed involved in the regulation of hepatic gluconeogenesis through PGC-1α. These results provide a novel potential insight into promoting hepatic gluconeogenesis through activated mTORC1 in both ruminants and mammals.

Keywords: Cattle; Hepatic gluconeogenesis; Peroxisome-proliferator-activated receptor γ coactivator-1α; mTORC1.


Conflict of interest statement

We declare that we have no financial and personal relationships with other people or organizations that can inappropriately influence our work, and there is no professional or other personal interest of any nature or kind in any product, service and/or company that could be construed as influencing the content of this paper.

Figures

Image 1
Graphical abstract
Fig. 1
Fig. 1
Differently expressed genes in cattle and non-ruminants. (A and B) Principal component analysis (PCA) plots from the whole transcriptome of cattle versus pig or human liver tissues. Different colors correspond to different species. Yellow PCA plots represent the cattle liver transcriptome data (n = 20). Blue PCA plots represent the pig or human livers' transcriptome data (n = 20). (C and D) Volcano plot for the differentially expressed genes (DEGs) of liver of cattle compared with that of pig or human. Red points are up-regulated DEGs. Blue points are down-regulated DEGs. Black points are those genes neither significantly up- nor down-regulated. The cut-off used to designate a DEG was an adjusted P < 0.01.
Fig. 2
Fig. 2
Propionate metabolism and gluconeogenesis genes are highly expressed in cattle. (A and B) Differential expression of propionate metabolism genes in the liver of cattle versus that of human or pig in the Kyoto Encyclopaedia of Genes and Genomes (KEGG) propionate pathway. Green indicates the genes found up-regulated in cattle liver tissue, P < 0.01. (C and D) The expression of acyl-CoA synthetase short-chain family member 1 (ACSS1), propionyl-CoA carboxylase alpha chain (PCCA), methylmalonyl-CoA epimerase (MCEE), methylmalonyl-CoA mutase (MMUT), and succinate-CoA ligase (SUCLG2) in the liver of cattle compared with that of human and pig. Grey indicates cattle, and yellow indicates human or pig (n = 20), P < 0.01. (E and F) Differential expression of fructose 1,6-bisphosphatase 1 (FBP1), FBP2, and phosphoenolpyruvate carboxykinase (PCK2) in the liver of cattle compared with that of human or pig. Grey indicates cattle, and yellow indicates human or pig (n = 20), P < 0.01.
Fig. 3
Fig. 3
The activation of mechanistic target of rapamycin complex 1 (mTORC1) is strongly induced in the liver of cattle. (A and B) Volcano plot for the differentially expressed genes (DEGs) in the liver of cattle compared with that of human or pig. Red points are down-regulated DEGs. Green points are up-regulated DEGs. The cut-off used to designate a DEG was an adjusted P < 0.01. (C and D) DEGs of mTORC1 signaling in the liver of cattle, human, and pig. Grey indicates cattle, and yellow indicates human or pig (n = 20), P < 0.01.
Fig. 4
Fig. 4
Increased gluconeogenesis genes are regulated by mechanistic target of rapamycin complex 1 (mTORC1) signaling in cattle. (A) The activation of mTORC1 in calf and pig liver tissues was monitored by measuring the phosphorylation of P70 ribosomal S6 kinase 1 (S6K1) and S6. (B) Primary hepatocyte cells of cattle isolated and cultured for 4 h were observed under a microscope (OLYMPUS CKX53, Japan). (C) The primary hepatocyte cells of calf were treated with rapamycin for 24 h, and endogenous expression of FBP1, FBP2, PCK1, PCK2, PCCA, MMUT, and SUCLG2 genes was examined by RT-qPCR. Statistical significance was determined as the mean ± SEM. a, b Bars with a different letter mean a significant difference (P < 0.001). DMSO = dimethyl sulfoxide.
Fig. 5
Fig. 5
Activated mechanistic target of rapamycin complex 1 (mTORC1) pathway could increase the gluconeogenesis in human hepatic cell lines (LO2 cells). (A) Overexpression of Myc-Rheb Q64L in LO2 cells and the indicated protein was detected using a Western blot. (B) Overexpression of Myc-Rheb Q64L in LO2 cells, and endogenous expression of FBP1, FBP2, PCK1, PCK2, PCCA, MMUT, and SUCLG2 genes was examined by RT-qPCR. Statistical significance was determined as the mean ± SEM. a, b Bars with a different letter mean a significant difference (P < 0.001). (C) LO2 cells were treated with rapamycin for 24 h, and the indicated protein was detected using a Western blot. (D) LO2 cells were treated with rapamycin for 24 h, and endogenous expression of FBP1, FBP2, PCK1, PCK2, PCCA, MMUT, and SUCLG2 genes was examined by RT-qPCR. Statistical significance was determined as the mean ± SEM. a, b Bars with a different letter mean a significant difference (P < 0.001). DMSO = dimethyl sulfoxide.
Fig. 6
Fig. 6
Mechanistic target of rapamycin complex 1 (mTORC1) pathway promotes gluconeogenesis gene expression through peroxisome proliferator-activated receptor γ (PPARγ) coactivator 1α (PGC-1α). (A) Knockdown raptor in hepatic cell lines (LO2 cells) and the indicated protein was detected via Western blot. (B and C) The LO2 cells with or without knockdown raptor were treated with ZLN005 (20 μM) for 24 h, and the endogenous expression of FBP1 and PCK1 was examined by RT-qPCR. Statistical significance was determined as the mean ± SEM. a, b Bars with a different letter mean a significant difference (P < 0.001). (D) The LO2 cells were treated with MHY1485 (2 μM) for 24 h, and the indicated protein was detected via Western blot. (E and F) The LO2 cells were treated with SR18292 (20 μM) alone or in combination with MHY1485 (2 μM) for 24 h. The endogenous expression of FBP1, PCK1 was examined by RT-qPCR. Statistical significance was determined as the mean ± SEM. a, b Bars with a different letter mean a significant difference (P < 0.001). DMSO = dimethyl sulfoxide.
Fig. S1
figs1
Fig. S2
figs2

References

    1. Alexandre P.A., Kogelman L.J.A., Santana M.H.A., Passarelli D., Pulz L.H., Fantinato-Neto P., et al. Liver transcriptomic networks reveal main biological processes associated with feed efficiency in beef cattle. BMC Genom. 2015;16:1073. - PMC - PubMed
    1. Aschenbach J.R., Kristensen N.B., Donkin S.S., Hammon H.M., Penner G.B. Gluconeogenesis in dairy cows: the secret of making sweet milk from sour dough. IUBMB Life. 2010;62:869–877. - PubMed
    1. Bar-Peled L., Chantranupong L., Cherniack A.D., Chen W.W., Ottina K.A., Grabiner B.C., et al. A Tumor suppressor complex with GAP activity for the Rag GTPases that signal amino acid sufficiency to mTORC1. Science. 2013;340:1100–1106. - PMC - PubMed
    1. Bar-Peled L., Schweitzer L.D., Zoncu R., Sabatini D.M. Ragulator is a GEF for the rag GTPases that signal amino acid levels to mTORC1. Cell. 2012;150:1196–1208. - PMC - PubMed
    1. Bergman E.N. Energy contributions of volatile fatty acids from the gastrointestinal tract in various species. Physiol Rev. 1990;70:567–590. - PubMed

LinkOut - more resources