

The expression and methylation of PITX genes is associated with the prognosis of head and neck squamous cell carcinoma
- PMID: 36204311
- PMCID: PMC9530742
- DOI: 10.3389/fgene.2022.982241
The expression and methylation of PITX genes is associated with the prognosis of head and neck squamous cell carcinoma
Abstract
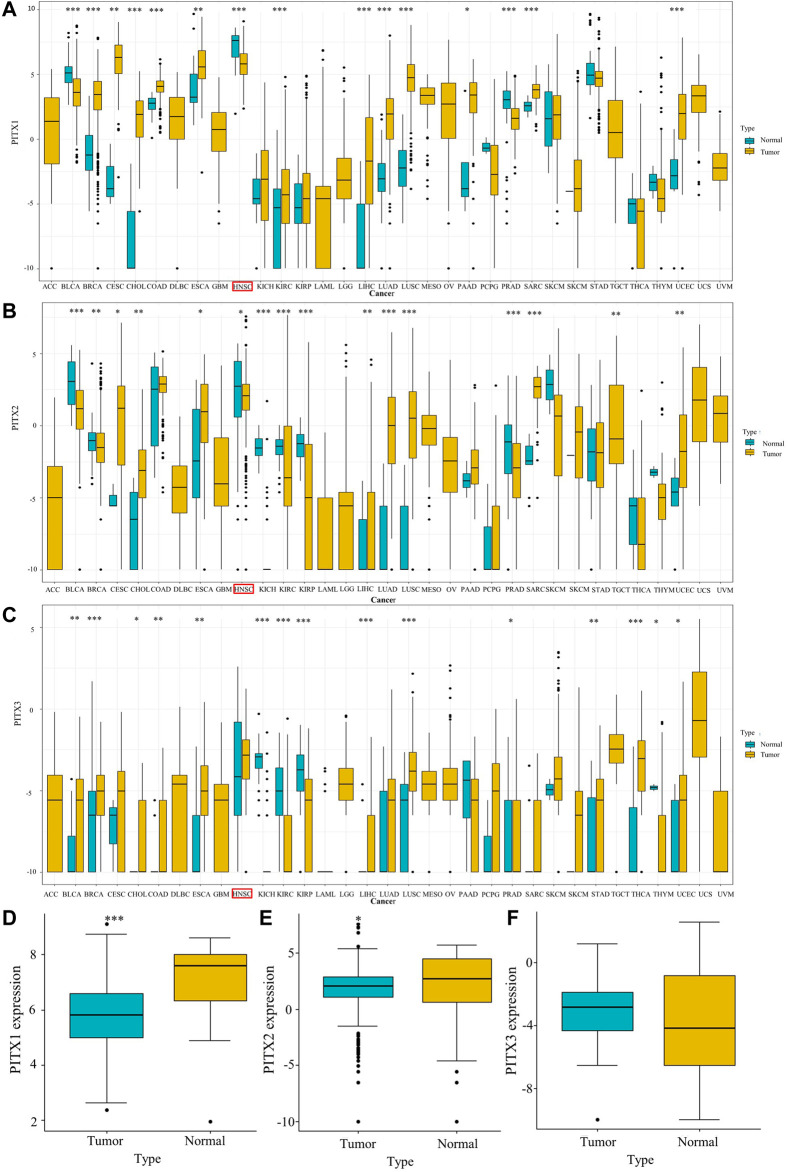
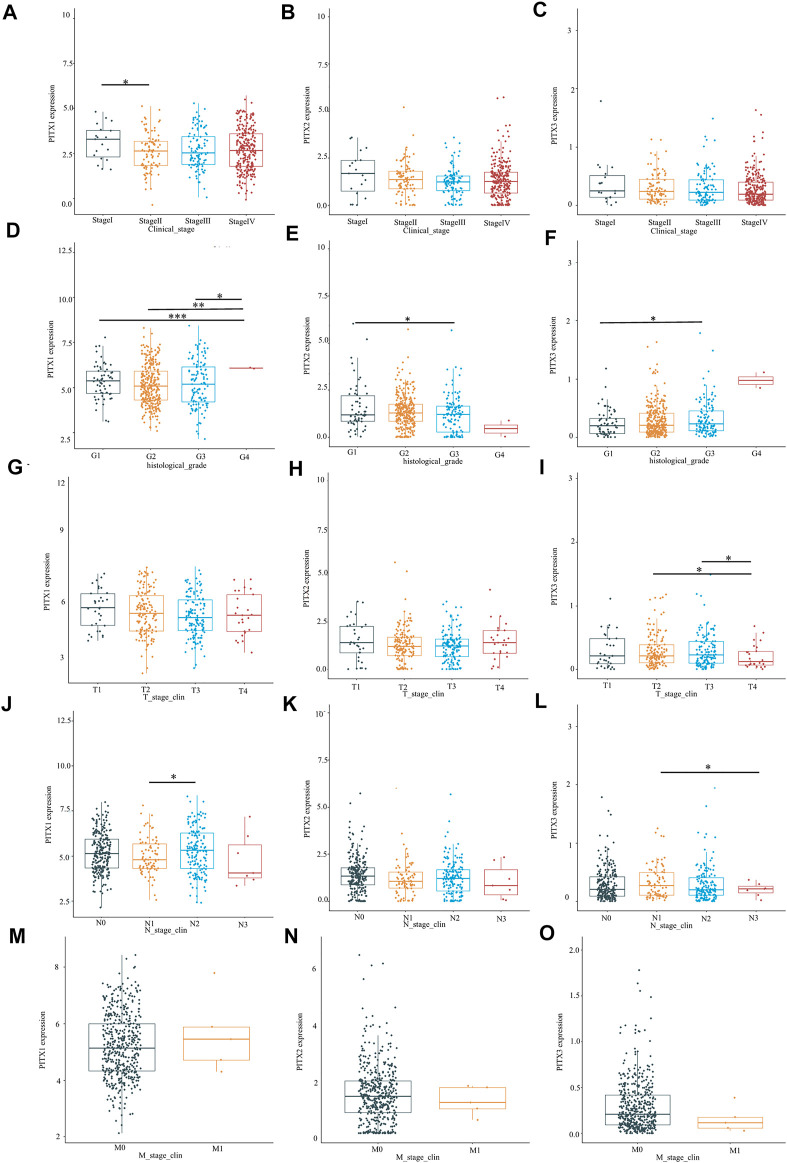
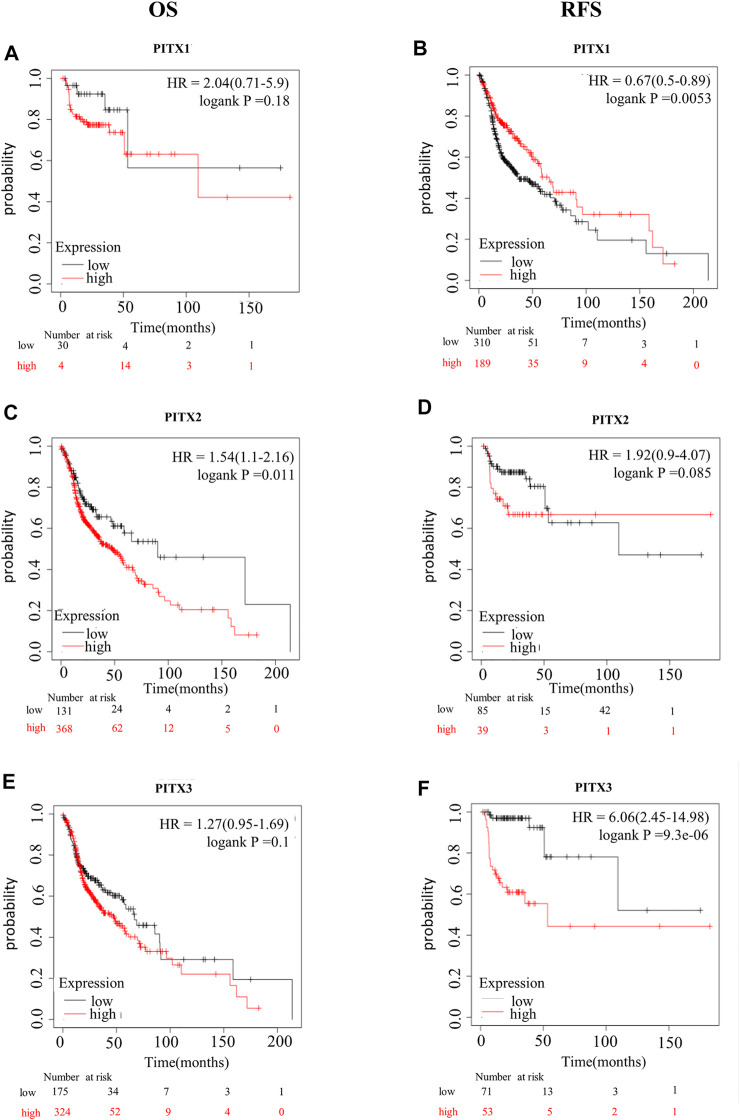
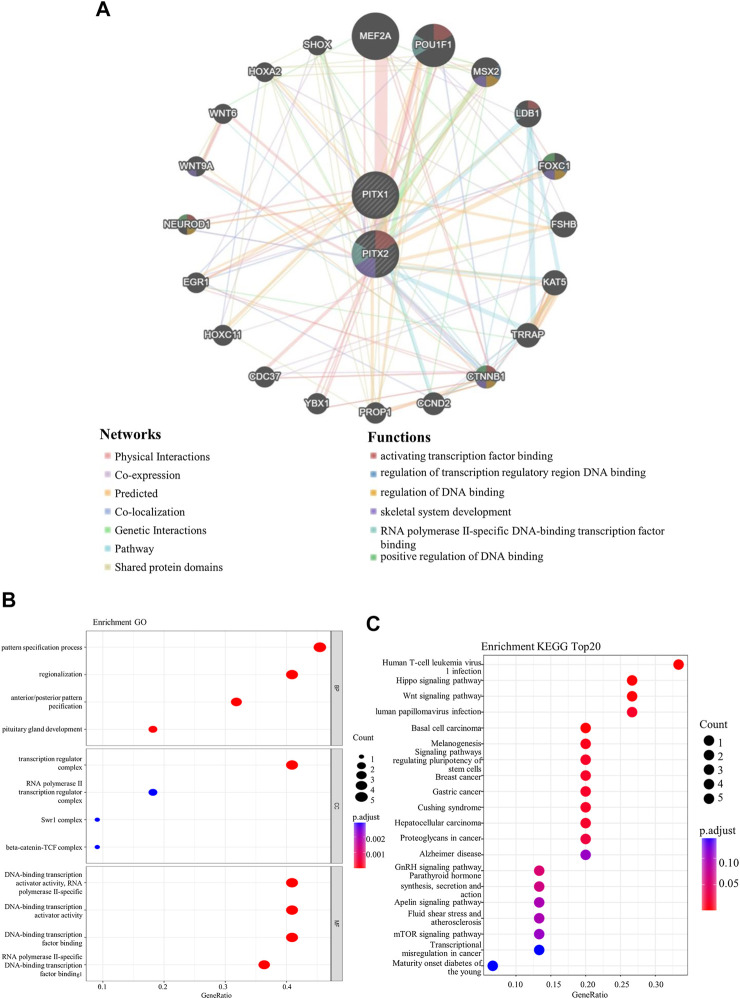
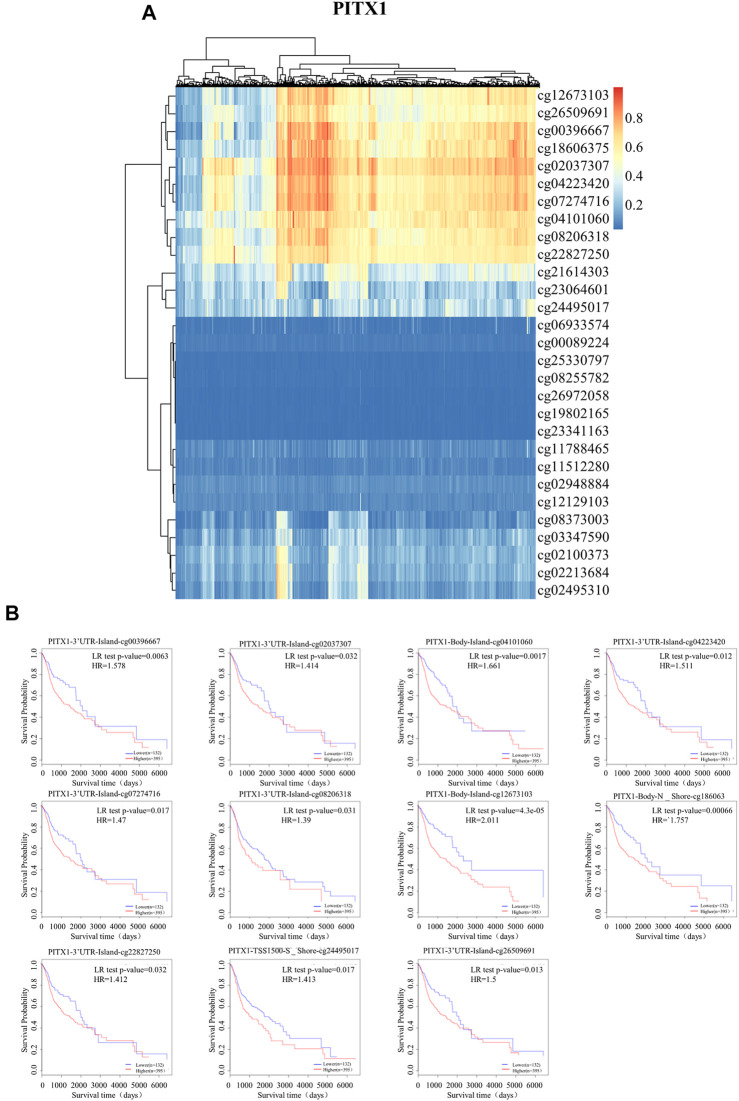
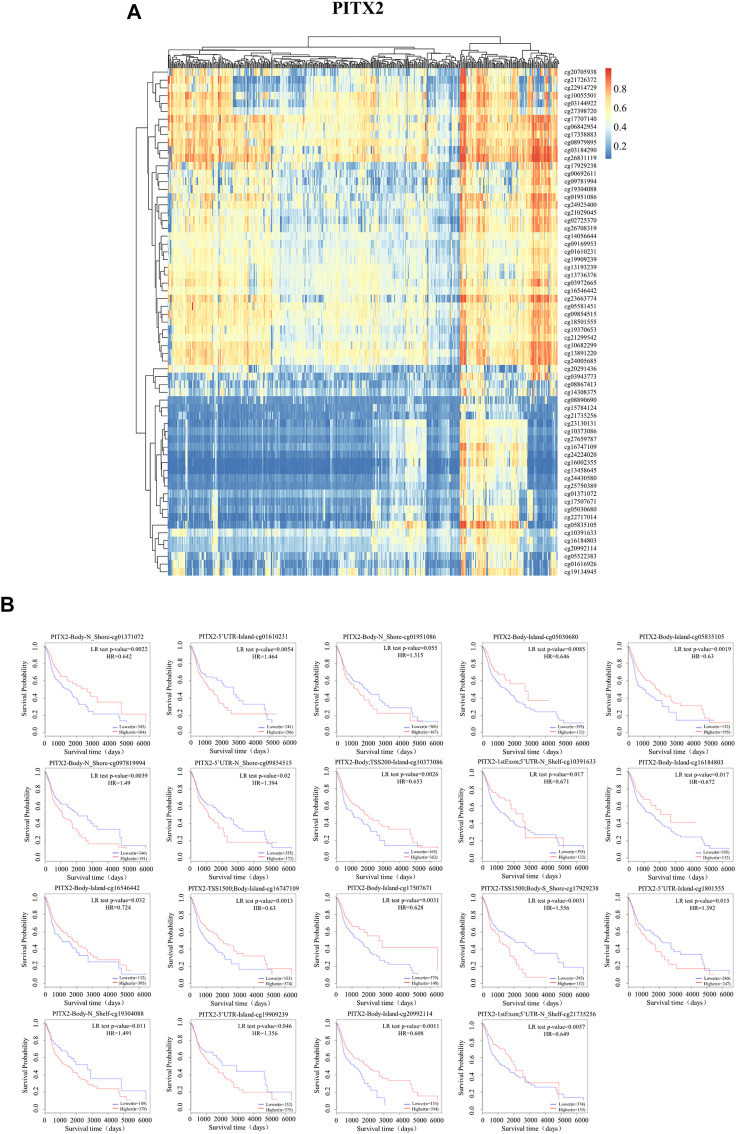
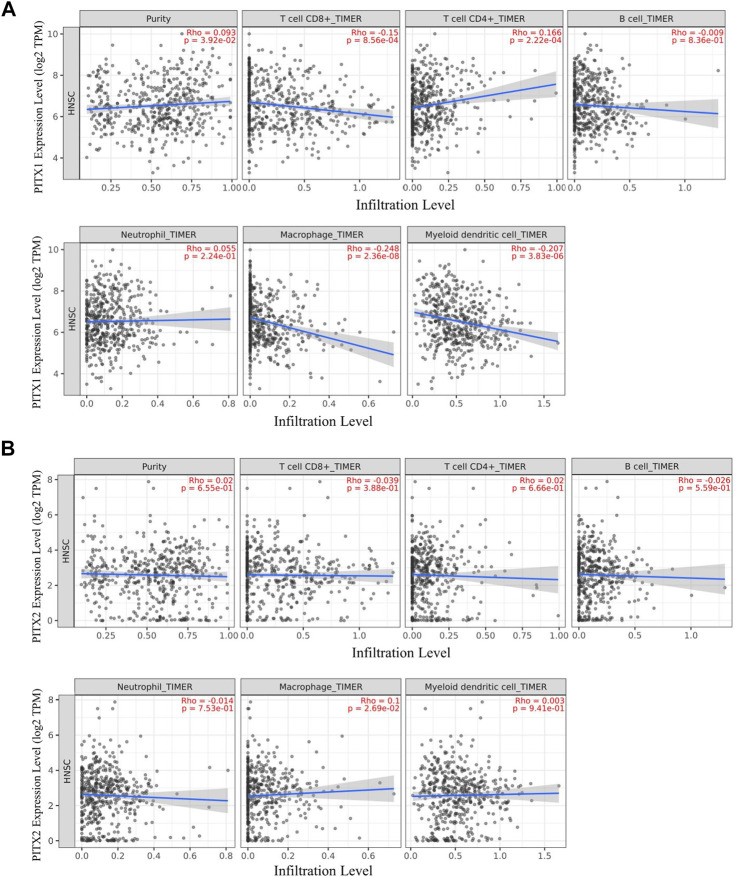
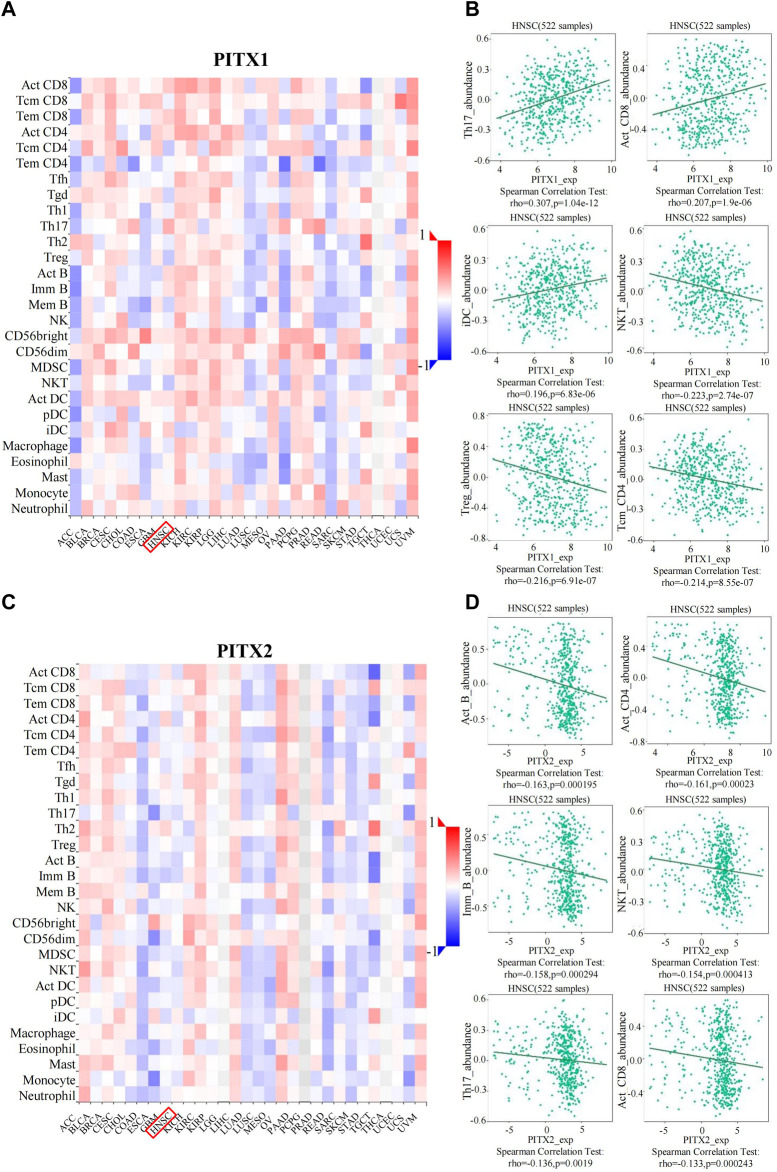
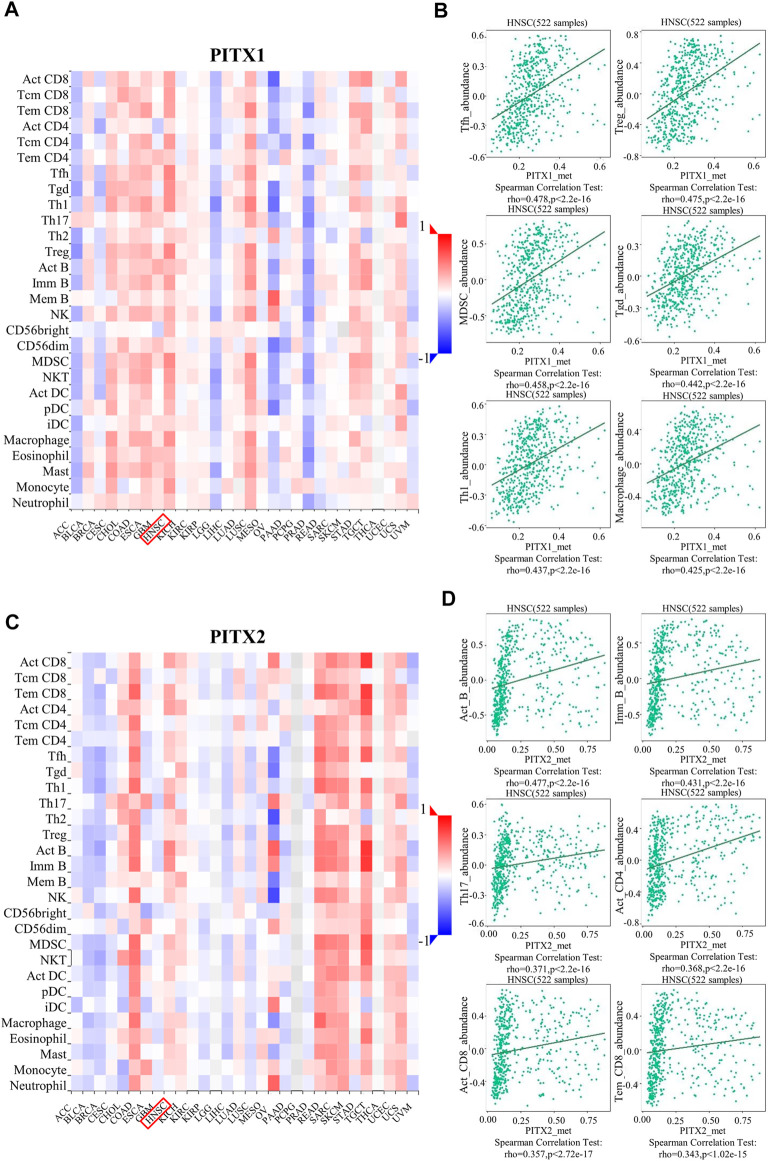
Background: The PITX gene family, comprising PITX1, PITX2, and PITX3, is critical in organogenesis and has been evolutionary conserved in animals. PITX genes are associated with the advanced progression and poor prognosis of multiple cancers. However, the relationship between the PITX genes and head and neck squamous cell carcinoma (HNSC) has not been reported. Methods: We used data from The Cancer Genome Atlas (TCGA) to analyze the association between PITX mRNA expression and clinicopathological parameters of patients with HNSC. The prognostic value of PITX genes was evaluated using the Kaplan-Meier plotter. Multivariate Cox analysis was used to screen out prognosis-associated genes to identify better prognostic indicators. The potential roles of PITX1 and PITX2 in HNSC prognosis were investigated using the protein-protein interaction (PPI) network, Gene Ontology (GO) analysis, and the Kyoto Encyclopedia of Genes and Genomes (KEGG) analysis. The correlation between PITX1 and PITX2 expression or methylation and immune cell infiltration was evaluated using the tumor-immune system interaction database (TISIDB). MethSurv was used to identify DNA methylation and its effect on HNSC prognosis. Results: PITX genes expression was correlated with different cancers. PITX1 and PITX2 expression was lower in the patients with HNSC. In HNSC, PITX1 expression was significantly related to the clinical stage, histologic grade, and N stage, while PITX2 expression was only significantly related to the histologic grade. The high expression of PITX3 was significantly related to the histologic grade, T stage, and N stage. Survival analysis revealed that PITX genes had prognostic value in HNSC, which was supported by multivariate Cox analysis. PPI network and enrichment analysis showed that the genes interacting with PITX1 and PITX2 belonged predominantly to signaling pathways associated with DNA binding and transcription. Of the CpG DNA methylation sites in PITX1 and PITX2, 28 and 22 were related to the prognosis of HNSC, respectively. Additionally, PITX1 and PITX2 expression and methylation was associated with tumor-infiltrating lymphocytes (TILs). Conclusion: The PITX genes were differentially expressed in patients with HNSC, highlighting their essential role in DNA methylation and tumor-infiltrating immune cell regulation, as well as overall prognostic value in HNSC.
Keywords: Bioinformatic analysis; DNA Methylation; HNSC; PITX gene family; prognosis.
Copyright © 2022 Zhao, Zhao, Zhong, Zhang, Yan, Feng and Guo.
Conflict of interest statement
The authors declare that the research was conducted in the absence of any commercial or financial relationships that could be construed as a potential conflict of interest.
Figures
Similar articles
-
PITX1 plays essential functions in cancer.Front Oncol. 2023 Sep 29;13:1253238. doi: 10.3389/fonc.2023.1253238. eCollection 2023. Front Oncol. 2023. PMID: 37841446 Free PMC article. Review.
-
Integrated analysis of diagnostic, prognostic value and potential drug treatment of GSDME in head and neck squamous cell carcinoma.Eur Arch Otorhinolaryngol. 2023 Sep;280(9):4239-4253. doi: 10.1007/s00405-023-08022-9. Epub 2023 May 19. Eur Arch Otorhinolaryngol. 2023. PMID: 37204444
-
Prognostic biomarker GSTK1 in head and neck squamous cell carcinoma and its correlation with immune infiltration and DNA methylation.Front Genet. 2023 Mar 3;14:1041042. doi: 10.3389/fgene.2023.1041042. eCollection 2023. Front Genet. 2023. PMID: 36936420 Free PMC article.
-
Spermine synthase (SMS) serves as a prognostic biomarker in head and neck squamous cell carcinoma: a bioinformatics analysis.Ann Transl Med. 2022 Nov;10(22):1213. doi: 10.21037/atm-22-5014. Ann Transl Med. 2022. PMID: 36544695 Free PMC article.
-
Pitx genes in development and disease.Cell Mol Life Sci. 2021 Jun;78(11):4921-4938. doi: 10.1007/s00018-021-03833-7. Epub 2021 Apr 12. Cell Mol Life Sci. 2021. PMID: 33844046 Free PMC article. Review.
Cited by
-
Overexpression of GNPDA1 in head and neck squamous cell carcinoma: Prognostic significance, immune infiltration, and correlation with cancer cell immune evasion.Medicine (Baltimore). 2025 May 23;104(21):e42561. doi: 10.1097/MD.0000000000042561. Medicine (Baltimore). 2025. PMID: 40419932 Free PMC article.
-
TRIB3, as a robust prognostic biomarker for HNSC, is associated with poor immune infiltration and cancer cell immune evasion.Front Immunol. 2024 Jan 3;14:1290839. doi: 10.3389/fimmu.2023.1290839. eCollection 2023. Front Immunol. 2024. PMID: 38235126 Free PMC article.
-
Mesenchymal stem cells in the bone marrow microenvironment: a double-edged sword for AML.J Cancer Res Clin Oncol. 2025 Jun 21;151(6):193. doi: 10.1007/s00432-025-06244-4. J Cancer Res Clin Oncol. 2025. PMID: 40542231 Free PMC article. Review.
-
PITX1 as a grading, prognostic and tumor-infiltrating immune cells marker for chondrosarcoma: a public database-based immunoassay and tissue sample analysis.Front Oncol. 2025 Apr 11;15:1477649. doi: 10.3389/fonc.2025.1477649. eCollection 2025. Front Oncol. 2025. PMID: 40342824 Free PMC article.
-
PITX1 plays essential functions in cancer.Front Oncol. 2023 Sep 29;13:1253238. doi: 10.3389/fonc.2023.1253238. eCollection 2023. Front Oncol. 2023. PMID: 37841446 Free PMC article. Review.
References
LinkOut - more resources
Full Text Sources