. 2022 Jul 1;6(3):702-721.
doi: 10.1162/netn_a_00254. eCollection 2022 Jul.

Empirical evaluation of human fetal fMRI preprocessing steps

Affiliations

Empirical evaluation of human fetal fMRI preprocessing steps

Lanxin Ji et al. Netw Neurosci. .

Abstract

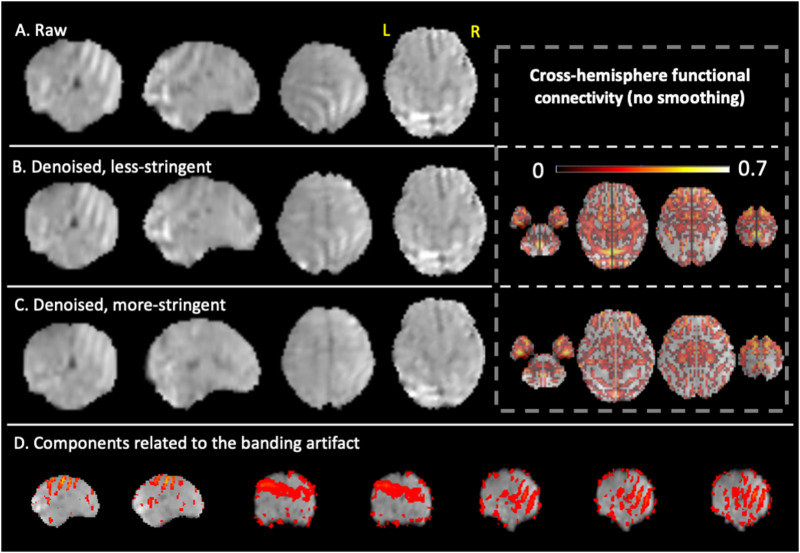
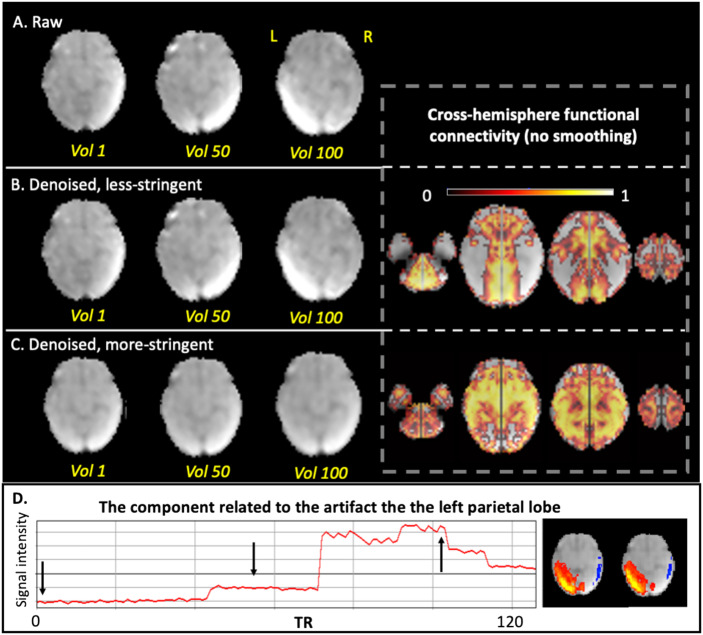
Increased study and methodological innovation have led to growth in the field of fetal brain fMRI. An important gap yet to be addressed is optimization of fetal fMRI preprocessing. Rapid developmental changes, imaged within the maternal compartment using an abdominal coil, introduce novel constraints that challenge established methods used in adult fMRI. This study evaluates the impact of (1) normalization to a group mean-age template versus normalization to an age-matched template; (2) independent components analysis (ICA) denoising at two criterion thresholds; and (3) smoothing using three kernel sizes. Data were collected from 121 fetuses (25-39 weeks, 43.8% female). Results indicate that the mean age template is superior in older fetuses, but less optimal in younger fetuses. ICA denoising at a more stringent threshold is superior to less stringent denoising. A larger smoothing kernel can enhance cross-hemisphere functional connectivity. Overall, this study provides improved understanding of the impact of specific steps on fetal image quality. Findings can be used to inform a common set of best practices for fetal fMRI preprocessing.

Keywords: Denoising; Fetal fMRI; Functional connectivity; Normalization; Preprocessing; Smoothing.


Figures

<b>Figure 1.</b>
Figure 1.
Workflow of the fetal fMRI preprocessing pipeline. Key steps validated in this study are colored by blue boxes.
<b>Figure 2.</b>
Figure 2.
Strategy used for less and more stringent ICA elimination. Exemplar components observed in the fetal dataset are presented above. Observation of a single failure in spatial, temporal, or frequency domains results in elimination of the component, but only at the more stringent level. Less stringent correction only eliminates components if more than one failure is observed, for example, in both spatial and temporal domains. Pass and fail examples are provided here, depicted with checkbox and cross-out, respectively. As examples of single failures, component B shows nonbiological banding patterns (positive/negative stripes), but shows acceptable time course, and component C shows a typical spatial pattern, but shows high-frequency peaks, indicative of scanner-related artifacts. Examples A–C, were eliminated only at the more stringent threshold. D and E show failures in two domains, and F and G pass both spatial and temporal analysis.
<b>Figure 3.</b>
Figure 3.
Distributions of standard deviation values after normalization, by fetal age and by template used. Fetuses of different ages were normalized either to a 32-week template (mean for the group) or to a same-age template. Voxels on the edge of the brain have lower standard deviation if they are consistently characterized the same way. The 8,000 voxels with the highest standard deviation are plotted here. Review of observed distributions suggest that the 32-week template performs more optimally for fetuses older than 32 weeks, seen in a leftward shift of 32-week values. The reverse is noted for fetuses younger than 32 weeks, where the age-matched template corresponds to a leftward shift.
<b>Figure 4.</b>
Figure 4.
Number of components estimated in FSL’s MELODIC by subjects with and without masking.
<b>Figure 5.</b>
Figure 5.
Comparison of less stringent versus more stringent ICA denoising in a representative subject, Case 1. A single volume is shown for a case (35 weeks GA) presenting severe nonbiological banding patterns. (A) Raw data with different planes. (B) Less stringently denoised data with different planes (left), and corresponding cross-hemisphere RSFC (right). (C) More stringently denoised data with different planes (left) and corresponding cross-hemisphere RSFC (right). (D) Examples of ICA noise components related to the banding artifact.
<b>Figure 6.</b>
Figure 6.
Comparison of less stringent versus more stringent ICA denoising in a representative subject, Case 2. A single volume is shown for a case with noted intensity shift. (A) Raw data of two axial slices at the 1st and 188th volumes. (B) Less stringently denoised data at the 1st and 188th volumes (left) and corresponding cross-hemisphere RSFC (right). (C) More stringently denoised data at the 1st and 188th volumes (left) and corresponding cross-hemisphere RSFC (right). (D) Time series of an example noise component.
<b>Figure 7.</b>
Figure 7.
Comparison of less stringent versus more stringent ICA denoising in a representative subject, Case 3. A single volume is shown for a case with high residual motion. (A) Raw data of one slice at the 1st, 50th, and the 100th volumes. (B) Less stringently denoised data at the 1st, 50th, and the 100th volumes (left) and corresponding cross-hemisphere RSFC (right). (C) More stringently denoised data at the 1st, 50th, and the 100th volumes (left) and corresponding cross-hemisphere RSFC (right). (D) The time course and the spatial map of the noise component corresponding to the artifact in left parietal cortex. Arrows indicate the volumes we showed in the above rows.
<b>Figure 8.</b>
Figure 8.
Group-wise comparison of different ICA denoising strategies. (A) Correlations of global mean voxel-mirrored homotopic connectivity (VMHC) with frame counts and motion parameters (XYZ mean and XYZ max for translational movements; PYR mean and PYR max for rotations). (Top row) Less stringently denoised data; (bottom row) more stringently denoised data. (B) Group mean VMHC by age group with less versus more stringent denoising methods. Asterisks (*) in front of p values indicate significant correlations.
<b>Figure 9.</b>
Figure 9.
Comparison of seed-based functional connectivity in data analyzed with more or less stringent denoising. One-sample t test was sued to compare more stringent ICA (blue) and less stringent ICA (red) (p < 0.00001, FDR corrected). Overlapping regions are shown in purple.
<b>Figure 10.</b>
Figure 10.
Group-wise comparison of different smoothing kernels. (A) Global mean VMHC changes without or with smoothing kernels of 2 mm and 4 mm. (B) Voxel-wise VMHC of a representative fetus of 37 weeks.
<b>Figure 11.</b>
Figure 11.
Fetal brain networks derived from ICA. Positive t maps threshold at t value > 6 are shown.

References

    1. Alahmadi, A. A. (2021). Effects of different smoothing on global and regional resting functional connectivity. Neuroradiology, 63(1), 99–109. 10.1007/s00234-020-02523-8, - DOI - PubMed
    1. Allen, E. A., Erhardt, E. B., Damaraju, E., Gruner, W., Segall, J. M., Silva, R. F., … Kalyanam, R. (2011). A baseline for the multivariate comparison of resting-state networks. Frontiers in Systems Neuroscience, 5, 2. 10.3389/fnsys.2011.00002, - DOI - PMC - PubMed
    1. Anderson, A. L., & Thomason, M. E. (2013). Functional plasticity before the cradle: A review of neural functional imaging in the human fetus. Neuroscience & Biobehavioral Reviews, 37(9), 2220–2232. 10.1016/j.neubiorev.2013.03.013, - DOI - PubMed
    1. Beckmann, C. F., & Smith, S. M. (2004). Probabilistic independent component analysis for functional magnetic resonance imaging. IEEE Transactions on Medical Imaging, 23(2), 137–152. 10.1109/TMI.2003.822821, - DOI - PubMed
    1. Behzadi, Y., Restom, K., Liau, J., & Liu, T. T. (2007). A component based noise correction method (CompCor) for BOLD and perfusion based fMRI. NeuroImage, 37(1), 90–101. 10.1016/j.neuroimage.2007.04.042, - DOI - PMC - PubMed

LinkOut - more resources