. 2020 May 22;6(2):veaa042.
doi: 10.1093/ve/veaa042. eCollection 2020 Jul.

When to be temperate: on the fitness benefits of lysis vs. lysogeny

Affiliations

When to be temperate: on the fitness benefits of lysis vs. lysogeny

Guanlin Li et al. Virus Evol. .

Abstract

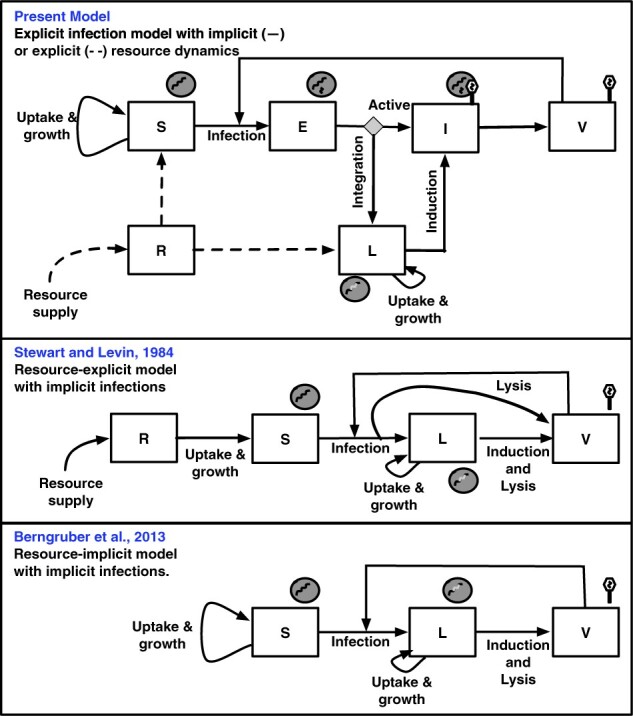
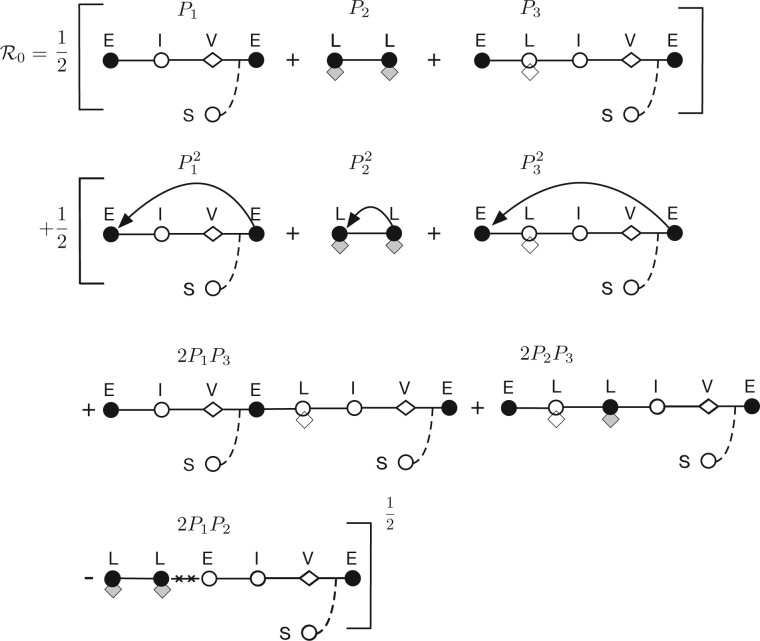
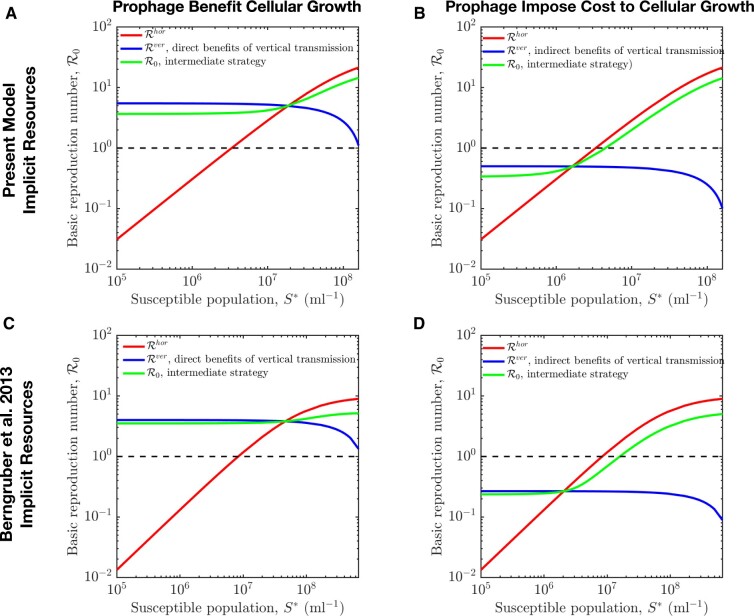
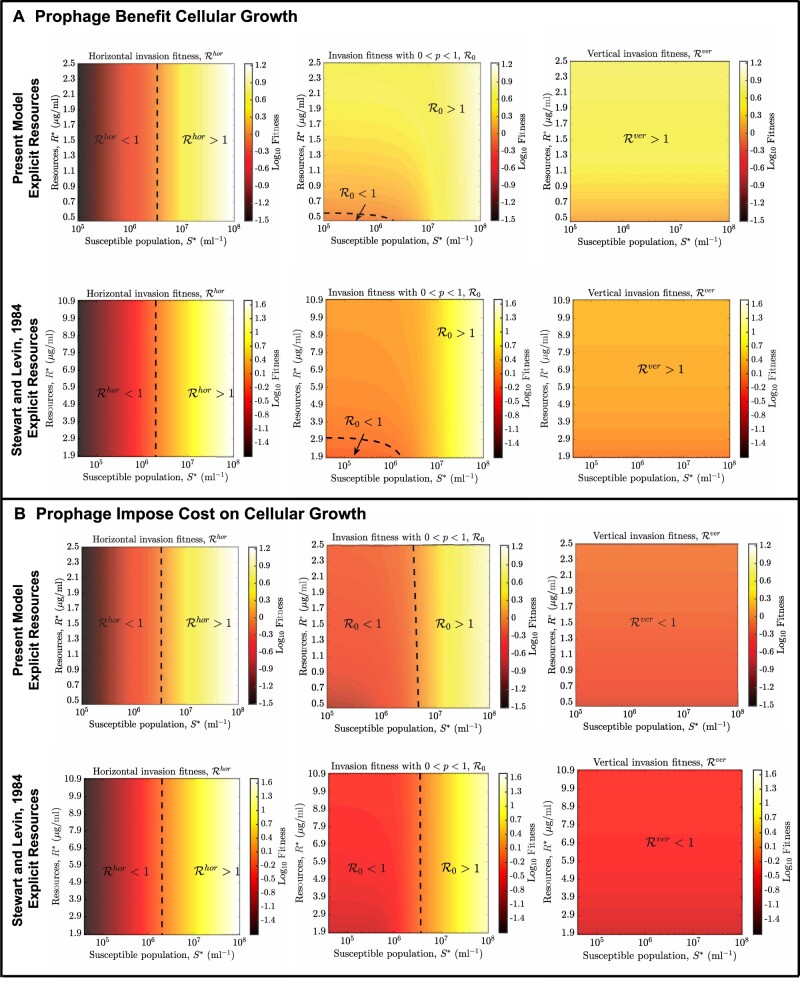
Bacterial viruses, that is 'bacteriophage' or 'phage', can infect and lyse their bacterial hosts, releasing new viral progeny. In addition to the lytic pathway, certain bacteriophage (i.e. 'temperate' bacteriophage) can also initiate lysogeny, a latent mode of infection in which the viral genome is integrated into and replicated with the bacterial chromosome. Subsequently, the integrated viral genome, that is the 'prophage', can induce and restart the lytic pathway. Here, we explore the relationship among infection mode, ecological context, and viral fitness, in essence asking: when should viruses be temperate? To do so, we use network loop analysis to quantify fitness in terms of network paths through the life history of an infectious pathogen that start and end with infected cells. This analysis reveals that temperate strategies, particularly those with direct benefits to cellular fitness, should be favored at low host abundances. This finding applies to a spectrum of mechanistic models of phage-bacteria dynamics spanning both explicit and implicit representations of intra-cellular infection dynamics. However, the same analysis reveals that temperate strategies, in and of themselves, do not provide an advantage when infection imposes a cost to cellular fitness. Hence, we use evolutionary invasion analysis to explore when temperate phage can invade microbial communities with circulating lytic phage. We find that lytic phage can drive down niche competition amongst microbial cells, facilitating the subsequent invasion of latent strategies that increase cellular resistance and/or immunity to infection by lytic viruses-notably this finding holds even when the prophage comes at a direct fitness cost to cellular reproduction. Altogether, our analysis identifies broad ecological conditions that favor latency and provide a principled framework for exploring the impacts of ecological context on both the short- and long-term benefits of being temperate.

Keywords: ecology; epidemiology; invasion fitness; mathematical modeling; microbial ecology; viral ecology.


Figures

Figure 1.
Figure 1.
Schematic of nonlinear dynamics population models of temperate phage. (Top) The explicit infection model with implicit (–) or explicit (- -) resource dynamics (developed here). (Middle) Resource-explicit model with implicit infections (Stewart and Levin 1984). (Bottom) Resource-implicit model with implicit infections (Berngruber et al. 2013). The governing equations for each model are presented in the Main Text (Top), Section 4 (Middle and Bottom), with extended analysis in Supplementary Appendix A.
Figure 2.
Figure 2.
Loop-based interpretation of the basic reproduction number for horizontal and vertical transmission of temperate phage. Closed circles denote epidemiological births, open circles represent infected cell transitions, diamonds represent virus particles, and lysogens are denoted using a hybrid symbol (denoting the presence of an integrated viral genome). Solid lines denote transitions between states, lines with arrows denote a repeat of the same loop, dashed lines denote interactions with uninfected cells, and crossed out lines (-x-x-) denote non-feasible transitions.
Figure 3.
Figure 3.
Feasible invasion for viral strategies given variation in susceptible host densities. In panels A and C, prophage provide direct benefit to cellular fitness, that is Rver>1 given variation in susceptible host densities. In contrast, panels B and D show the case that prophage impose cost to cellular fitness, that is Rver<1 given variation in susceptible host densities. For the intermediate strategy, the probability of lysogeny is p = 0.5 and the induction rate is γ=0.1/h, see model details and relevant parameters in Sections 2 and 4, Supplementary Appendixes A and E.
Figure 4.
Figure 4.
Feasible invasion for viral strategies given variation in resources and susceptible host densities. (A) Prophage provide direct benefit to cellular fitness, that is Rver>1. (B) Prophage impose cost to cellular fitness, that is Rver<1. The probability of lysogeny is p =0.5 and the induction rate is γ=0.1/h for the intermediate strategy. Additional model details and relevant parameters are in Section 4, Supplementary Appendixes A and E.
Figure 5.
Figure 5.
Invasion of temperate phage with varying degrees of super-infection immunity from ϵ=0 (none) to ϵ=1 (complete). (A) Example time series of population densities in the case that lytic phage can drive down microbial cell densities so as to enable invasion by temperate phage. Concretely, at time t =0 h, temperate phage with purely lysogenic strategy cannot invade virus-free environment (first blue diamond); at time t =200 h, purely lytic phage invade virus-free environment (red circle) and spread; at time t =600 h, the endemic environment set by the resident lytic strategy can be invaded by temperate phage with purely lysogenic strategy with full immunity ϵ = 1 (see second blue diamond). (B) The invasion fitness (Rinv) of a temperate phage strategy pm given variation in ϵ from ϵ = 0 to ϵ = 1, the induction rate is fixed, γm=102/h. The model details are presented in Equation (1) and Supplementary Appendix D3, the relevant parameters are selection coefficient αs=0.42 and decay rate of lysogens dL=0.5/h (in the case when prophage impose cost to cellular fitness), influx rate of resources J=5.33 (μg/ml) h−1, see additional parameters in Supplementary Appendix E.

References

    1. Abedon S. T. (2015) ‘Bacteriophage Secondary Infection’’, Virologica Sinica, 30: 3–10. - PMC - PubMed
    1. Avlund M. et al. (2009) ‘Why Do Phage Play Dice?’, Journal of Virology, 83: 11416–20. - PMC - PubMed
    1. Bergh Ø. et al. (1989) ‘High Abundance of Viruses Found in Aquatic Environments’, Nature, 340: 467–8. - PubMed
    1. Berngruber T. W. et al. (2013) ‘Evolution of Virulence in Emerging Epidemics’, PLoS Pathogens, 9: e1003209–8. - PMC - PubMed
    1. Bertani G. (2004) ‘Lysogeny at Mid-twentieth Century: P1, P2, and Other Experimental Systems’, Journal of Bacteriology, 186: 595–600. - PMC - PubMed