. 2022 Sep 26:2022:2148627.
doi: 10.1155/2022/2148627. eCollection 2022.

The Variation of Transcriptomic Perturbations is Associated with the Development and Progression of Various Diseases

Affiliations

The Variation of Transcriptomic Perturbations is Associated with the Development and Progression of Various Diseases

Zehua Dong et al. Dis Markers. .

Abstract

Background: Although transcriptomic data have been widely applied to explore various diseases, few studies have investigated the association between transcriptomic perturbations and disease development in a wide variety of diseases.

Methods: Based on a previously developed algorithm for quantifying intratumor heterogeneity at the transcriptomic level, we defined the variation of transcriptomic perturbations (VTP) of a disease relative to the health status. Based on publicly available transcriptome datasets, we compared VTP values between the disease and health status and analyzed correlations between VTP values and disease progression or severity in various diseases, including neurological disorders, infectious diseases, cardiovascular diseases, respiratory diseases, liver diseases, kidney diseases, digestive diseases, and endocrine diseases. We also identified the genes and pathways whose expression perturbations correlated positively with VTP across diverse diseases.

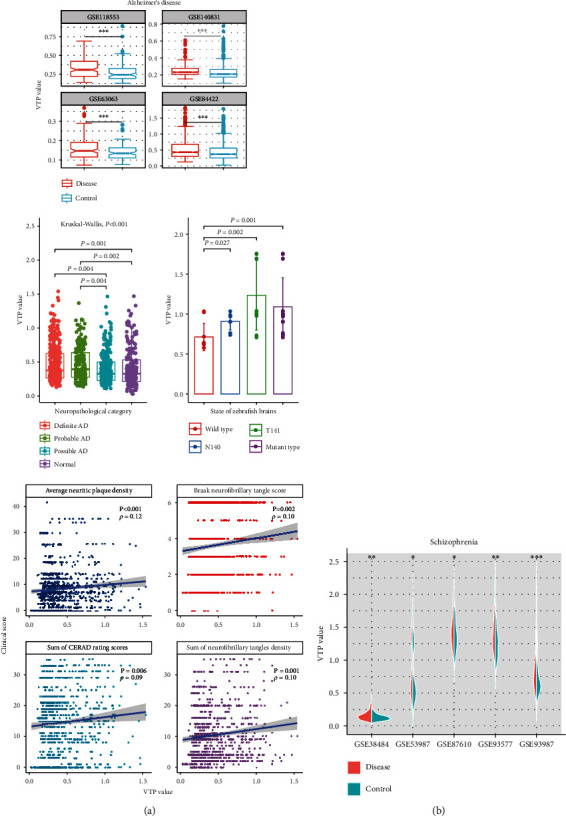
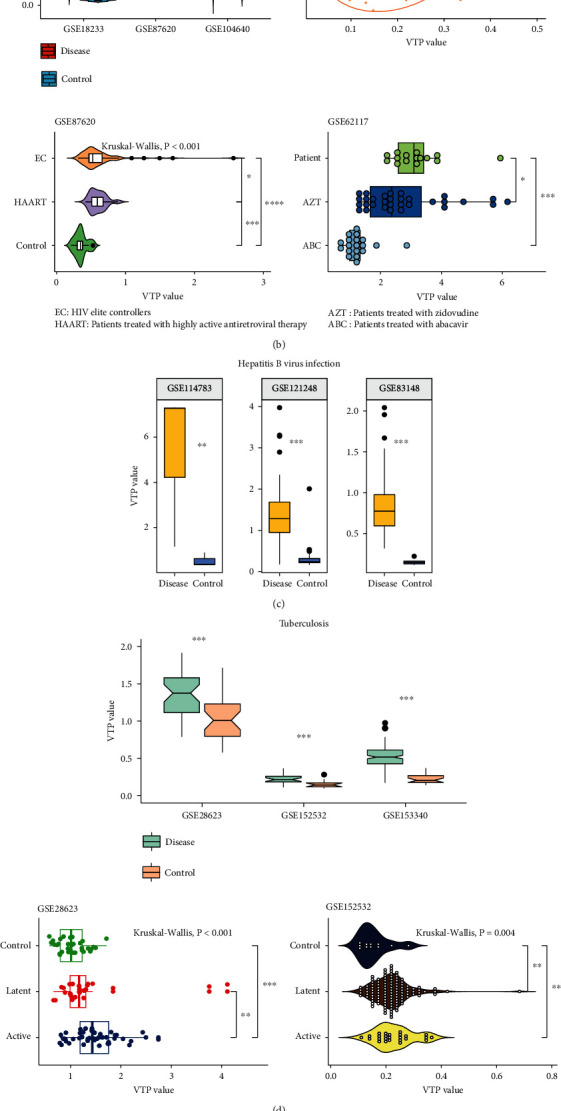
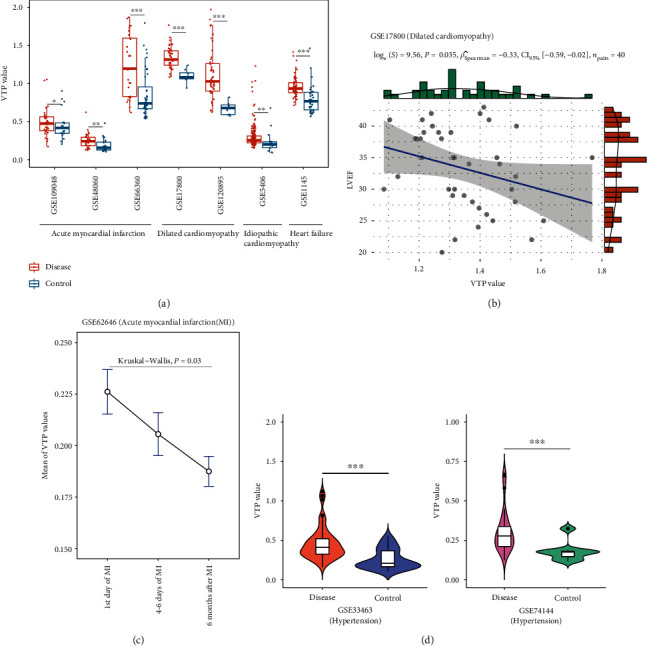
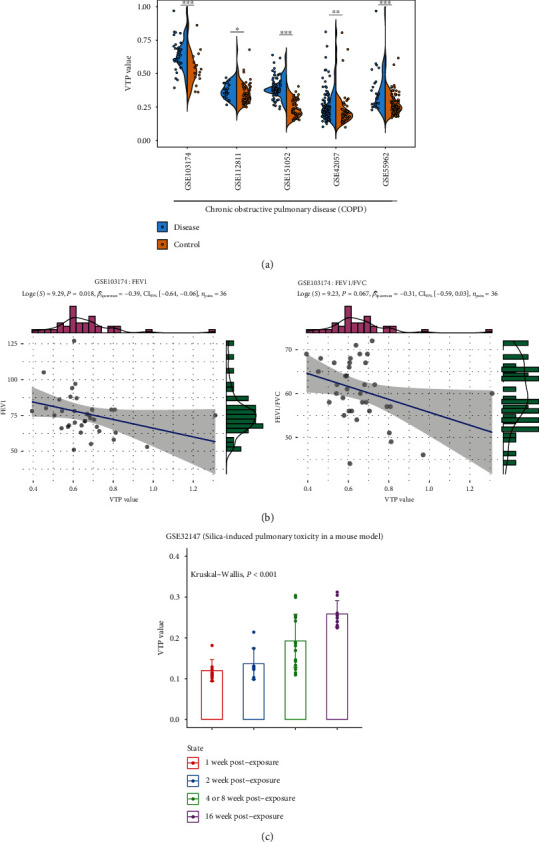
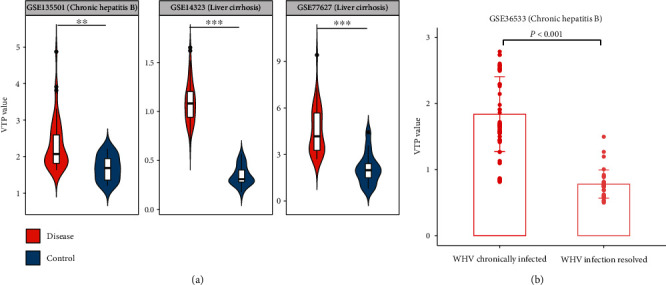
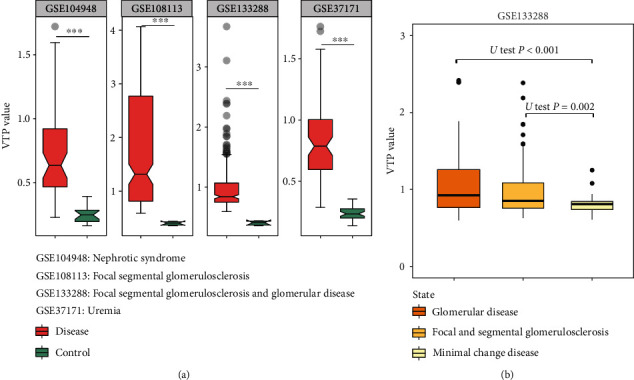
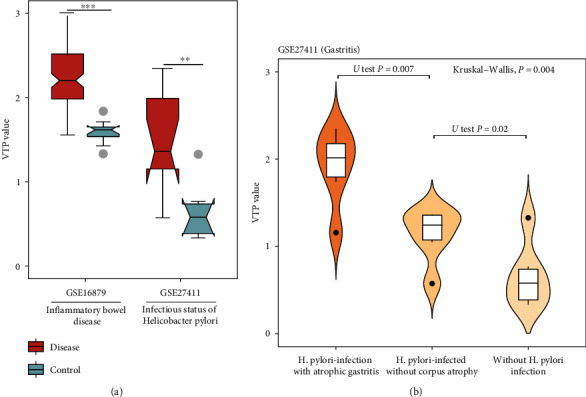
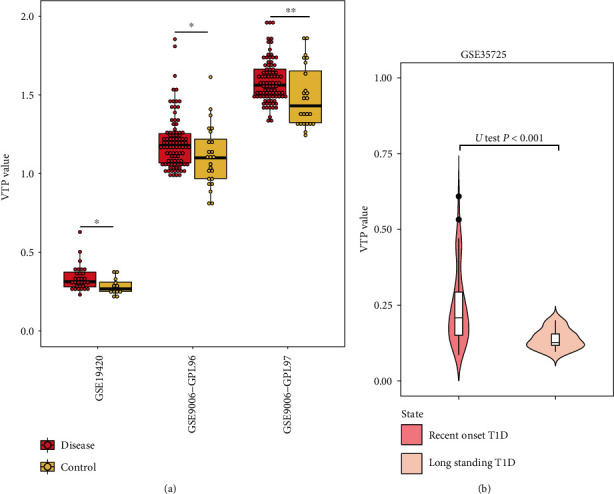
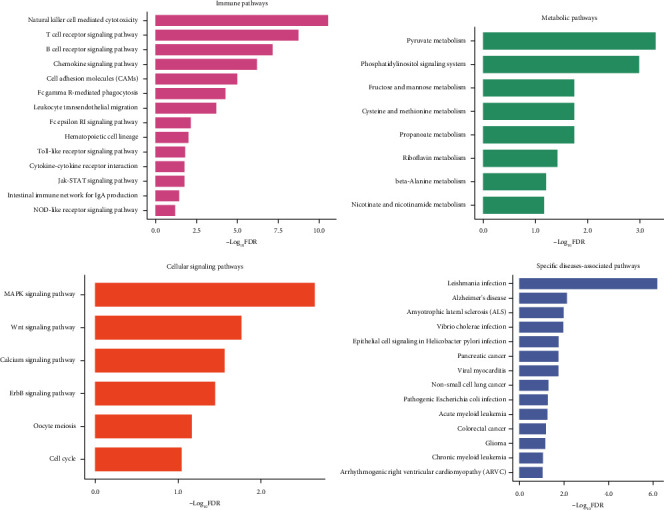
Results: VTP values were upregulated in various diseases relative to their normal controls. VTP values were significantly greater in define than in possible or probable Alzheimer's disease. VTP values were significantly larger in intensive care unit (ICU) COVID-19 patients than in non-ICU patients, and in COVID-19 patients requiring mechanical ventilatory support (MVS) than in those not requiring MVS. VTP correlated positively with viral loads in acquired immune deficiency syndrome (AIDS) patients. Moreover, the AIDS patients treated with abacavir or zidovudine had lower VTP values than those without such therapies. In pulmonary tuberculosis (TB) patients, VTP values followed the pattern: active TB > latent TB > normal controls. VTP values were greater in clinically apparent than in presymptomatic malaria. VTP correlated negatively with the cardiac index of left ventricular ejection fraction (LVEF). In chronic obstructive pulmonary disease (COPD), VTP showed a negative correlation with forced expiratory volume in the first second (FEV1). VTP values increased with H. pylori infection and were upregulated in atrophic gastritis caused by H. pylori infection. The genes and pathways whose expression perturbations correlated positively with VTP scores across diseases were mainly involved in the regulation of immune, metabolic, and cellular activities.

Conclusions: VTP is upregulated in the disease versus health status, and its upregulation is associated with disease progression and severity in various diseases. Thus, VTP has potential clinical implications for disease diagnosis and prognosis.


Conflict of interest statement

The authors declare that they have no competing interests.

Figures

Figure 1
Figure 1
Associations between the VTP measure and disease development and progression in neurological disorder. (a) VTP values are significantly greater in AD patients than in normal controls, larger in define than in possible or probable AD, and increase with AD progression. The measures of Braak neurofibrillary tangle score, average neuritic plaque density, sum of CERAD rating scores in multiple brain regions, and sum of neurofibrillary tangles density in multiple brain regions represent the degree of AD progression. VTP values are remarkedly greater in PSEN2-mutated zebrafish brains than in their wild type controls. (b) VTP values are significantly greater in SCZ patients than in normal controls. AD: Alzheimer's disease. N140: psen2N140fs. T141: psen2T141_L142delinsMISLISV. SCZ: Schizophrenia. P < 0.05, ∗∗P < 0.01, ∗∗∗P < 0.001. They also apply to the following figures.
Figure 2
Figure 2
Associations between the VTP measure and disease development and progression in infectious disease. (a) VTP values are significantly greater in COVID-19 patients than in normal controls and increase with disease severity. (b) VTP values are significantly greater in AIDS patients than in normal controls, greater in AIDS patients without treatment than in AIDS patients with treatment, and increase with disease severity. (c). VTP values are significantly greater in HBV-infected patients than in normal controls. (d) VTP values are significantly greater in TB patients than in normal controls and increase with disease progression. (e) VTP values are significantly greater in malaria patients than in normal controls and increase with disease severity. ICU: intensive care unit. MVS: mechanical ventilatory support. SOFA: sequential organ failure assessment. AIDS: acquired immune deficiency syndrome. HBV: hepatitis B virus. TB: tuberculosis.
Figure 3
Figure 3
Associations between the VTP measure and disease development and progression in cardiovascular disease. (a) VTP values are significantly greater in heart disease patients than in normal controls and increase with disease severity. (b) VTP values correlate negatively with the cardiac index of LVEF. (c) VTP values decrease with the remission of acute myocardial infarction. (d) VTP values are significantly greater in hypertension patients than in normal controls. LVEF: left ventricular ejection fraction.
Figure 4
Figure 4
Associations between the VTP measure and disease development and progression in respiratory disease. (a) VTP values are significantly greater in respiratory disease patients than in normal controls. (b) VTP values correlate negatively with FEV1 and ratios of FEV1/FVC in COPD. (c) VTP values increase steadily with the progression of silica-induced pulmonary toxicity in a mouse model. COPD: chronic obstructive pulmonary disease. FEV1: forced expiratory volume in the first second. FVC: forced vital capacity.
Figure 5
Figure 5
Associations between the VTP measure and disease development and progression in liver disease. (a) VTP values are significantly greater in liver disease patients than in normal controls. (b) VTP values are greater in WHV chronically infected than in infection resolved woodchuck in an animal model. WHV: woodchuck hepatitis virus.
Figure 6
Figure 6
Associations between the VTP measure and disease development and progression in kidney disease. (a) VTP values are significantly greater in kidney disease patients than in normal controls. (b) VTP values correlate positively with disease severity in kidney disease.
Figure 7
Figure 7
Associations between the VTP measure and disease development and progression in digestive disease. (a) VTP values are significantly greater in digestive disease patients than in normal controls. (b) VTP values correlate positively with disease severity in atrophic gastritis.
Figure 8
Figure 8
Associations between the VTP measure and disease development and progression in endocrine disease. (a) VTP values are significantly greater in diabetes patients than in normal controls. (b) VTP values are significantly greater in recent onset diabetes patients than in longstanding diabetes patients. T1D: Type 1 diabetes.
Figure 9
Figure 9
Pathways whose expression perturbations correlate positively with VTP scores across diseases.

Similar articles

References

    1. Li M., Zhang Z., Li L., Wang X. An algorithm to quantify intratumor heterogeneity based on alterations of gene expression profiles. Communications biology . 2020;3(1):p. 505. doi: 10.1038/s42003-020-01230-7. - DOI - PMC - PubMed
    1. Benjamini Y., Hochberg Y. Controlling the false discovery rate: a practical and powerful approach to multiple testing. Journal of the Royal Statistical Society B . 1995;57(1):289–300. doi: 10.1111/j.2517-6161.1995.tb02031.x. - DOI
    1. Subramanian A., Tamayo P., Mootha V. K., et al. Gene set enrichment analysis: a knowledge-based approach for interpreting genome-wide expression profiles. Proceedings of the National Academy of Sciences of the United States of America . 2005;102(43):15545–15550. doi: 10.1073/pnas.0506580102. - DOI - PMC - PubMed
    1. Kanehisa M., Furumichi M., Tanabe M., Sato Y., Morishima K. KEGG: new perspectives on genomes, pathways, diseases and drugs. Nucleic Acids Research . 2017;45(D1):D353–D361. doi: 10.1093/nar/gkw1092. - DOI - PMC - PubMed
    1. Soria Lopez J. A., Gonzalez H. M., Leger G. C. Alzheimer's disease. Handbook of Clinical Neurology . 2019;167:231–255. doi: 10.1016/B978-0-12-804766-8.00013-3. - DOI - PubMed