. 2022 Jul 20;4(5):e220055.
doi: 10.1148/ryai.220055. eCollection 2022 Sep.

Deep Learning-based Assessment of Oncologic Outcomes from Natural Language Processing of Structured Radiology Reports

Affiliations

Deep Learning-based Assessment of Oncologic Outcomes from Natural Language Processing of Structured Radiology Reports

Matthias A Fink et al. Radiol Artif Intell. .

Abstract

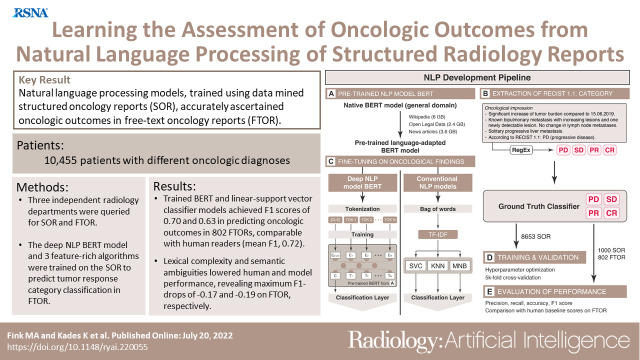
Purpose: To train a deep natural language processing (NLP) model, using data mined structured oncology reports (SOR), for rapid tumor response category (TRC) classification from free-text oncology reports (FTOR) and to compare its performance with human readers and conventional NLP algorithms.

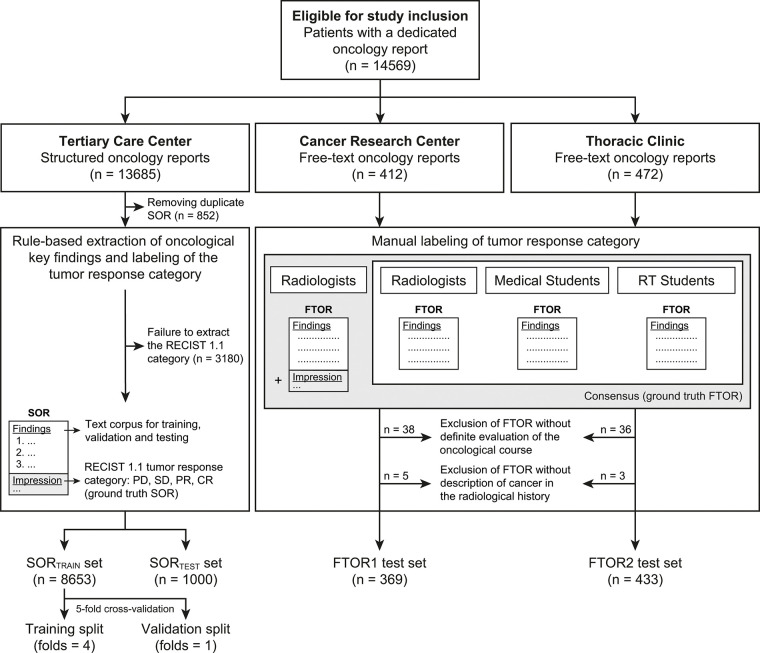
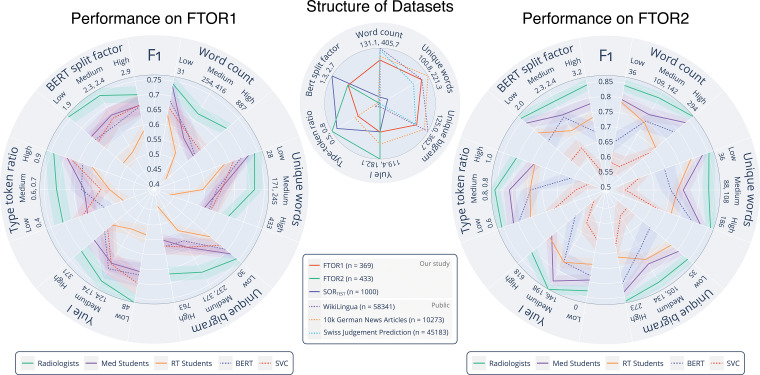
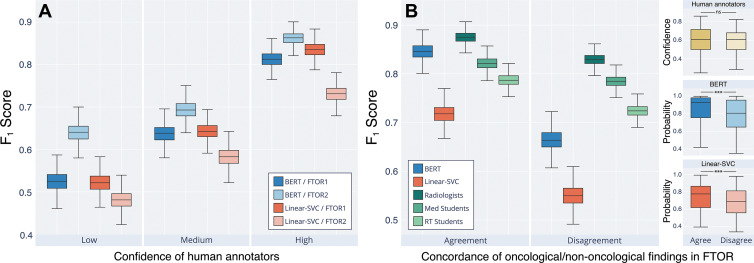
Materials and methods: In this retrospective study, databases of three independent radiology departments were queried for SOR and FTOR dated from March 2018 to August 2021. An automated data mining and curation pipeline was developed to extract Response Evaluation Criteria in Solid Tumors-related TRCs for SOR for ground truth definition. The deep NLP bidirectional encoder representations from transformers (BERT) model and three feature-rich algorithms were trained on SOR to predict TRCs in FTOR. Models' F1 scores were compared against scores of radiologists, medical students, and radiology technologist students. Lexical and semantic analyses were conducted to investigate human and model performance on FTOR.

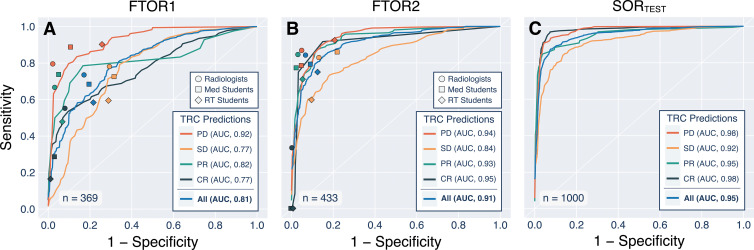
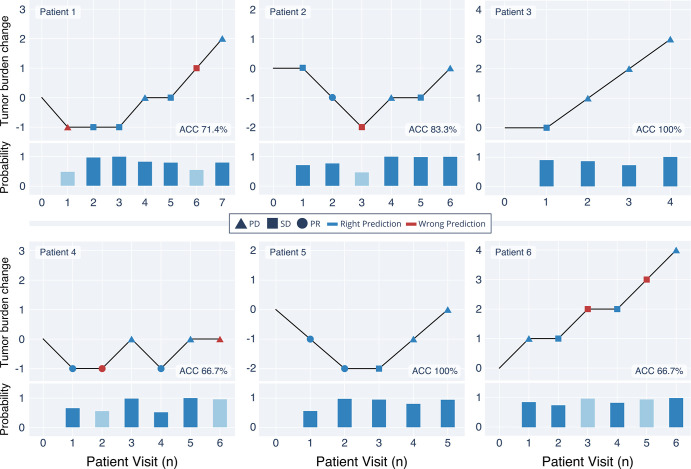
Results: Oncologic findings and TRCs were accurately mined from 9653 of 12 833 (75.2%) queried SOR, yielding oncology reports from 10 455 patients (mean age, 60 years ± 14 [SD]; 5303 women) who met inclusion criteria. On 802 FTOR in the test set, BERT achieved better TRC classification results (F1, 0.70; 95% CI: 0.68, 0.73) than the best-performing reference linear support vector classifier (F1, 0.63; 95% CI: 0.61, 0.66) and technologist students (F1, 0.65; 95% CI: 0.63, 0.67), had similar performance to medical students (F1, 0.73; 95% CI: 0.72, 0.75), but was inferior to radiologists (F1, 0.79; 95% CI: 0.78, 0.81). Lexical complexity and semantic ambiguities in FTOR influenced human and model performance, revealing maximum F1 score drops of -0.17 and -0.19, respectively.

Conclusion: The developed deep NLP model reached the performance level of medical students but not radiologists in curating oncologic outcomes from radiology FTOR.Keywords: Neural Networks, Computer Applications-Detection/Diagnosis, Oncology, Research Design, Staging, Tumor Response, Comparative Studies, Decision Analysis, Experimental Investigations, Observer Performance, Outcomes Analysis Supplemental material is available for this article. © RSNA, 2022.

Keywords: Comparative Studies; Computer Applications–Detection/Diagnosis; Decision Analysis; Experimental Investigations; Neural Networks; Observer Performance; Oncology; Outcomes Analysis; Research Design; Staging; Tumor Response.


Conflict of interest statement

Disclosures of conflicts of interest: M.A.F. No relevant relationships. K.K. No relevant relationships. A.B. No relevant relationships. M.M. No relevant relationships. M.S. No relevant relationships. M.K. No relevant relationships. G.K. No relevant relationships. J.S. No relevant relationships. C.P.H. No relevant relationships. H.P.S. No relevant relationships. K.M.H. No relevant relationships. T.F.W. No relevant relationships. J.K. No relevant relationships.

Figures

None
Graphical abstract
Flowchart of study design. CR = complete response, FTOR = free-text oncology reports, PD = progressive disease, PR = partial response, RECIST = Response Evaluation Criteria in Solid Tumors, RT = radiology technologist, SD = stable disease, SOR = structured oncology reports.
Figure 1:
Flowchart of study design. CR = complete response, FTOR = free-text oncology reports, PD = progressive disease, PR = partial response, RECIST = Response Evaluation Criteria in Solid Tumors, RT = radiology technologist, SD = stable disease, SOR = structured oncology reports.
Structured oncologic assessment in clinical routine and natural language processing (NLP) model building. An exemplary structured oncology report (SOR) for a 32-year-old woman with a history of breast cancer (left side) was interpreted as progressive disease (PD). The oncologic data were automatically processed and then fed into the NLP development pipeline (right side, A–E). (A) The deep NLP architecture used was based on the bidirectional encoder representations from transformers (BERT) language model pretrained on unlabeled general domain data and adapted to the German vocabulary. (B) Automatic extraction of the Response Evaluation Criteria in Solid Tumors (RECIST)–related categories PD, stable disease (SD), partial response (PR), and complete response (CR) from the SOR “impression” section by using a rule-based pattern-matching command called regular expressions (RegEx). (C) Fine-tuning of BERT and three feature-rich NLP methods (linear support vector classifier [SVC], k-nearest neighbors [KNN], multinomial naive Bayes [MNB]) on the extracted SOR oncologic findings section. The output of (B) was used as ground truth classifier for (D) NLP model training and validation, followed by (E) performance evaluation on the free-text oncology reports (FTOR) test sets in comparison with human baseline scores. A live demo of the SOR template can be accessed for review at http://www.targetedreporting.com/sor/. For demonstration purposes, the presented exemplary SOR and the online template have been translated from German to English. TF-IDF = term frequency–inverse document frequency.
Figure 2:
Structured oncologic assessment in clinical routine and natural language processing (NLP) model building. An exemplary structured oncology report (SOR) for a 32-year-old woman with a history of breast cancer (left side) was interpreted as progressive disease (PD). The oncologic data were automatically processed and then fed into the NLP development pipeline (right side, A–E). (A) The deep NLP architecture used was based on the bidirectional encoder representations from transformers (BERT) language model pretrained on unlabeled general domain data and adapted to the German vocabulary. (B) Automatic extraction of the Response Evaluation Criteria in Solid Tumors (RECIST)–related categories PD, stable disease (SD), partial response (PR), and complete response (CR) from the SOR “impression” section by using a rule-based pattern-matching command called regular expressions (RegEx). (C) Fine-tuning of BERT and three feature-rich NLP methods (linear support vector classifier [SVC], k-nearest neighbors [KNN], multinomial naive Bayes [MNB]) on the extracted SOR oncologic findings section. The output of (B) was used as ground truth classifier for (D) NLP model training and validation, followed by (E) performance evaluation on the free-text oncology reports (FTOR) test sets in comparison with human baseline scores. A live demo of the SOR template can be accessed for review at http://www.targetedreporting.com/sor/. For demonstration purposes, the presented exemplary SOR and the online template have been translated from German to English. TF-IDF = term frequency–inverse document frequency.
Receiver operating characteristic curves for the deep natural language processing model bidirectional encoder representations from transformers (BERT) and symbols for each annotator group. The data show (A) the performance on free-text oncology reports (FTOR) of the cancer research center (FTOR1) and (B) the hospital specializing in chest diseases (FTOR2) in predicting the tumor response categories (TRCs) of progressive disease (PD), stable disease (SD), partial response (PR), and complete response (CR). (C) Performance of BERT on the held-out test subset of the structured oncology reports from the tertiary care center (SORTEST). AUC = area under the receiver operating characteristic curve, RT = radiology technologist.
Figure 3:
Receiver operating characteristic curves for the deep natural language processing model bidirectional encoder representations from transformers (BERT) and symbols for each annotator group. The data show (A) the performance on free-text oncology reports (FTOR) of the cancer research center (FTOR1) and (B) the hospital specializing in chest diseases (FTOR2) in predicting the tumor response categories (TRCs) of progressive disease (PD), stable disease (SD), partial response (PR), and complete response (CR). (C) Performance of BERT on the held-out test subset of the structured oncology reports from the tertiary care center (SORTEST). AUC = area under the receiver operating characteristic curve, RT = radiology technologist.
Exemplary longitudinal representations of the oncologic course of six exemplary patients on the basis of the tumor response category (TRC) predictions by the deep natural language processing model bidirectional encoder representations from transformers (BERT) on the free-text oncology reports (FTOR). BERT’s probability of choosing the TRC per patient visit is shown below each timeline; light blue bars highlight the probability on FTOR where the model predicted an incorrect TRC. ACC = accuracy, PD = progressive disease, PR = partial response, SD = stable disease.
Figure 4:
Exemplary longitudinal representations of the oncologic course of six exemplary patients on the basis of the tumor response category (TRC) predictions by the deep natural language processing model bidirectional encoder representations from transformers (BERT) on the free-text oncology reports (FTOR). BERT’s probability of choosing the TRC per patient visit is shown below each timeline; light blue bars highlight the probability on FTOR where the model predicted an incorrect TRC. ACC = accuracy, PD = progressive disease, PR = partial response, SD = stable disease.
Lexical complexity analysis of the oncology reports and performance of the natural language processing (NLP) models and human annotators on the free-text oncology reports (FTOR). The center radar plot shows the analyzed complexity parameters, for which minimum and maximum values are given beneath each parameter. For comparison of the lexical structure of the FTOR corpora, the structured oncology reports of the tertiary care center (SORTEST, n = 1000) as well as three publicly available datasets (WikiLingua, n = 58 341; 10k German news articles, n = 10 273; Swiss Judgement Prediction, n = 45 183) are shown. The radar plots on the left and right side outline the F1 scores (shadows indicate 95% CIs) for the deep NLP bidirectional encoder representations from transformers (BERT) model and the best-performing conventional NLP model, linear support vector classifier (Linear-SVC), as well as for the radiologists, medical students, and radiology technologist (RT) students on the FTOR of the cancer research center (left, FTOR1, n = 369) and the hospital specializing in chest diseases (right, FTOR2, n = 433) for classifying tumor response category as a function of the analyzed complexity parameters; these scores were grouped into equal-sized bins of low, medium, and high lexical complexity and denoted with the respective boundary values beneath each parameter.
Figure 5:
Lexical complexity analysis of the oncology reports and performance of the natural language processing (NLP) models and human annotators on the free-text oncology reports (FTOR). The center radar plot shows the analyzed complexity parameters, for which minimum and maximum values are given beneath each parameter. For comparison of the lexical structure of the FTOR corpora, the structured oncology reports of the tertiary care center (SORTEST, n = 1000) as well as three publicly available datasets (WikiLingua, n = 58 341; 10k German news articles, n = 10 273; Swiss Judgement Prediction, n = 45 183) are shown. The radar plots on the left and right side outline the F1 scores (shadows indicate 95% CIs) for the deep NLP bidirectional encoder representations from transformers (BERT) model and the best-performing conventional NLP model, linear support vector classifier (Linear-SVC), as well as for the radiologists, medical students, and radiology technologist (RT) students on the FTOR of the cancer research center (left, FTOR1, n = 369) and the hospital specializing in chest diseases (right, FTOR2, n = 433) for classifying tumor response category as a function of the analyzed complexity parameters; these scores were grouped into equal-sized bins of low, medium, and high lexical complexity and denoted with the respective boundary values beneath each parameter.
Machine and human interpretability of the “findings” section in free-text oncology reports (FTOR) with respect to classifying the tumor response category (TRC). (A) Performance of the deep natural language processing (NLP) bidirectional encoder representations from transformers (BERT) model and the best-performing conventional NLP method, linear support vector classifier (Linear-SVC), on FTOR of the cancer research center (FTOR1) and the hospital specializing in chest diseases (FTOR2), grouped by confidence of the human annotators in classifying the TRC. The mean confidence of all annotators on the basis of Likert scores were split into three confidence groups (low, medium, high). (B) Performance of both NLP models and the human annotators as a function of the concordance of oncologic and nononcologic findings described in the FTOR findings section. For example, the findings “increased pulmonary metastases” and “increased degenerative changes of the spine” were categorized as oncologic to nononcologic concordance (agreement) in one FTOR, whereas “decreased pulmonary metastases” and “increased degenerative changes of the spine” were categorized as nonconcordance (disagreement) in another FTOR. The right facet of (B) outlines the respective confidences of the human annotators and the probabilities of the NLP models in classifying the TRC on the basis of the underlying concordance group (agree, disagree). *** = P < .001, ns = not significant, RT = radiology technologist.
Figure 6:
Machine and human interpretability of the “findings” section in free-text oncology reports (FTOR) with respect to classifying the tumor response category (TRC). (A) Performance of the deep natural language processing (NLP) bidirectional encoder representations from transformers (BERT) model and the best-performing conventional NLP method, linear support vector classifier (Linear-SVC), on FTOR of the cancer research center (FTOR1) and the hospital specializing in chest diseases (FTOR2), grouped by confidence of the human annotators in classifying the TRC. The mean confidence of all annotators on the basis of Likert scores were split into three confidence groups (low, medium, high). (B) Performance of both NLP models and the human annotators as a function of the concordance of oncologic and nononcologic findings described in the FTOR findings section. For example, the findings “increased pulmonary metastases” and “increased degenerative changes of the spine” were categorized as oncologic to nononcologic concordance (agreement) in one FTOR, whereas “decreased pulmonary metastases” and “increased degenerative changes of the spine” were categorized as nonconcordance (disagreement) in another FTOR. The right facet of (B) outlines the respective confidences of the human annotators and the probabilities of the NLP models in classifying the TRC on the basis of the underlying concordance group (agree, disagree). *** = P < .001, ns = not significant, RT = radiology technologist.

References

    1. Yim WW , Yetisgen M , Harris WP , Kwan SW . Natural language processing in oncology: a review . JAMA Oncol 2016. ; 2 ( 6 ): 797 – 804 . - PubMed
    1. European Society of Radiology (ESR) . ESR paper on structured reporting in radiology . Insights Imaging 2018. ; 9 ( 1 ): 1 – 7 . - PMC - PubMed
    1. Nobel JM , Kok EM , Robben SGF . Redefining the structure of structured reporting in radiology . Insights Imaging 2020. ; 11 ( 1 ): 10 . - PMC - PubMed
    1. Fink MA , Mayer VL , Schneider T , et al. . CT angiography clot burden score from data mining of structured reports for pulmonary embolism . Radiology 2022. ; 302 ( 1 ): 175 – 184 . - PubMed
    1. Kehl KL , Elmarakeby H , Nishino M , et al. . Assessment of deep natural language processing in ascertaining oncologic outcomes from radiology reports . JAMA Oncol 2019. ; 5 ( 10 ): 1421 – 1429 . - PMC - PubMed

LinkOut - more resources