. 2022 Sep 20:9:959457.
doi: 10.3389/fcvm.2022.959457. eCollection 2022.

Distinct role of mitochondrial function and protein kinase C in intimal and medial calcification in vitro

Affiliations

Distinct role of mitochondrial function and protein kinase C in intimal and medial calcification in vitro

Marina A Heuschkel et al. Front Cardiovasc Med. .

Abstract

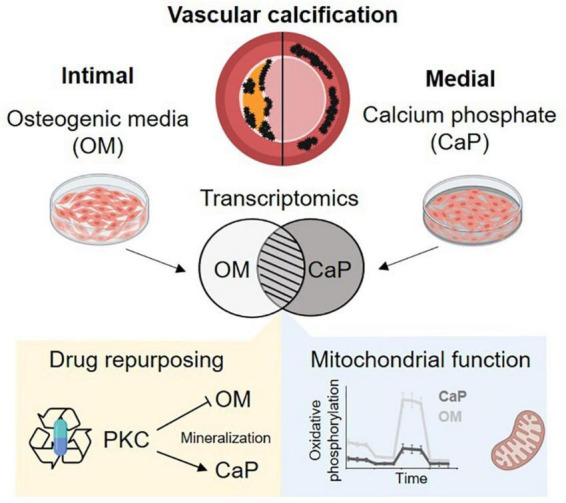
Introduction: Vascular calcification (VC) is a major risk factor for cardiovascular morbidity and mortality. Depending on the location of mineral deposition within the arterial wall, VC is classified as intimal and medial calcification. Using in vitro mineralization assays, we developed protocols triggering both types of calcification in vascular smooth muscle cells (SMCs) following diverging molecular pathways.

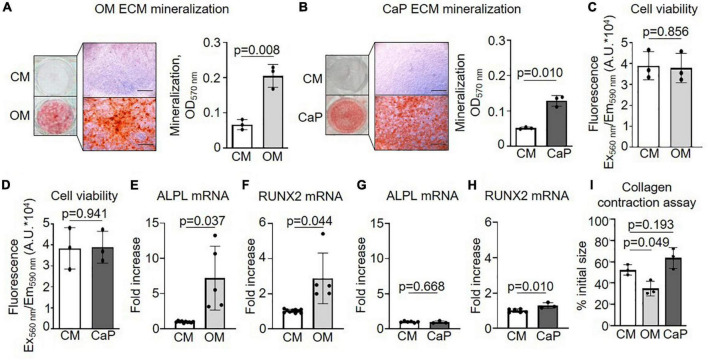
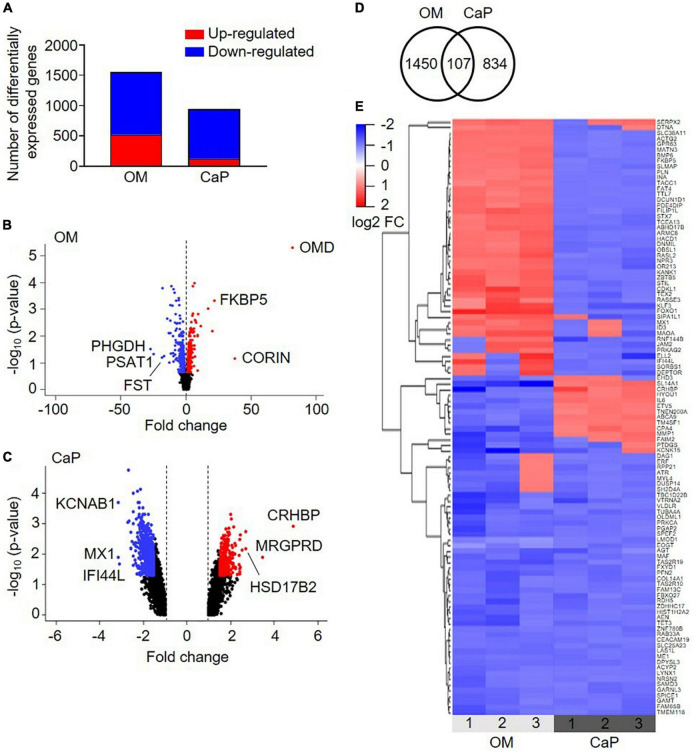
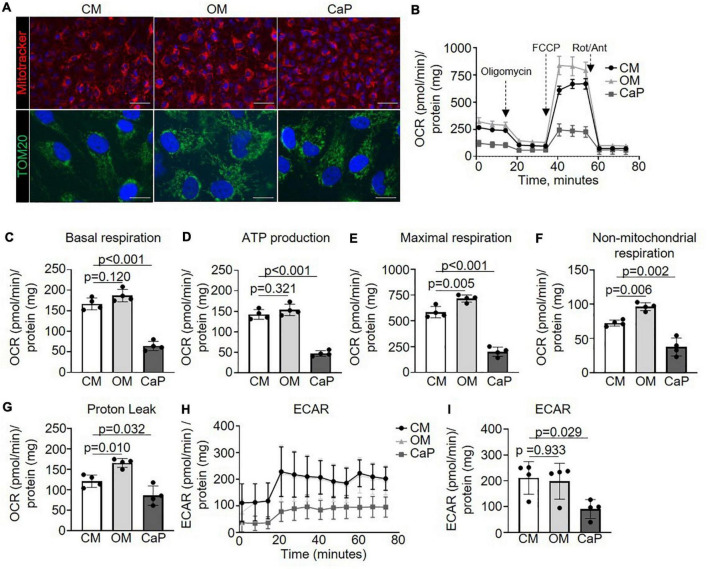
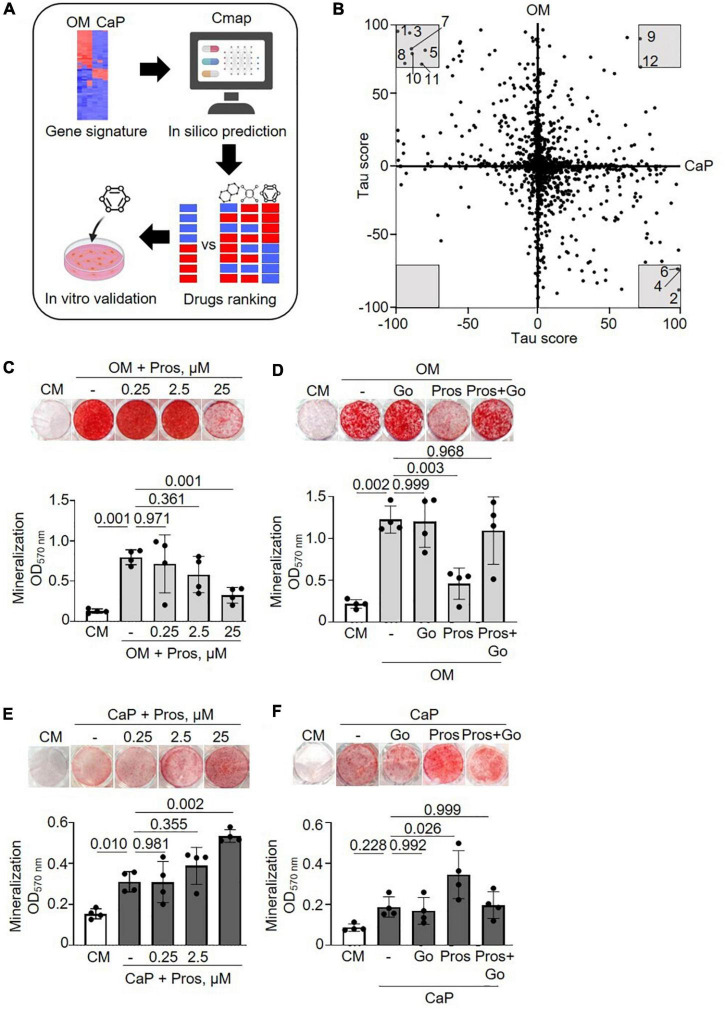
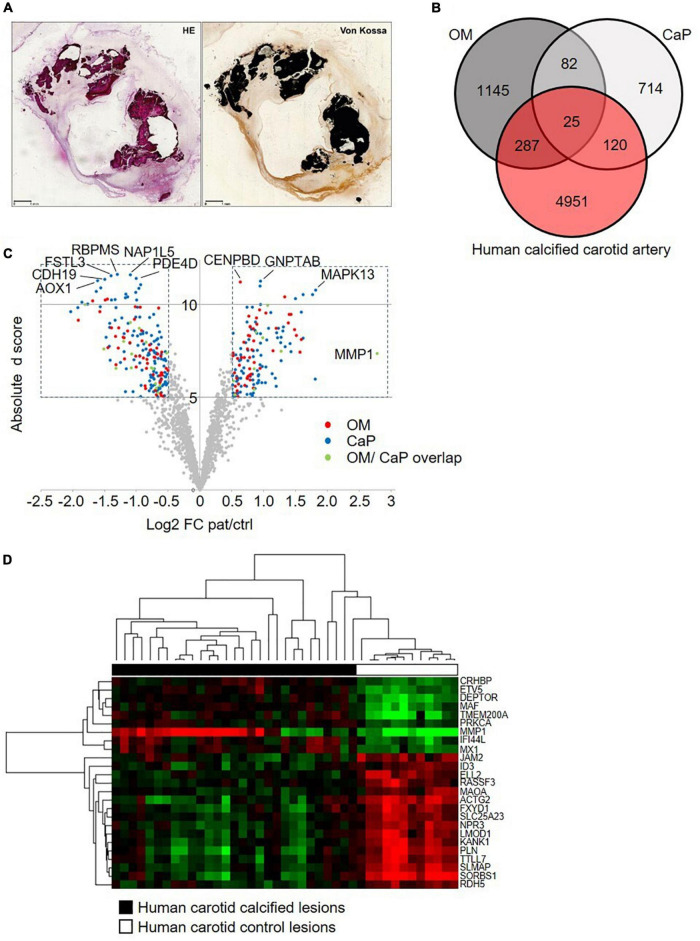
Materials and methods and results: Human coronary artery SMCs were cultured in osteogenic medium (OM) or high calcium phosphate medium (CaP) to induce a mineralized extracellular matrix. OM induces osteoblast-like differentiation of SMCs-a key process in intimal calcification during atherosclerotic plaque remodeling. CaP mimics hyperphosphatemia, associated with chronic kidney disease-a risk factor for medial calcification. Transcriptomic analysis revealed distinct gene expression profiles of OM and CaP-calcifying SMCs. OM and CaP-treated SMCs shared 107 differentially regulated genes related to SMC contraction and metabolism. Real-time extracellular efflux analysis demonstrated decreased mitochondrial respiration and glycolysis in CaP-treated SMCs compared to increased mitochondrial respiration without altered glycolysis in OM-treated SMCs. Subsequent kinome and in silico drug repurposing analysis (Connectivity Map) suggested a distinct role of protein kinase C (PKC). In vitro validation experiments demonstrated that the PKC activators prostratin and ingenol reduced calcification triggered by OM and promoted calcification triggered by CaP.

Conclusion: Our direct comparison results of two in vitro calcification models strengthen previous observations of distinct intracellular mechanisms that trigger OM and CaP-induced SMC calcification in vitro. We found a differential role of PKC in OM and CaP-calcified SMCs providing new potential cellular and molecular targets for pharmacological intervention in VC. Our data suggest that the field should limit the generalization of results found in in vitro studies using different calcification protocols.

Keywords: drug repurposing; matrix mineralization; mitochondrial function; protein kinase C; vascular calcification; vascular smooth muscle cells.


Conflict of interest statement

The authors declare that the research was conducted in the absence of any commercial or financial relationships that could be construed as a potential conflict of interest. The reviewer JE declared a shared affiliation with one of the author RK to the handling editor at the time of review.

Figures

FIGURE 1
FIGURE 1
Characterization of osteogenic medium (OM) and calcium phosphate (CaP)-induced calcification of primary coronary artery smooth muscle cells (pSMCs). (A) pSMCs were cultured in control medium (CM) and OM for 21 days or (B) CaP for 7 days. Representative images of extracellular matrix (ECM) mineralization were detected by alizarin red S staining and eluted staining quantified by assessing the optical density at 570 nm. Scale bar: 1,000 μm. n = 3 (C) Effect of OM and (D) CaP-induced calcification on cell viability assessed by AlamarBlue assay (Fluorescence Ex560 nm/Em590 nm) on day 21 for OM and day 7 for CaP. n = 3. (E–H) ALPL and RUNX2 mRNA expression for (E,F) OM-calcified pSMCs (day 7) and (G,H) for CaP-calcified pSMCs (day 3). (I) Collagen contraction assay at day 5. n = 3–5. Error bars indicate ± SD. Each n indicates an independent pSMC donor. Unpaired t-test and one-way ANOVA with Dunnett’s post hoc test for I.
FIGURE 2
FIGURE 2
Transcriptional profiling of osteogenic (OM) and calcium phosphate (CaP)-calcified primary coronary artery smooth muscle cells (pSMCs). (A) Number of up-regulated (red) and down-regulated (blue) genes from OM and CaP-calcified pSMCs compared to control (CM). Cut-off FC 1.5. (B,C) Volcano plots of the differentially expressed genes in OM and CaP-calcified pSMCs, respectively, compared to CM. Plotted on the x-axis is the fold change between calcified and CM pSMCs. Plotted on the y-axis is the –log10(p-value). Significant differentially expressed genes are divided into up-regulated (red dots) and down-regulated (blue dots) genes, while non-significant genes are shown in black. The top three up-and downregulated genes are named. (D) The Venn diagram shows overlapping differentially expressed genes between OM and CaP-calcified pSMCs. (E) Heatmap presenting the expression profiles of the 107 common genes. Genes with a fold change ≥ ± 1.5 and a p-value < 0.05 are considered differentially expressed. n = 3 independent primary SMC donors.
FIGURE 3
FIGURE 3
Mitochondrial respiration increases in osteogenic medium (OM) and attenuates in calcium phosphate (CaP)-calcified vascular smooth muscle cells (SMC) Immortalized SMCs (iSMCs) were cultured for 7 days in control medium (CM), OM or CaP. (A) Representative images of live iSMCs for the mitochondria-specific dye MitoTracker Red (red) and nuclear Hoeschst staining (blue) and immunofluorescence for TOM20 (green) with DAPI nuclear staining (blue). n = 3, scale bar: 75 μm and 10 μm, respectively. (B) Mitochondrial oxygen consumption rates (OCR) of OM and CaP-calcified iSMCs subjected to the XF Mito Stress Test measured using the Seahorse XF96 flux analyzer, with sequential injections of mitochondrial effectors [oligomycin, carbonyl cyanide-4 (trifluoromethoxy) phenylhydrazone (FCCP) and rotenone (Rot), antimycin (Ant)] at time points indicated by the downward arrows. n = 4. (C) Basal respiration, (D) ATP production. (E) Maximal respiration. (F) Non-mitochondrial respiration. (G) Proton leak. (H,I) Extracellular acidification rate (ECAR) and quantification. OCR and ECAR were normalized to protein content. Error bars indicate ± SD. Each n indicates an independent replicate. One-way ANOVA with Dunnet’s post hoc test.
FIGURE 4
FIGURE 4
Drug repurposing of osteogenic medium (OM) and calcium phosphate (CaP) gene signatures. (A) Scheme of the method. Created with https://Biorender.com (B) Scatter plot with predicted effects of drugs on OM and CaP-induced calcification. Gray area–drugs with predicted tau score < or > 70. 1: PD-184352, 2: Prostratin, 3: Fluticasone, 4: Ingenol, 5: L-690330, 6: Phorbol 12-myristate 13-acetate (PMA), 7: Halometasone, 8: Sunitinib, 9: MLN-2238, 10:Hydrocortisone, 11: Benzatropine, 12: Puromycin. (C,D) Effect of the protein kinase C (PKC) activator prostratin (Pros) and the PKC inhibitor Go6983 (Go) in OM and (E,F) in CaP-calcified immortalized vascular smooth muscle cells (iSMCs). iSMCs were cultured in control medium (CM) and OM for 14 days or CaP for 7 days with different concentrations of prostratin (0.25, 2.5, and 25 μM). Go (100 nM) was combined with 25 μM prostratin. Representative images of extracellular matrix mineralization (top) detected by alizarin red S staining and quantification of eluted staining (bottom). n = 4–5. C-H, DMSO (1:1,000) was used as solvent control in CM, OM, and CaP groups. Error bars indicate ± SD. Each n indicates an independent replicate. One-way ANOVA with Dunnett’s post hoc test.
FIGURE 5
FIGURE 5
Comparative transcriptome analysis across human carotid artery and in vitro models. (A) Serial sections of a resin embedded carotid lesion [hematoxylin eosin staining (HE) and von Kossa staining] Bar: 1 mm. (B) Venn diagram comparing the osteogenic media (OM)-treated primary coronary artery smooth muscle cells (pSMCs) and calcium phosphate (CaP)-treated pSMCs gene signatures to the human calcified carotid artery gene signature. (C) The volcano plot of the human calcified carotid artery dataset displays only the OM and CaP gene signature genes. Plotted on the x-axis is the log2 of the fold change (FC) between the calcified and control carotid artery. Plotted on the y-axis is the absolute d score obtained through Significant Analysis of Microarrays (T-statistic value). Significant differentially expressed genes (Absolute d score > 5, Log2 FC < –0.5 or > 0.5) are indicated in red (OM genes), blue (CaP genes), or green (shared between OM and CaP). Non-differentially expressed genes are shown in gray. (D) Hierarchical clustering of the 25 differential regulated genes that are common between carotid artery, OM-calcified pSMCs, and CaP-calcified pSMCs. Green, black and red corresponds to lower, median and higher gene expression values, respectively.
FIGURE 6
FIGURE 6
Summary schema. Osteogenic medium (OM) and calcium phosphate medium (CaP) trigger distinct mechanism of calcification. We found differential regulated mitochondrial function and a differential role of protein kinase C (PKC). Created with https://Biorender.com.

Similar articles

Cited by

References

    1. Lozano R, Naghavi M, Foreman K, Lim S, Shibuya K, Aboyans V, et al. Global and regional mortality from 235 causes of death for 20 age groups in 1990 and 2010: A systematic analysis for the global burden of disease study 2010. Lancet. (2012) 380:2095–128. 10.1016/s0140-6736(12)61728-0 - DOI - PMC - PubMed
    1. Virani SS, Alonso A, Aparicio HJ, Benjamin EJ, Bittencourt MS, Callaway CW, et al. Heart disease and stroke statistics—2021 update. Circulation. (2021) 143:e254–743. 10.1161/cir.0000000000000950 - DOI - PubMed
    1. Lanzer P, Boehm M, Sorribas V, Thiriet M, Janzen J, Zeller T, et al. Medial vascular calcification revisited: Review and perspectives. Eur Heart J. (2014) 35:1515–25. 10.1093/eurheartj/ehu163 - DOI - PMC - PubMed
    1. Durham AL, Speer MY, Scatena M, Giachelli CM, Shanahan CM. Role of smooth muscle cells in vascular calcification: Implications in atherosclerosis and arterial stiffness. Cardiovasc Res. (2018) 114:590–600. 10.1093/cvr/cvy010 - DOI - PMC - PubMed
    1. Goettsch C, Hutcheson JD, Aikawa M, Iwata H, Pham T, Nykjaer A, et al. Sortilin mediates vascular calcification via its recruitment into extracellular vesicles. J Clin Investigat. (2016) 126:1323–36. 10.1172/jci80851 - DOI - PMC - PubMed