

Exploring bacterioplankton communities and their temporal dynamics in the rearing water of a biofloc-based shrimp (Litopenaeus vannamei) aquaculture system
- PMID: 36204630
- PMCID: PMC9531771
- DOI: 10.3389/fmicb.2022.995699
Exploring bacterioplankton communities and their temporal dynamics in the rearing water of a biofloc-based shrimp (Litopenaeus vannamei) aquaculture system
Abstract
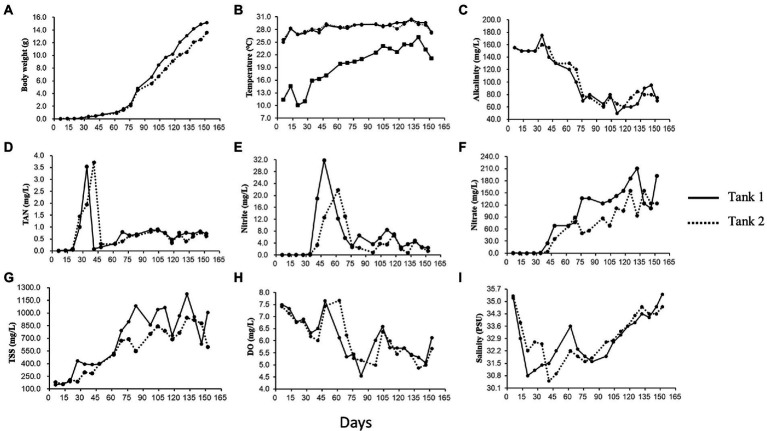
Biofloc technology (BFT) has recently gained considerable attention as a sustainable method in shrimp aquaculture. In a successful BFT system, microbial communities are considered a crucial component in their ability to both improve water quality and control microbial pathogens. Yet, bacterioplankton diversity in rearing water and how bacterioplankton community composition changes with shrimp growth are rarely documented. In this study, the Pacific white shrimp, Litopenaeus vannamei was cultivated in a greenhouse-enclosed BFT system. Rearing water samples were collected on a weekly basis for 5 months (152 days) and water quality variables such as physicochemical parameters and inorganic nutrients were monitored. In parallel, 16S rRNA gene pyrosequencing was employed to investigate the temporal patterns of rearing-water microbiota. The productivity, survival rate, and feed conversion ratio were 3.2-4.4 kg/m3, 74%-89%, and 1.2-1.3, respectively, representing successful super-intensive cultures. The metataxonomic results indicated a highly dynamic bacterioplankton community, with two major shifts over the culture. Members of the phylum Planctomycetes dominated in rearing water during the early stages, while Actinobacteria dominated during the middle stages, and Chloroflexi and TM7 dominated during the late stages of culture. The bacterioplankton community fluctuated more in the beginning but stabilized as the culture progressed. Intriguingly, we observed that certain bacterioplankton groups dominated in a culture-stage-specific manner; these groups include Rhodobacteraceae, Flavobacteriaceae, Actinobacteria, and Chloroflexi, which either contribute to water quality regulation or possess probiotic potential. Altogether, our results indicate that an operationally successful BFT-based aquaculture system favors the growth and dynamics of specific microbial communities in rearing water. Our study expands the scientific understanding of the practical utilization of microbes in sustainable aquaculture. A thorough understanding of rearing-water microbiota and factors influencing their dynamics will help to establish effective management strategies.
Keywords: Litopenaeus vannamei; bacterioplankton community; biofloc technique; probiotics; rearing water; shrimp aquaculture.
Copyright © 2022 Kim, Song, Rajeev, Kim, Kang, Jang and Cho.
Conflict of interest statement
The authors declare that the research was conducted in the absence of any commercial or financial relationships that could be construed as a potential conflict of interest.
Figures


References
-
- Ahmad I., Rani A. B., Verma A. K., Maqsood M. (2017). Biofloc technology: an emerging avenue in aquatic animal healthcare and nutrition. Aquacult. Int. 25, 1215–1226. doi: 10.1007/s10499-016-0108-8 - DOI
-
- Alfiansah Y. R., Hassenrück C., Kunzmann A., Taslihan A., Harder J., Gärdes A. A. M. (2018). Bacterial abundance and community composition in pond water from shrimp aquaculture systems with different stocking densities. Front. Microbiol. 9:2457. doi: 10.3389/fmicb.2018.02457, PMID: - DOI - PMC - PubMed
-
- Anderson J. L., Valderrama D., Jory D. (2016). “Shrimp production review,” in Global Aquaculture Alliance: Presentation Global Aquaculture Production Data and Analysis (Guangzhou: GOAL; ), 1–50.
-
- Andrews S. (2010). FastQC: A quality control tool for high throughput sequence data. Available at: http://www.bioinformatics.babraham.ac.uk/projects/fastqc
-
- Avnimelech Y. (2007). Feeding with microbial flocs by tilapia in minimal discharge bioflocs technology ponds. Aquaculture 264, 140–147. doi: 10.1016/j.aquaculture.2006.11.025 - DOI
LinkOut - more resources
Full Text Sources