

Difference in axon diameter and myelin thickness between excitatory and inhibitory callosally projecting axons in mice
- PMID: 36205478
- PMCID: PMC10068302
- DOI: 10.1093/cercor/bhac329
Difference in axon diameter and myelin thickness between excitatory and inhibitory callosally projecting axons in mice
Abstract
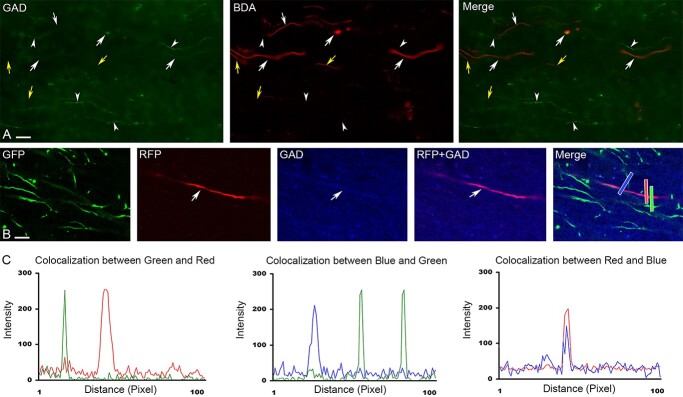
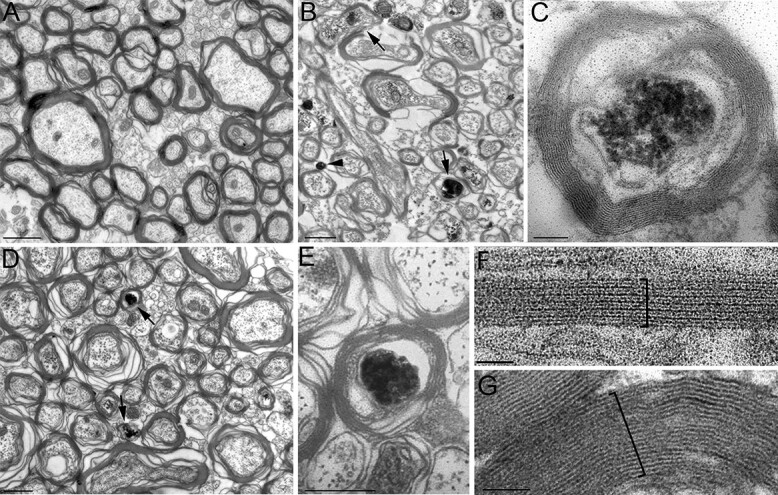
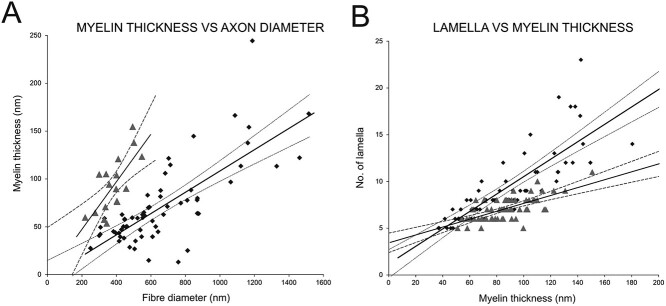
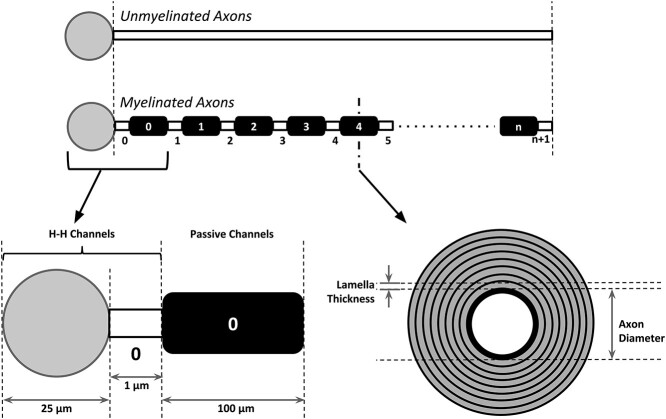
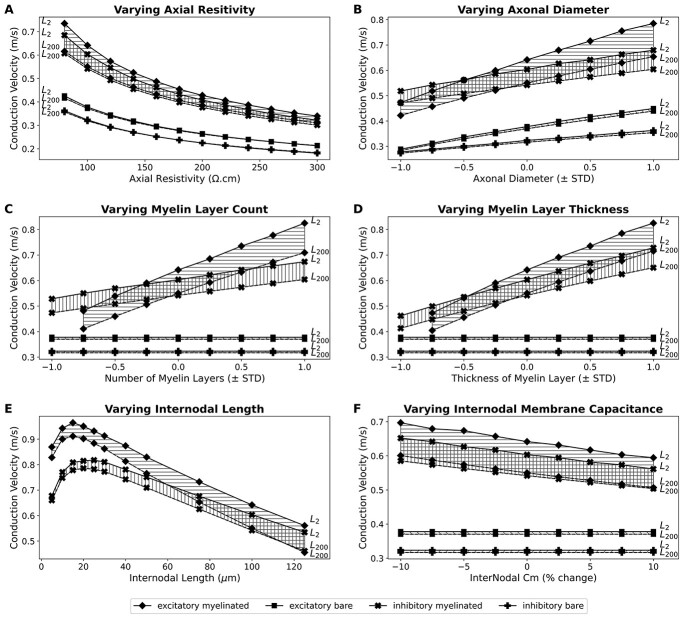
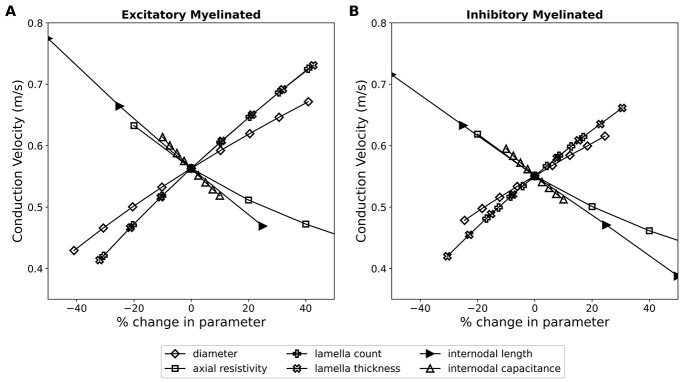
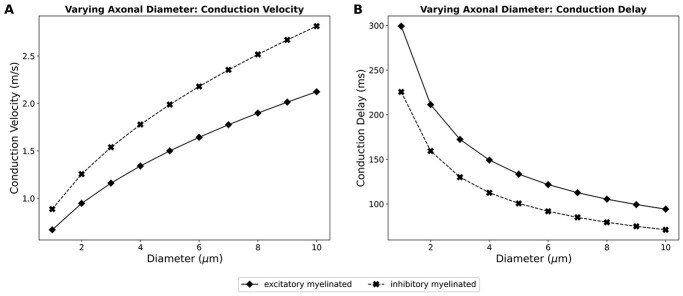
Synchronization of network oscillation in spatially distant cortical areas is essential for normal brain activity. Precision in synchronization between hemispheres depends on the axonal conduction velocity, which is determined by physical parameters of the axons involved, including diameter, and extent of myelination. To compare these parameters in long-projecting excitatory and inhibitory axons in the corpus callosum, we used genetically modified mice and virus tracing to separately label CaMKIIα expressing excitatory and GABAergic inhibitory axons. Using electron microscopy analysis, we revealed that (i) the axon diameters of excitatory fibers (myelinated axons) are significantly larger than those of nonmyelinated excitatory axons; (ii) the diameters of bare axons of excitatory myelinated fibers are significantly larger than those of their inhibitory counterparts; and (iii) myelinated excitatory fibers are significantly larger than myelinated inhibitory fibers. Also, the thickness of myelin ensheathing inhibitory axons is significantly greater than for excitatory axons, with the ultrastructure of the myelin around excitatory and inhibitory fibers also differing. We generated a computational model to investigate the functional consequences of these parameter divergences. Our simulations indicate that impulses through inhibitory and excitatory myelinated fibers reach the target almost simultaneously, whereas action potentials conducted by nonmyelinated axons reach target cells with considerable delay.
Keywords: callosal axons; conduction velocity; impulse propagation; myelination; synchronization.
© The Author(s) 2022. Published by Oxford University Press. All rights reserved. For permissions, please e-mail: journals.permission@oup.com.
Figures
Similar articles
-
The role of oligodendrocytes and myelin on axon maturation in the developing rat retinofugal pathway.J Neurosci. 1994 May;14(5 Pt 1):2594-605. doi: 10.1523/JNEUROSCI.14-05-02594.1994. J Neurosci. 1994. PMID: 7514208 Free PMC article.
-
Development of myelinated nerve fibers in the sixth cranial nerve of the rat: a quantitative electron microscope study.J Comp Neurol. 1987 Jun 22;260(4):491-500. doi: 10.1002/cne.902600403. J Comp Neurol. 1987. PMID: 3611408
-
Human intraretinal myelination: axon diameters and axon/myelin thickness ratios.Indian J Ophthalmol. 2013 Oct;61(10):567-75. doi: 10.4103/0301-4738.121075. Indian J Ophthalmol. 2013. PMID: 24212308 Free PMC article.
-
The acquisition of myelin: a success story.Novartis Found Symp. 2006;276:15-21; discussion 21-5, 54-7, 275-81. doi: 10.1002/9780470032244.ch3. Novartis Found Symp. 2006. PMID: 16805421 Review.
-
Regulation of conduction time along axons.Neuroscience. 2014 Sep 12;276:126-34. doi: 10.1016/j.neuroscience.2013.06.047. Epub 2013 Jun 29. Neuroscience. 2014. PMID: 23820043 Free PMC article. Review.
Cited by
-
Myelin Lipid Composition in the Central Nervous System Is Regionally Distinct and Requires Mechanistic Target of Rapamycin Signaling.Glia. 2025 Sep;73(9):1841-1859. doi: 10.1002/glia.70042. Epub 2025 May 26. Glia. 2025. PMID: 40417825 Free PMC article.
-
The maps of meaning consciousness theory.Front Psychol. 2024 Mar 22;15:1161132. doi: 10.3389/fpsyg.2024.1161132. eCollection 2024. Front Psychol. 2024. PMID: 38659681 Free PMC article.
-
Testing retrogenesis and physiological explanations for tract-wise white matter aging: links to developmental order, fiber calibre, and vascularization.Geroscience. 2025 Jul 15. doi: 10.1007/s11357-025-01773-9. Online ahead of print. Geroscience. 2025. PMID: 40660078
-
Serum immunoreactivity to neurofilament-medium shows high sensitivity and specificity in patients with Behçet disease.RMD Open. 2025 May 30;11(2):e005100. doi: 10.1136/rmdopen-2024-005100. RMD Open. 2025. PMID: 40447321 Free PMC article.
-
Quantitative magnetization transfer and g-ratio imaging of white matter myelin in early psychotic spectrum disorders.Mol Psychiatry. 2025 Jun;30(6):2739-2747. doi: 10.1038/s41380-024-02883-0. Epub 2025 Jan 8. Mol Psychiatry. 2025. PMID: 39779900
References
-
- Aboitiz F, Scheibel AB, Fisher RS, Zaidel E. Fiber composition of the human corpus callosum. Brain Res. 1992:598:143–153. - PubMed
-
- Alonso A, Kohler C. Evidence for separate projections of hippocampal pyramidal and non-pyramidal neurons to different parts of the septum in the rat brain. Neurosci Lett. 1982:31:209–214. - PubMed
Publication types
MeSH terms
Grants and funding
LinkOut - more resources
Full Text Sources
