Randomized Controlled Trial
. 2022 Dec 19;116(6):1515-1529.
doi: 10.1093/ajcn/nqac286.

A red wine intervention does not modify plasma trimethylamine N-oxide but is associated with broad shifts in the plasma metabolome and gut microbiota composition

Affiliations
Randomized Controlled Trial

A red wine intervention does not modify plasma trimethylamine N-oxide but is associated with broad shifts in the plasma metabolome and gut microbiota composition

Elisa A Haas et al. Am J Clin Nutr. .

Abstract

Background: Gut microbiota profiles are closely related to cardiovascular diseases through mechanisms that include the reported deleterious effects of metabolites, such as trimethylamine N-oxide (TMAO), which have been studied as diagnostic and therapeutic targets. Moderate red wine (RW) consumption is reportedly cardioprotective, possibly by affecting the gut microbiota.

Objectives: To investigate the effects of RW consumption on the gut microbiota, plasma TMAO, and the plasma metabolome in men with documented coronary artery disease (CAD) using a multiomics assessment in a crossover trial.

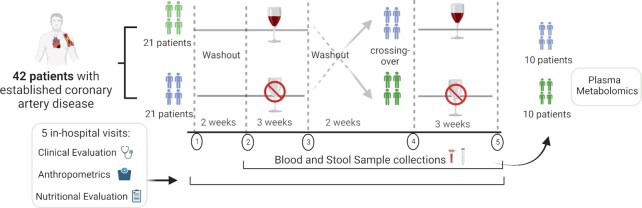
Methods: We conducted a randomized, crossover, controlled trial involving 42 men (average age, 60 y) with documented CAD comparing 3-wk RW consumption (250 mL/d, 5 d/wk) with an equal period of alcohol abstention, both preceded by a 2-wk washout period. The gut microbiota was analyzed via 16S rRNA high-throughput sequencing. Plasma TMAO was evaluated by LC-MS/MS. The plasma metabolome of 20 randomly selected participants was evaluated by ultra-high-performance LC-MS/MS. The effect of RW consumption was assessed by individual comparisons using paired tests during the abstention and RW periods.

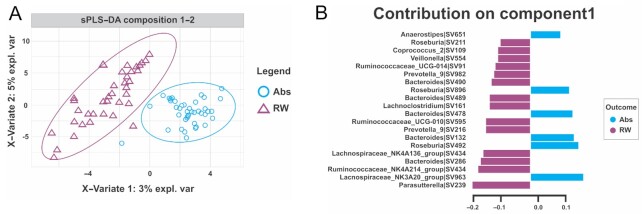
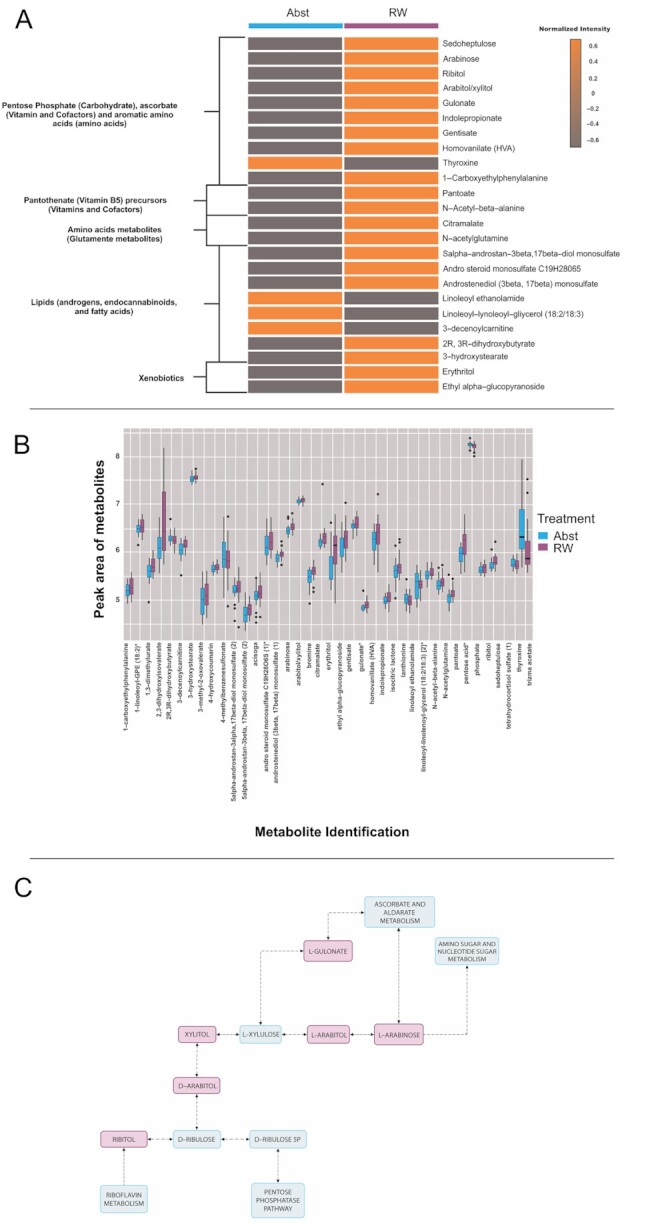
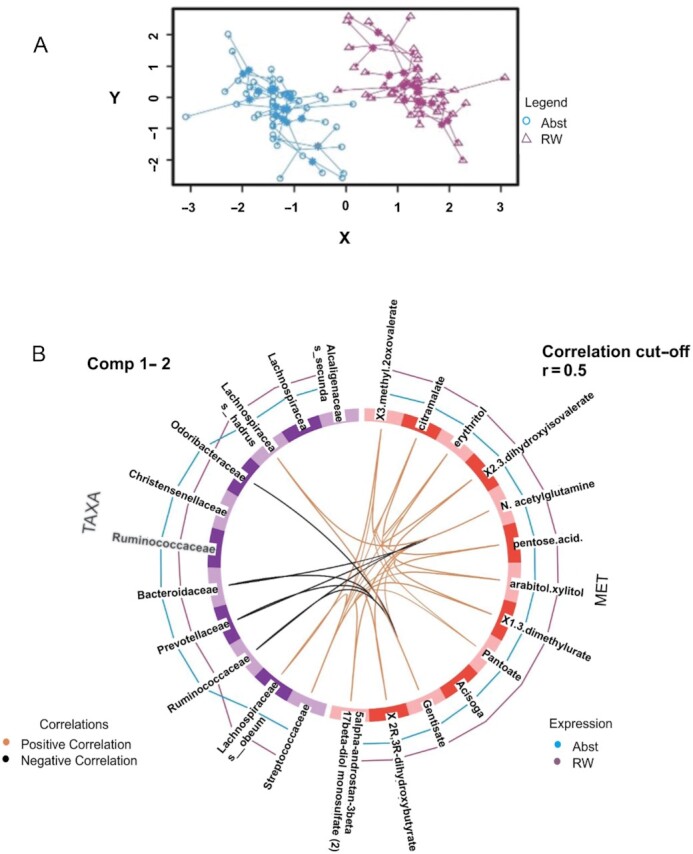
Results: Plasma TMAO did not differ between RW intervention and alcohol abstention, and TMAO concentrations showed low intraindividual concordance over time, with an intraclass correlation coefficient of 0.049 during the control period. After RW consumption, there was significant remodeling of the gut microbiota, with a difference in β diversity and predominance of Parasutterella, Ruminococcaceae, several Bacteroides species, and Prevotella. Plasma metabolomic analysis revealed significant changes in metabolites after RW consumption, consistent with improved redox homeostasis.

Conclusions: Modulation of the gut microbiota may contribute to the putative cardiovascular benefits of moderate RW consumption. The low intraindividual concordance of TMAO presents challenges regarding its role as a cardiovascular risk biomarker at the individual level. This study was registered at clinical trials.gov as NCT03232099.

Keywords: coronary artery disease; gut microbiota; metabolomics; redox; trimethylamine N-oxide (TMAO); wine.


Figures

FIGURE 1
FIGURE 1
Study design. A total of 42 patients with established coronary artery disease were randomly selected for 1 of the 2 groups in the crossover study involving red wine (RW) consumption for 3 wk or alcohol abstention for 3 wk. All patients were evaluated over 5 in-hospital visits for anthropometrics and clinical and nutritional assessments. After an initial evaluation, there was a 2-wk washout period when patients were instructed not to consume alcoholic beverages, fermented foods (yogurt, kombucha, soy lecithin, kefir, sauerkraut, and other fermented veggies), synthetic prebiotics (insulin, fructooligosaccharides), fiber, dairy, food polyphenols (grapes, grape juice, cranberries, strawberries), and probiotics. Samples were collected after the first 2-wk washout period, and patients were randomly assigned for a 3-wk intervention with RW consumption (250 mL/d, 5 d/wk) or 3 wk of alcohol abstention. After these 3 wk, new blood and stool samples were collected, and another 2-wk washout period was implemented. Then, new samples were collected, and patients crossed over: the group that received RW was instructed to abstain from alcohol for 3 wk, and the group that abstained from alcohol in the first 3 wk received RW. After the second 3-wk period, stool and blood samples were collected in both groups. In 20 randomly selected patients (10 from each group), plasma metabolomics was analyzed after the 2 washout periods and after the intervention with RW and abstention.
FIGURE 2
FIGURE 2
Sparse partial least squares–discriminant analysis (sPLS-DA). (A) The plot of the 2-component sPLS-DA model showed stool sample clustering according to red wine consumption (RW) or not (Abs). The percentage of variance captured for each principal component (x-axis for the first component and y-axis for the second component) for each study period (RW compared with abstention). The sPLS-DA plot is based on the relative abundance of bacterial taxa in the gut microbiota from the Abs group (blue circle) or RW group (purple triangle) and their 95% confidence ellipses. (B) The contribution plot indicates each genus's contribution to the first component of sPLS-DA. Genus contribution ranked from the bottom (most important) to the top. The colors blue (Abs) and purple (RW) indicate the group in which the genus is most abundant. The horizontal graduation line represents the variance explained by the single genera.
FIGURE 3
FIGURE 3
Untargeted plasma metabolome alterations in 20 subjects. (A) Heatmap showing metabolites that were significantly different between the red wine (RW) and abstention (Abst) periods. According to the metabolic pathways and biochemical functions, the graph highlights the most clinically relevant metabolites that were significantly different between the 2 periods of the study (P < 0.05, without adjustments for multiple comparisons). (B) Box-and-whisker plot of the distribution of the discriminating metabolites that were significantly altered after RW consumption compared with the abstention period. (C) Pentose and glucoronate interconversions adapted from Kyoto Encyclopedia of Genes and Genomes pathway analysis (62). In red are the metabolites that were significantly increased after RW, and in blue are the putative pathways these metabolites are involved with. Arrows indicate the direction of the reaction and reversible and irreversible reactions, which are indicated by bidirectional and unidirectional arrows, respectively. Bold lines indicate activation or interaction. Dashed lines indicate an indirect link or unknown reaction.
FIGURE 4
FIGURE 4
Correlation matrix and multiomics data integration analysis. (A) In the arrow plot, the arrow origin indicates the centroid among all data sets for a given sample, and the tips of the arrows indicate the location of that sample in each block. These graphs highlight the agreement among all data sets at the sample level when modeled with DIABLO. The 2 omics (microbiota taxa and metabolomics) data sets performed well in separating the 2 interventions: red wine (RW) and abstention (Abst). (B) The line outside each circle indicates the group with which each feature is associated [taxa, on the right side of the circle or metabolites (MET), on the left side]. The purple line represents biomarkers associated with the RW period, whereas the blue lines represent those associated with the abstention period. The higher the line is, the higher the discrimination power of the feature. The line inside the circle represents the correlation between the taxa and the metabolites (an orange line indicates a positive correlation, and a black line indicates a negative correlation). The correlation cutoff was set to 0.5.

References

    1. Tang WHW, Bäckhed F, Landmesser U, Hazen SL. Intestinal microbiota in cardiovascular health and disease: JACC state-of-the-art review. J Am Coll Cardiol. 2019;73(16):2089–105. - PMC - PubMed
    1. Chadaideh KS, Carmody RN. Host-microbial interactions in the metabolism of different dietary fats. Cell Metab. 2021;33(5):857–72. - PubMed
    1. Alexander M, Turnbaugh PJ. Deconstructing mechanisms of diet-microbiome-immune interactions. Immunity. 2020;53(2):264–76. - PMC - PubMed
    1. Senthong V, Li XS, Hudec T, Coughlin J, Wu Y, Levison Bet al. . Plasma trimethylamine N-oxide, a gut microbe–generated phosphatidylcholine metabolite, is associated with atherosclerotic burden. J Am Coll Cardiol. 2016;67(22):2620–8. - PMC - PubMed
    1. Mitchell SM, Milan AM, Mitchell CJ, Gillies NA, D'Souza RF, Zeng Net al. . Protein intake at twice the RDA in older men increases circulatory concentrations of the microbiome metabolite trimethylamine-N-oxide (TMAO). Nutrients. 2019;11(9):2207. - PMC - PubMed

Publication types

Associated data