CST/Polα/primase-mediated fill-in synthesis at DSBs
- PMID: 36205622
- PMCID: PMC9879193
- DOI: 10.1080/15384101.2022.2123886
CST/Polα/primase-mediated fill-in synthesis at DSBs
Abstract
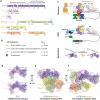
DNA double-strand breaks (DSBs) pose a major threat to the genome, so the efficient repair of such breaks is essential. DSB processing and repair is affected by 53BP1, which has been proposed to determine repair pathway choice and/or promote repair fidelity. 53BP1 and its downstream effectors, RIF1 and shieldin, control 3' overhang length, and the mechanism has been a topic of intensive research. Here, we highlight recent evidence that 3' overhang control by 53BP1 occurs through fill-in synthesis of resected DSBs by CST/Polα/primase. We focus on the crucial role of fill-in synthesis in BRCA1-deficient cells treated with PARPi and discuss the notion of fill-in synthesis in other specialized settings and in the repair of random DSBs. We argue that - in addition to other determinants - repair pathway choice may be influenced by the DNA sequence at the break which can impact CST binding and therefore the deployment of Polα/primase fill-in.
Keywords: 53BP1; CST; DSB repair; Polα/primase.
Conflict of interest statement
T.d.L. is a member of the SAB of Calico, LLC, San Francisco, USA. The other authors have no competing interests.
Figures


Similar articles
-
53BP1-shieldin-dependent DSB processing in BRCA1-deficient cells requires CST-Polα-primase fill-in synthesis.Nat Cell Biol. 2022 Jan;24(1):51-61. doi: 10.1038/s41556-021-00812-9. Epub 2022 Jan 13. Nat Cell Biol. 2022. PMID: 35027730 Free PMC article.
-
53BP1-RIF1-shieldin counteracts DSB resection through CST- and Polα-dependent fill-in.Nature. 2018 Aug;560(7716):112-116. doi: 10.1038/s41586-018-0324-7. Epub 2018 Jul 18. Nature. 2018. PMID: 30022158 Free PMC article.
-
Shieldin and CST co-orchestrate DNA polymerase-dependent tailed-end joining reactions independently of 53BP1-governed repair pathway choice.Nat Struct Mol Biol. 2025 Jan;32(1):86-97. doi: 10.1038/s41594-024-01381-9. Epub 2024 Sep 3. Nat Struct Mol Biol. 2025. PMID: 39227718 Free PMC article.
-
53BP1: a DSB escort.Genes Dev. 2020 Jan 1;34(1-2):7-23. doi: 10.1101/gad.333237.119. Genes Dev. 2020. PMID: 31896689 Free PMC article. Review.
-
Regulation of DNA double-strand break repair pathway choice: a new focus on 53BP1.J Zhejiang Univ Sci B. 2021 Jan 15;22(1):38-46. doi: 10.1631/jzus.B2000306. J Zhejiang Univ Sci B. 2021. PMID: 33448186 Free PMC article. Review.
Cited by
-
CST-Polα/Primase: the second telomere maintenance machine.Genes Dev. 2023 Jul 1;37(13-14):555-569. doi: 10.1101/gad.350479.123. Epub 2023 Jul 26. Genes Dev. 2023. PMID: 37495394 Free PMC article. Review.
-
Lagging Strand Initiation Processes in DNA Replication of Eukaryotes-Strings of Highly Coordinated Reactions Governed by Multiprotein Complexes.Genes (Basel). 2023 Apr 29;14(5):1012. doi: 10.3390/genes14051012. Genes (Basel). 2023. PMID: 37239371 Free PMC article. Review.
-
POT1 recruits and regulates CST-Polα/primase at human telomeres.Cell. 2024 Jul 11;187(14):3638-3651.e18. doi: 10.1016/j.cell.2024.05.002. Epub 2024 Jun 4. Cell. 2024. PMID: 38838667 Free PMC article.
-
An AlphaFold2 map of the 53BP1 pathway identifies a direct SHLD3-RIF1 interaction critical for shieldin activity.EMBO Rep. 2023 Aug 3;24(8):e56834. doi: 10.15252/embr.202356834. Epub 2023 Jun 12. EMBO Rep. 2023. PMID: 37306046 Free PMC article.
-
DSS1 restrains BRCA2's engagement with dsDNA for homologous recombination, replication fork protection, and R-loop homeostasis.Nat Commun. 2024 Aug 17;15(1):7081. doi: 10.1038/s41467-024-51557-6. Nat Commun. 2024. PMID: 39152168 Free PMC article.
References
MeSH terms
Substances
Grants and funding
LinkOut - more resources
Full Text Sources
Miscellaneous
