. 2022 Dec 5;61(49):e202211320.
doi: 10.1002/anie.202211320. Epub 2022 Nov 9.

Glycan Modulation of Insulin-like Growth Factor-1 Receptor

Affiliations

Glycan Modulation of Insulin-like Growth Factor-1 Receptor

Rio S Boothello et al. Angew Chem Int Ed Engl. .

Abstract

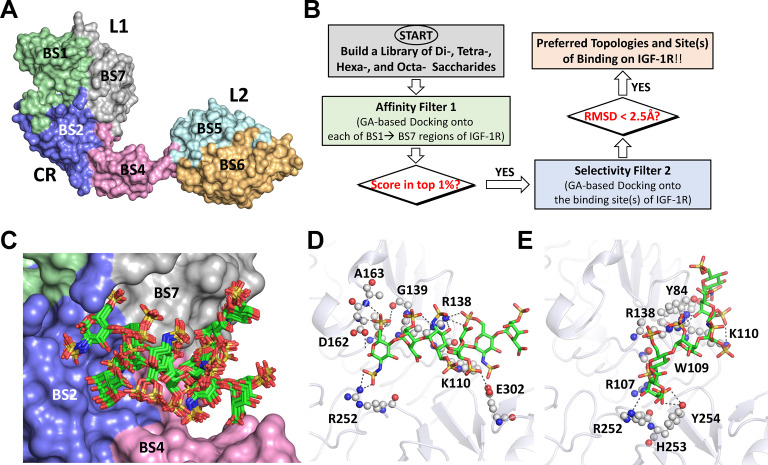
The insulin-like growth factor-1 receptor (IGF-1R) is a receptor tyrosine kinase (RTK) that plays critical roles in cancer. Microarray, computational, thermodynamic, and cellular imaging studies reveal that activation of IGF-1R by its cognate ligand IGF1 is inhibited by shorter, soluble heparan sulfate (HS) sequences (e.g., HS06), whereas longer polymeric chains do not inhibit the RTK, a phenomenon directly opposed to the traditional relationship known for GAG-protein systems. The inhibition arises from smaller oligosaccharides binding in a unique pocket in the IGF-1R ectodomain, which competes with the natural cognate ligand IGF1. This work presents a highly interesting observation on preferential and competing inhibition of IGF-1R by smaller sequences, whereas polysaccharides are devoid of this function. These insights will be of major value to glycobiologists and anti-cancer drug discoverers.

Keywords: Drug Discovery; Glycosaminoglycans; Growth Factors; Heparan Sulfate; Receptor Tyrosine Kinases.


Conflict of interest statement

The authors declare no conflict of interest.

Figures

Figure 1
Figure 1
A) Structural model of IGF‐1R. Each monomeric ectodomain consists of L1, L2, CR, Fn1, Fn2, and Fn3 domains that assemble into a unique Π‐shape formed by two inverted “J‐shaped” monomer chains running opposite to each other. B) Binding of one IGF1 molecule initiates a conformational change that brings the two TM domains in close proximity resulting in activation. C) Structures of 24 HS oligosaccharides printed on the microarray. See underneath for notation of residues. D) Plot showing quantitative fluorescence intensities for each HS oligosaccharide of the microarray. Error bars are ±1 SE. (E and F) Spectrofluorimetry‐based studies of IGF‐1R binding to HS06 (E) and HS12 (F) in the presence of varying concentrations of IGF1 (10–80 nM). The fluorescence signal from AlexFluorTM labeled IGF‐1R was used to monitor the interactions. G) Shows the variation in K D,obs as a function of IGF1 concentration for IGF‐1R complexes with HS06 (circles) and HS12 (squares). Solid lines represent linear fits. H) describes the equilibria based on these studies. A IGF‐1R‐HS06‐IGF1 ternary complex is unlikely to form because HS06 and IGF1 compete with each other for IGF‐1R, while HS12 does not compete with IGF1 for binding to IGF‐1R.
Figure 2
Figure 2
Smaller oligosaccharides, e.g., HS06, but not polysaccharide (HS36), bind preferentially to cell surface IGF‐1R and compete with IGF1. A) and B) Images of fluorescence stained HT‐29 spheroids prepared from either IGF‐1R knockdown (KD) or scrambled cell lines and incubated with 20 μM HS06‐AF594 (red, Panel A) or 20 μM HS36‐AF594 (red, Panel B) for 20 mins. C) and D) Representative images of fluorescence stained HT‐29 spheroids pre‐treated with IGF‐1R N‐terminal antibodies Ab2184–283 (0 to 10 ng mL−1) for 2 hrs and then incubated with 20 μM HS06‐AF594 (red; C) or 20 μM HS36‐AF594 (red; D) for 20 mins. (E and F). Representative images of fluorescence stained HT‐29 spheroids pre‐treated with 0–20 ng mL−1 IGF1 followed by treatment with 20 μM HS06‐AF594 (red, Panel E) or 20 μM HS36‐AF594 (red, Panel F) for 20 min. For all panels, nuclei were counterstained with DAPI (blue). Average relative fluorescence units (RFUs) at the single cell level (i.e., total intensity/number of cells) are shown in bar graphs. The scale bar in each image represents 30 μm. Data represent mean±S.E. *p<0.005 vs. scrambled and vehicle controls (A&B; C&D). *p<0.01 vs. vehicle controls (E&F).
Figure 3
Figure 3
Identification of the putative HS binding site on human IGF‐1R using CVLS algorithm. A) The surface of extracellular domain of hIGF‐1R was divided into 7 overlapping regions (BS1–BS7; Note: BS3 is on the back side) in an unbiased manner as potentially engaging HS chain(s). B) The dual‐filter CVLS algorithm used to study di‐ (HS02) to octa‐ (HS08) sequences binding to IGF‐1R. GA=genetic algorithm; RMSD=root‐mean‐square‐deviation. See review Curr. Opin. Struct. Biol. 2018, 50, 91–100 for more details. C) Overlay of the preferred poses of HS06 identified by CVLS onto IGF‐1R in the interface between the L1 and CR domains. CVLS predicted two preferred binding poses. HS06 is shown as sticks (green & red). Note: Results for HS02‐HS08 sequences are shown in Figure S16. D) and E) Recognition of the two preferred poses of HS06 by amino acid residues in the interface of L1 and CR domain. Multiple directional H‐bonds with R107, K110, R138 and R252 of IGF‐1R were predicted by CVLS. The interacting residues are shown as white/grey spheres.
Figure 4
Figure 4
HS06, but not HS36, preferentially inhibits cell surface IGF‐1R, which is competitively reversed by IGF1. (Panels A and B): Representative images of immunofluorescence stained HT‐29 spheroids with pIGF‐1R (green; AlexaFluor488). The spheroids were pre‐incubated with either 0–50 μM HS06 (A) or HS36 (B) for 20 mins. (Panels C and D): Representative images of immunofluorescence stained HT‐29 spheroids pre‐treated with 0–20 ng mL−1 IGF1 followed by treatment with either 20 μM HS06 (C) or 20 μM HS36 (D) for 20 min. Nuclei were counterstained with DAPI (blue). Average relative fluorescence units (RFUs) at the single cell level (A&B) or precent change in relative fluorescence (ΔF/F 0) normalized to respective vehicle controls (C&D) corresponding to the experiments are shown in bar graphs The scale bar in each image represents 30 μm. Data represent mean±S.E. *p<0.05 vs. respective vehicle controls. Although several biological replicates were studied, the averages presented are from two biological replicates, each of which involve a minimum count of 150–200 cells.
Figure 5
Figure 5
Identification of the site of HS06 binding on hIGF‐1R. (Panels A and B): Representative immunofluorescence images of HT‐29 spheroids from expressing wild‐type or mutant IGF‐1R. The generation of HS06 binding site mutant cell lines is described in the Methods section. A) Immunofluorescence staining with IGF‐1R (red; AlexaFluor568); B) Immunofluorescence staining of spheroids pre‐incubated with 20 μM HS06 for 20 mins. ΔF/F 0 (%) represents relative fluorescence change compared to WT controls. Data represent mean±S.E. *p<0.05. (Panels C–F) Representative images of fluorescence‐stained HS06 binding site mutant HT‐29 spheroids for WT (C), R107 (D), R138A (E) and R107+R138A (F) with either vehicle (water) or 20 μM HS06‐AlexaFluor594 for 20 min. Nuclei were counterstained with DAPI (blue). ΔF/F 0 (%) corresponding to the experiments are shown underneath the images from the average relative fluorescence units (RFUs) at the single cell level (i.e., total intensity/number of cells). The change in fluorescence was calculated from the observed fluorescence minus background (AF594). The scale bar in each image represents 30 μm. Data represent mean ± S.E. *p<0.005 vs. vehicle control. Although several biological replicates were studied, the averages presented are from two biological replicates, each of which involve a minimum count of 150–200 cells.

References

    1. Adams T. E., Epa V. C., Garrett T. P., Ward C. W., Cell. Mol. Life Sci. 2000, 57, 1050–1093. - PMC - PubMed
    1. Yuan J., Yin Z., Tao K., Wang G., Gao J., Oncol. Lett. 2018, 15, 41–47. - PMC - PubMed
    1. Teng C. F., Jeng L. B., Shyu W. C., Cell. Transplant. 2018, 27, 1313–1319. - PMC - PubMed
    1. Sharon C., Baranwal S., Patel N. J., Rodriguez-Agudo D., Pandak W. M., Majumdar A. P., Krystal G., Patel B. B., Oncotarget 2015, 6, 15332–15347. - PMC - PubMed
    1. Yin M., Guan X., Liao Z., Wei Q., Am. J. Transl. Res. 2009, 1, 101–114. - PMC - PubMed

Publication types

LinkOut - more resources