

Cervical length distribution among Brazilian pregnant population and risk factors for short cervix: A multicenter cross-sectional study
- PMID: 36206265
- PMCID: PMC9544154
- DOI: 10.1371/journal.pone.0272128
Cervical length distribution among Brazilian pregnant population and risk factors for short cervix: A multicenter cross-sectional study
Abstract
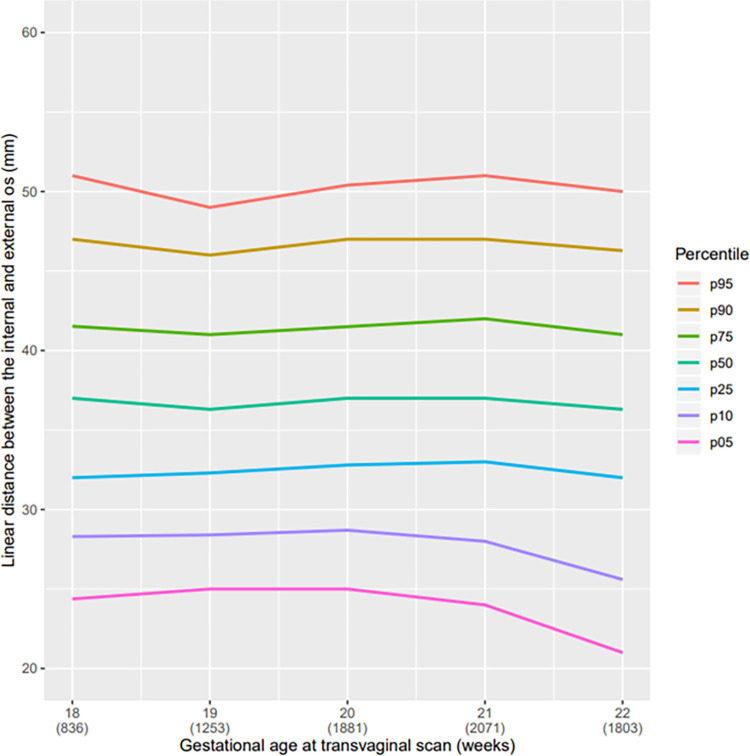
Objective: Since there are populational differences and risk factors that influence the cervical length, the aim of the study was to construct a populational curve with measurements of the uterine cervix of pregnant women in the second trimester of pregnancy and to evaluate which variables were related to cervical length (CL) ≤25 mm.
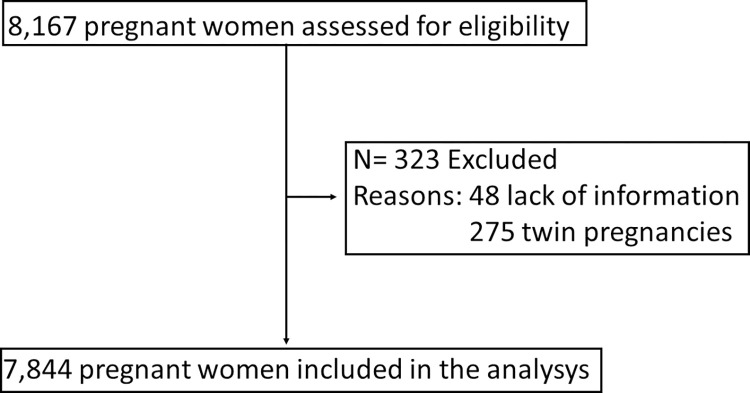
Materials and methods: This was a multicenter cross-sectional study performed at 17 hospitals in several regions of Brazil. From 2015 to 2019, transvaginal ultrasound scan was performed in women with singleton pregnancies at 18 0/7 to 22 6/7 weeks of gestation to measure the CL. We analyzed CL regarding its distribution and the risk factors for CL ≤25 mm using logistic regression.
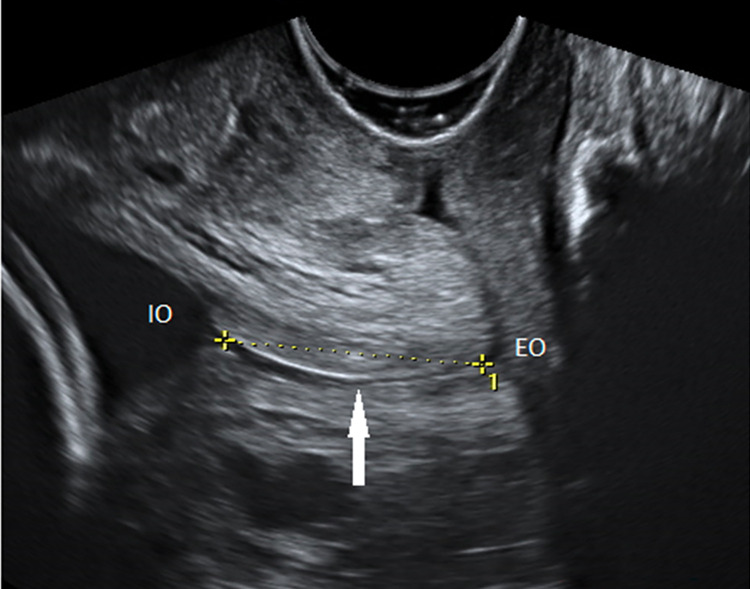
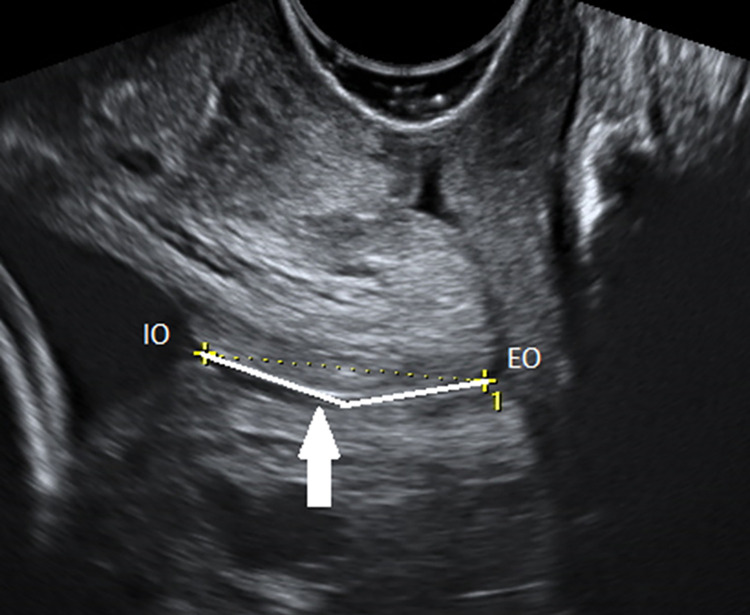
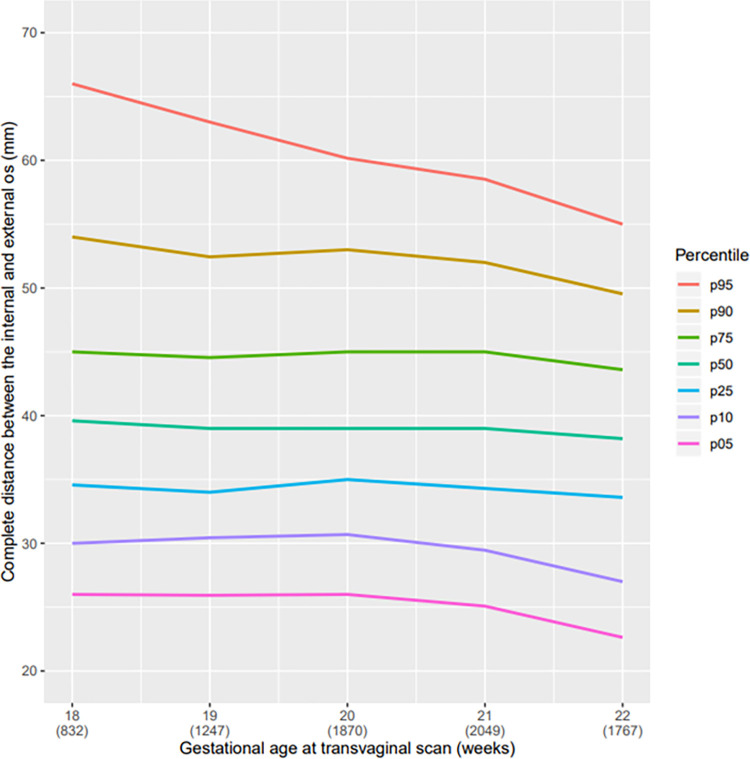
Results: The percentage of CL ≤ 25mm was 6.67%. Shorter cervices, when measured using both straight and curve techniques, showed similar results: range 21.0-25.0 mm in straight versus 22.6-26.0 mm in curve measurement for the 5th percentile. However, the difference between the two techniques became more pronounced after the 75th percentile (range 41.0-42.0 mm straight x 43.6-45.0 mm in curve measurement). The risk factors identified for short cervix were low body mass index (BMI) (OR: 1.81 CI: 1.16-2.82), higher education (OR: 1.39 CI: 1.10-1.75) and personal history ([one prior miscarriage OR: 1.41 CI: 1.11-1.78 and ≥2 prior miscarriages OR: 1.67 CI: 1.24-2.25], preterm birth [OR: 1.70 CI: 1.12-2.59], previous low birth weight <2500 g [OR: 1.70 CI: 1.15-2.50], cervical surgery [OR: 4.33 CI: 2.58-7.27]). By contrast, obesity (OR: 0.64 CI: 0.51-0.82), living with a partner (OR: 0.76 CI: 0.61-0.95) and previous pregnancy (OR: 0.46 CI: 0.37-0.57) decreased the risk of short cervix.
Conclusions: The CL distribution showed a relatively low percentage of cervix ≤25 mm. There may be populational differences in the CL distribution and this as well as the risk factors for short CL need to be considered when adopting a screening strategy for short cervix.
Conflict of interest statement
The authors have declared that no competing interests exist.
Figures
References
-
- Iams JD, Goldenberg RL, Meis PJ, Mercer BM, Moawad A, Das A, et al.. The length of the cervix and the risk of spontaneous premature delivery. National Institute of Child Health and Human Development Maternal Fetal Medicine Unit Network. N Engl J Med. 1996;334(9):567–72. doi: 10.1056/NEJM199602293340904 - DOI - PubMed
-
- Romero R, Nicolaides KH, Conde-Agudelo A, O’Brien JM, Cetingoz E, Da Fonseca E, et al.. Vaginal progesterone decreases preterm birth </ = 34 weeks of gestation in women with a singleton pregnancy and a short cervix: an updated meta-analysis including data from the OPPTIMUM study. Ultrasound Obstet Gynecol. 2016;48(3):308–17. doi: 10.1002/uog.15953 - DOI - PMC - PubMed
